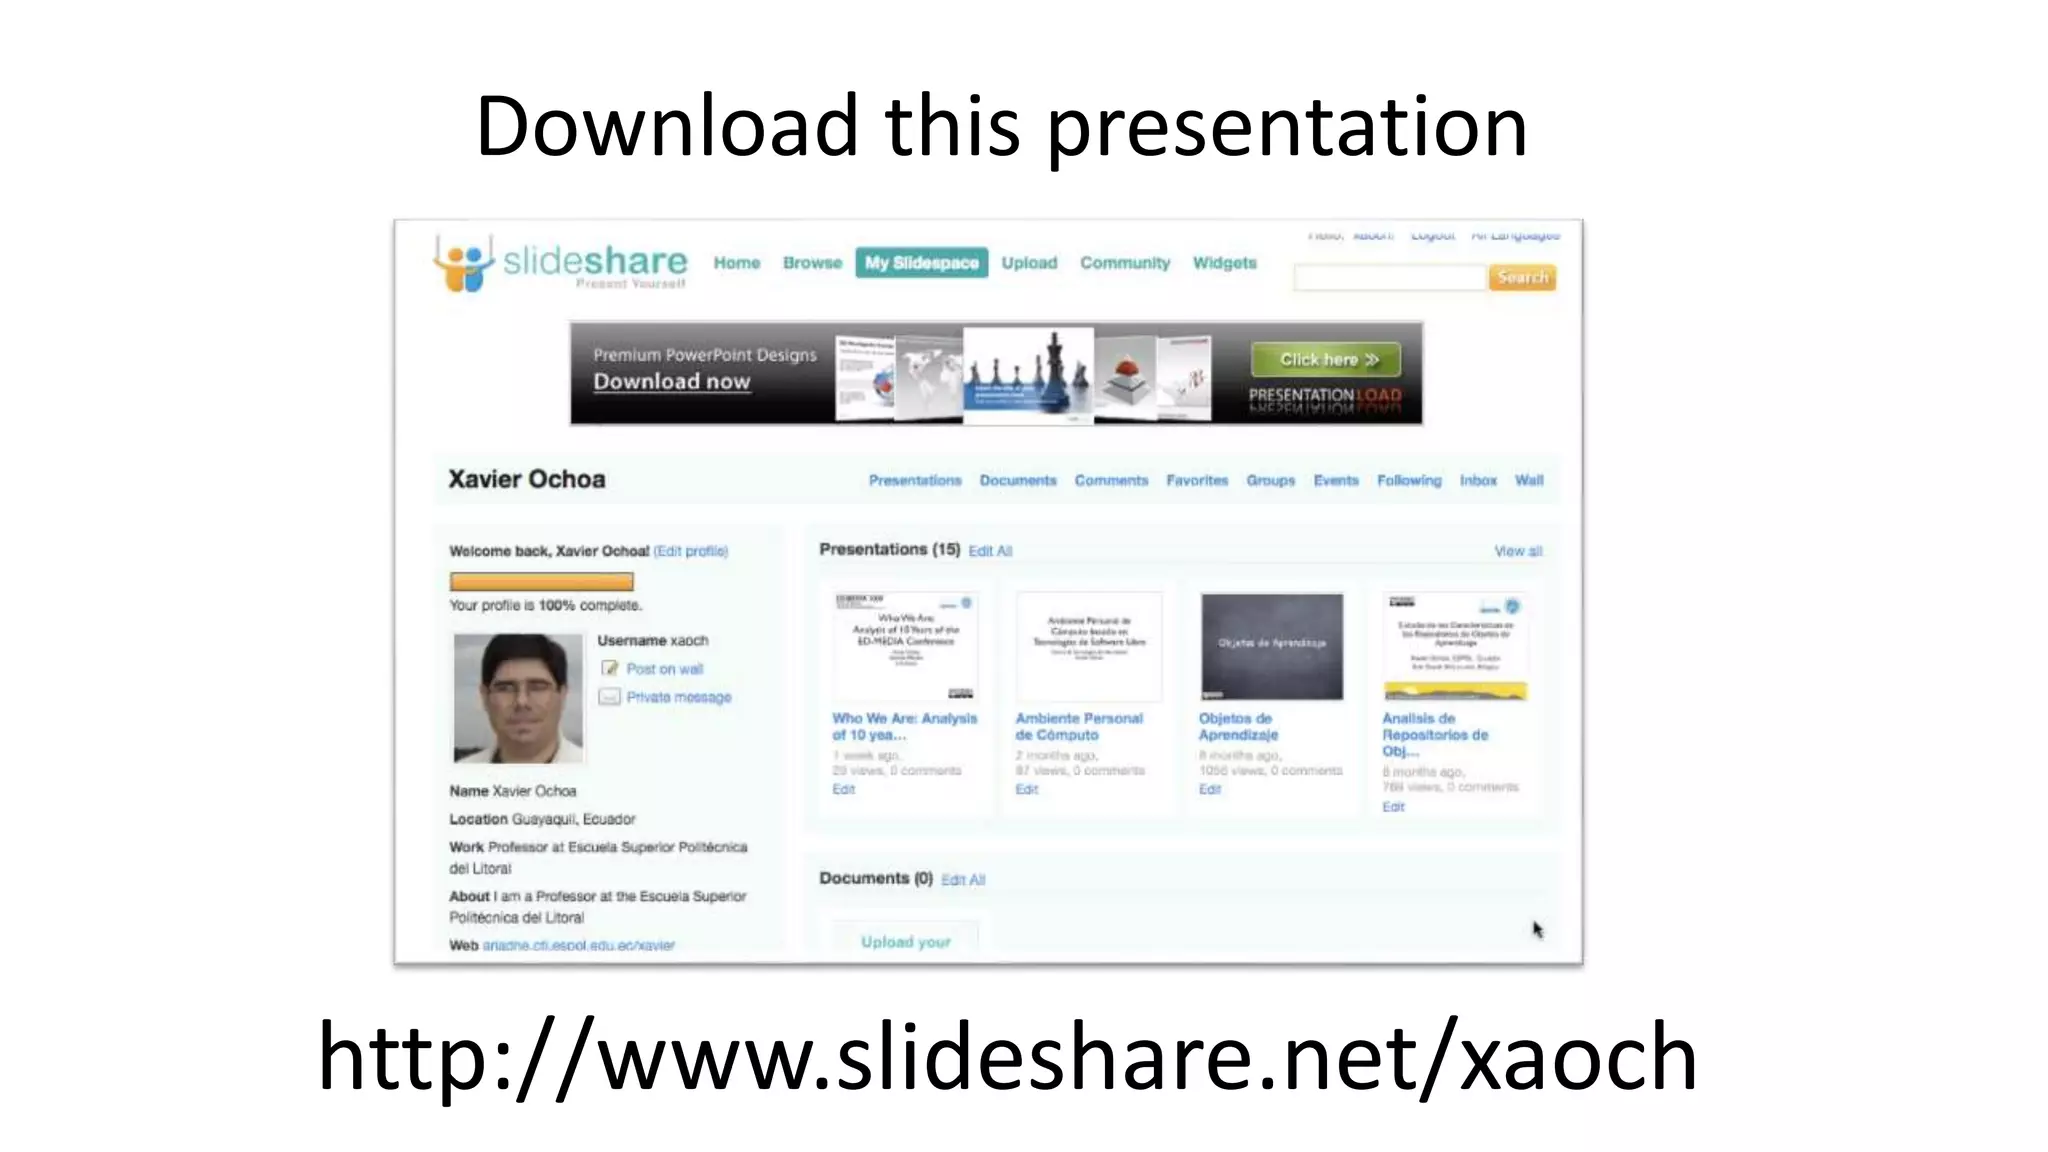
Downloaded 33 times


![Analysis at problem level
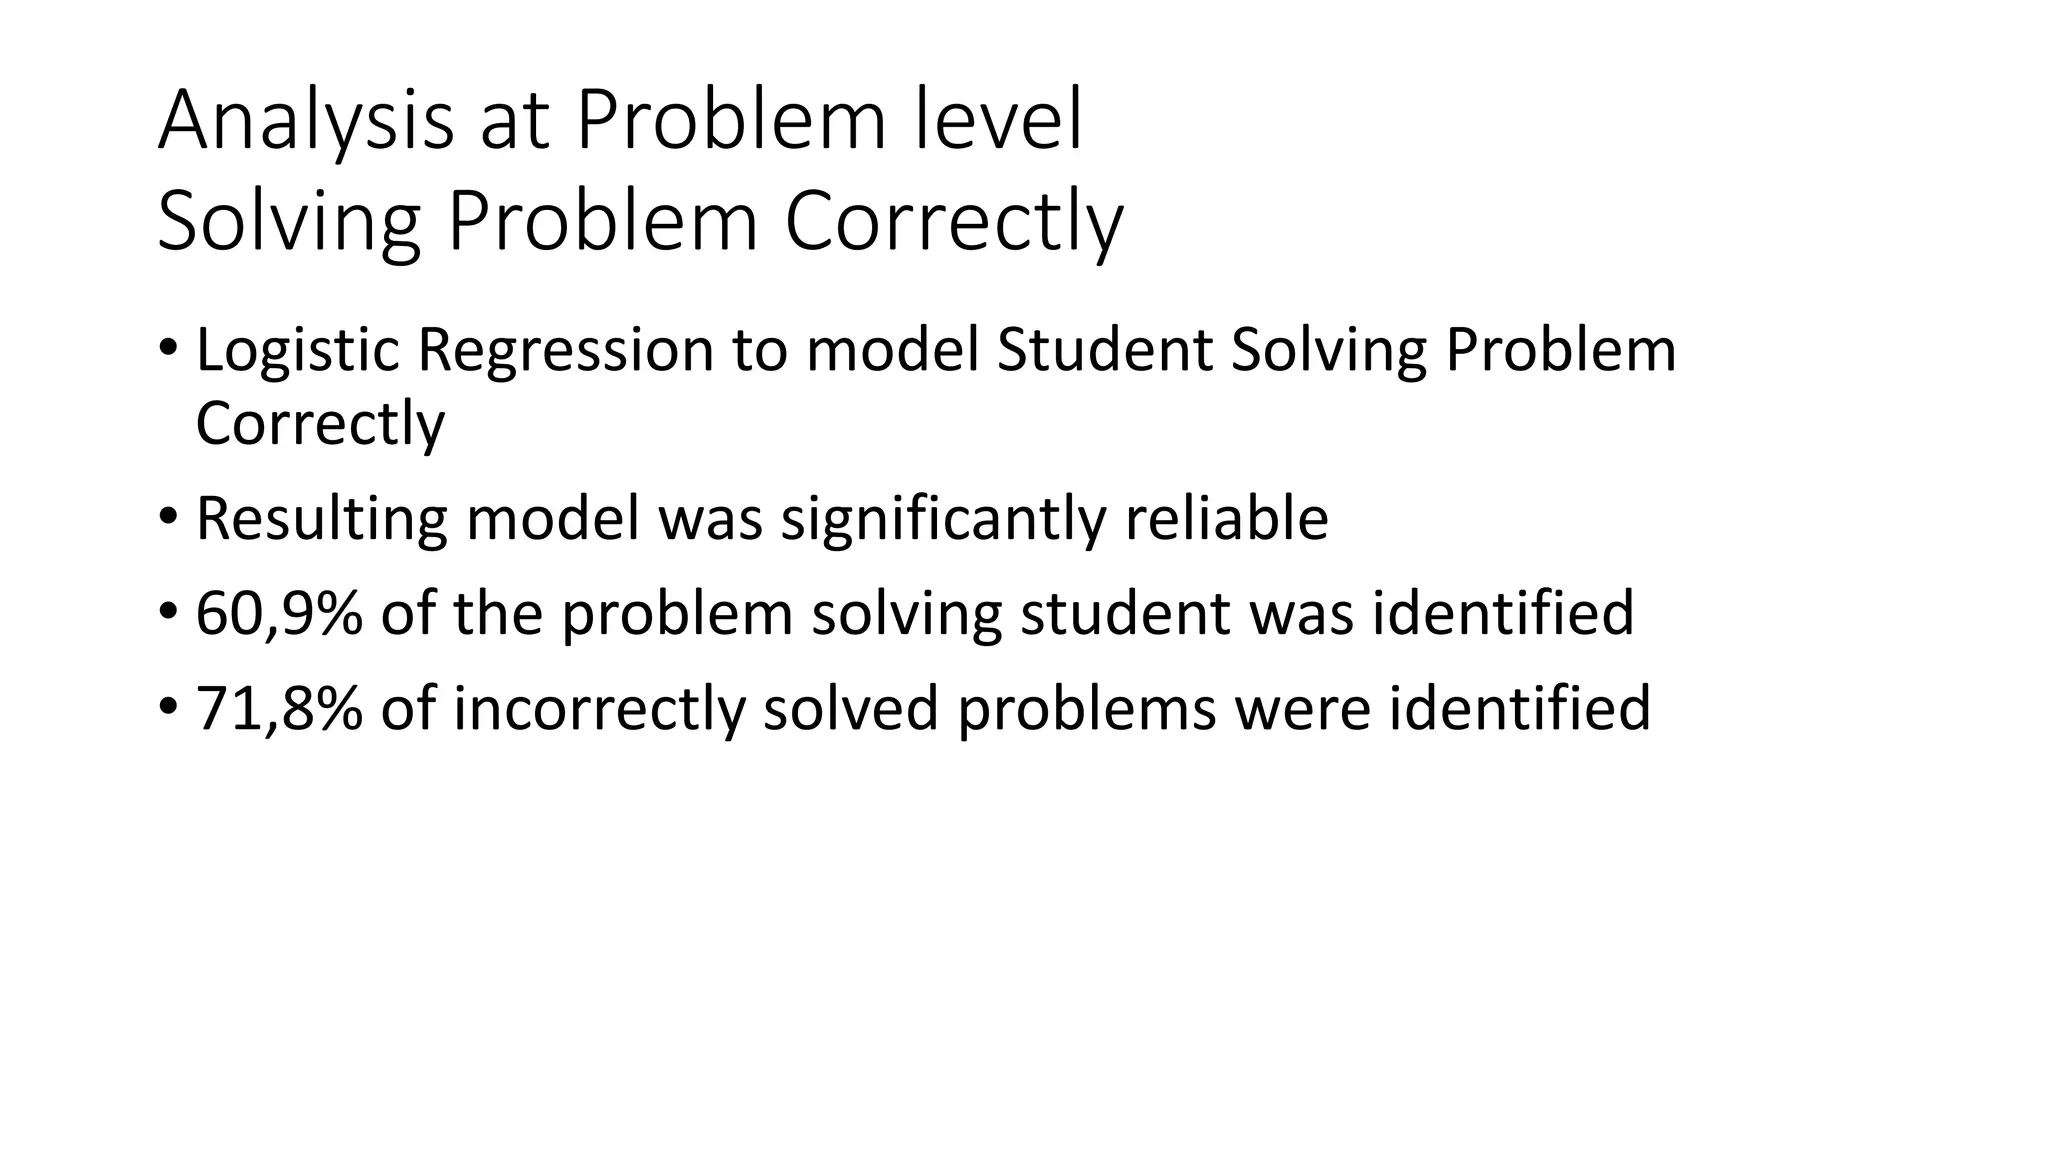
effi cient s of t he L ogist ic M odel Predict ing Odds for a St udent Solving Cor rect ly
Predictor Variable B W ald df p value exp(B )
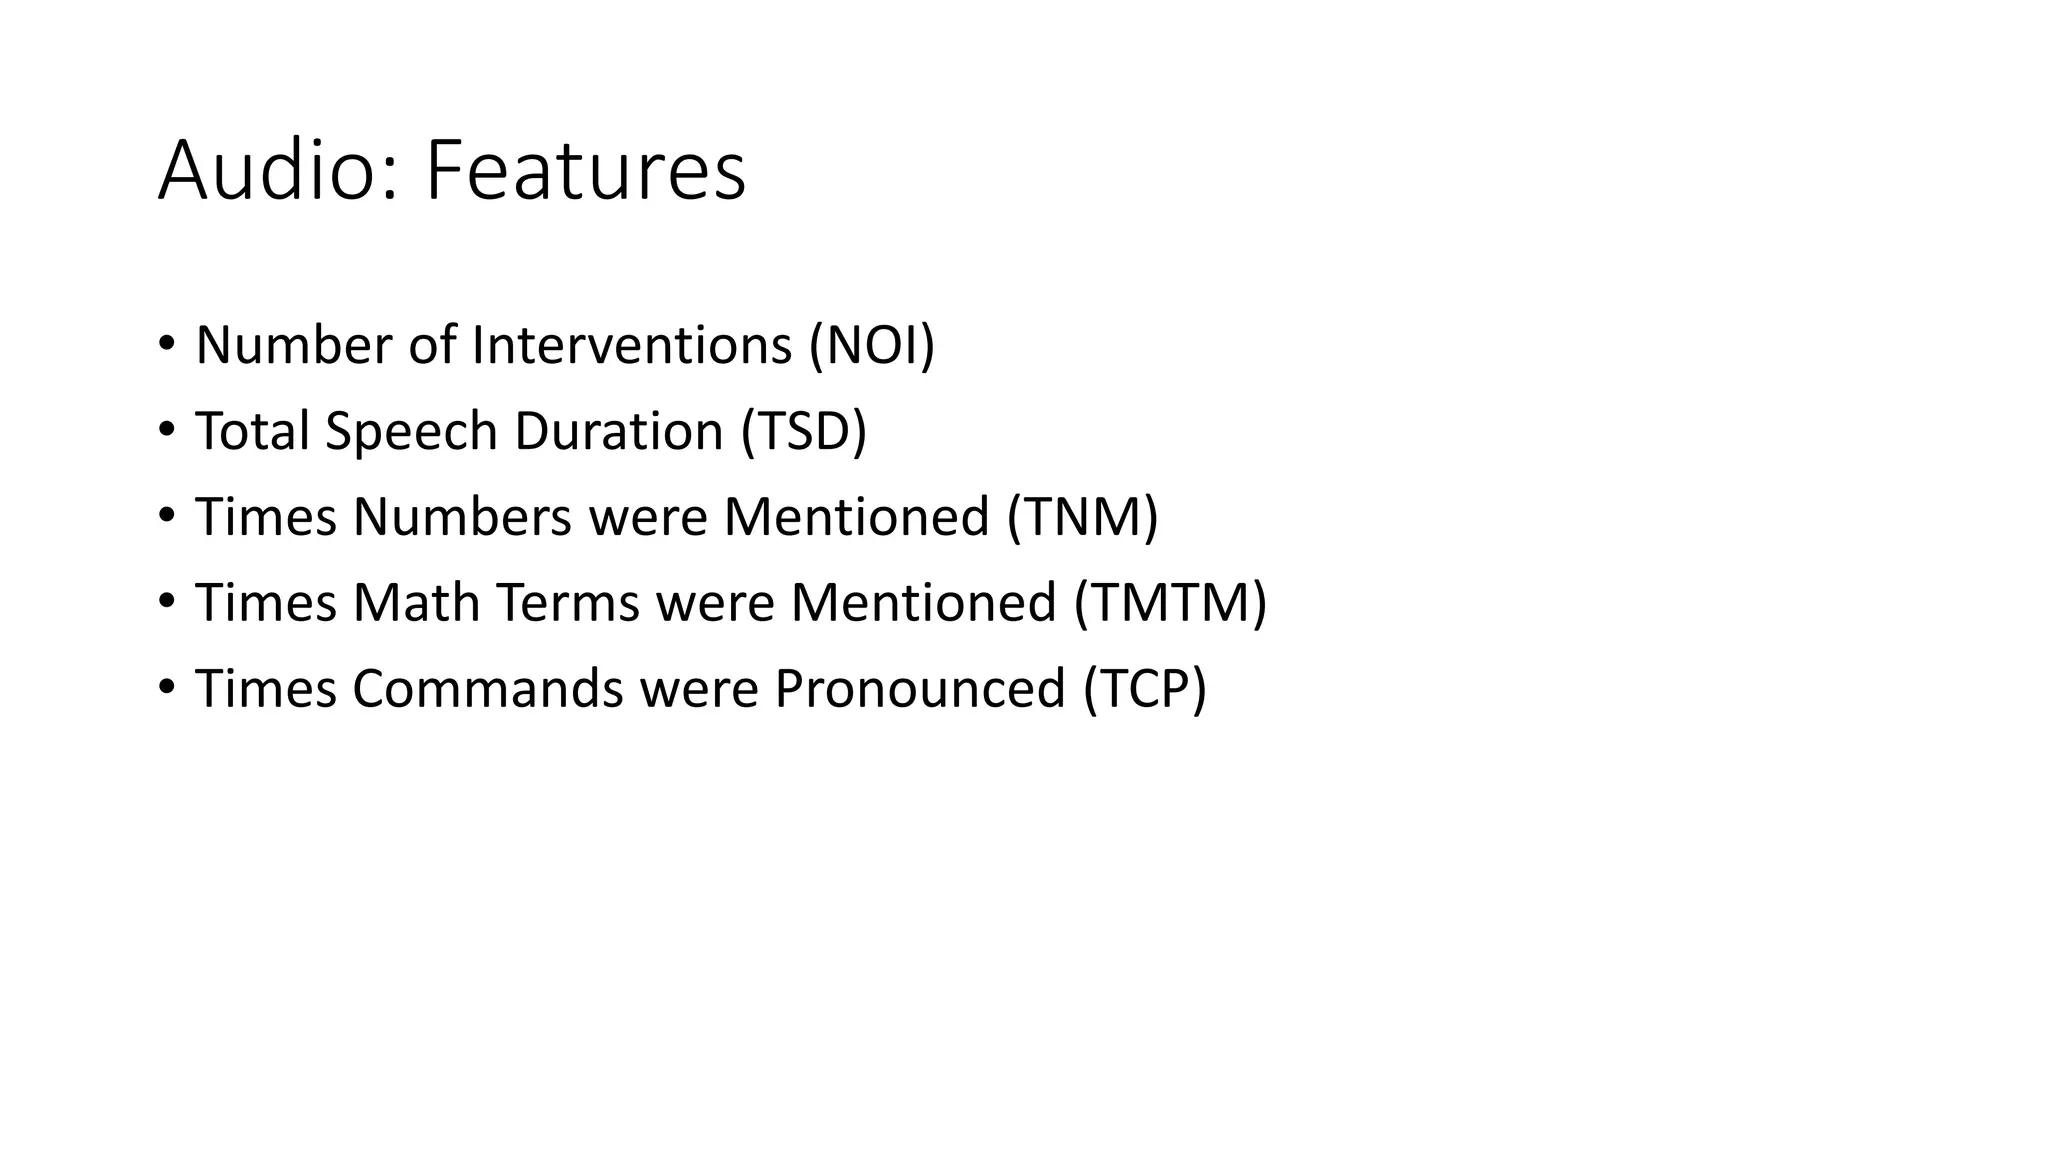
Number of Interventions (N OI ) 0.068 24.019 1 0.001 0.934
Times numbers were mentioned (TN M ) 0.175 23.816 1 0.001 1.192
Times commands were pronounced (TCP) 0.329 4.956 1 0.026 1.390
Proportion of Calculator Usage (PCU) 1.287 25.622 1 0.001 3.622
Fastest Student in the Group (F W ) 0.924 18.889 1 0.001 2.519
Constant 1.654 53.462 1 0.001 0.191
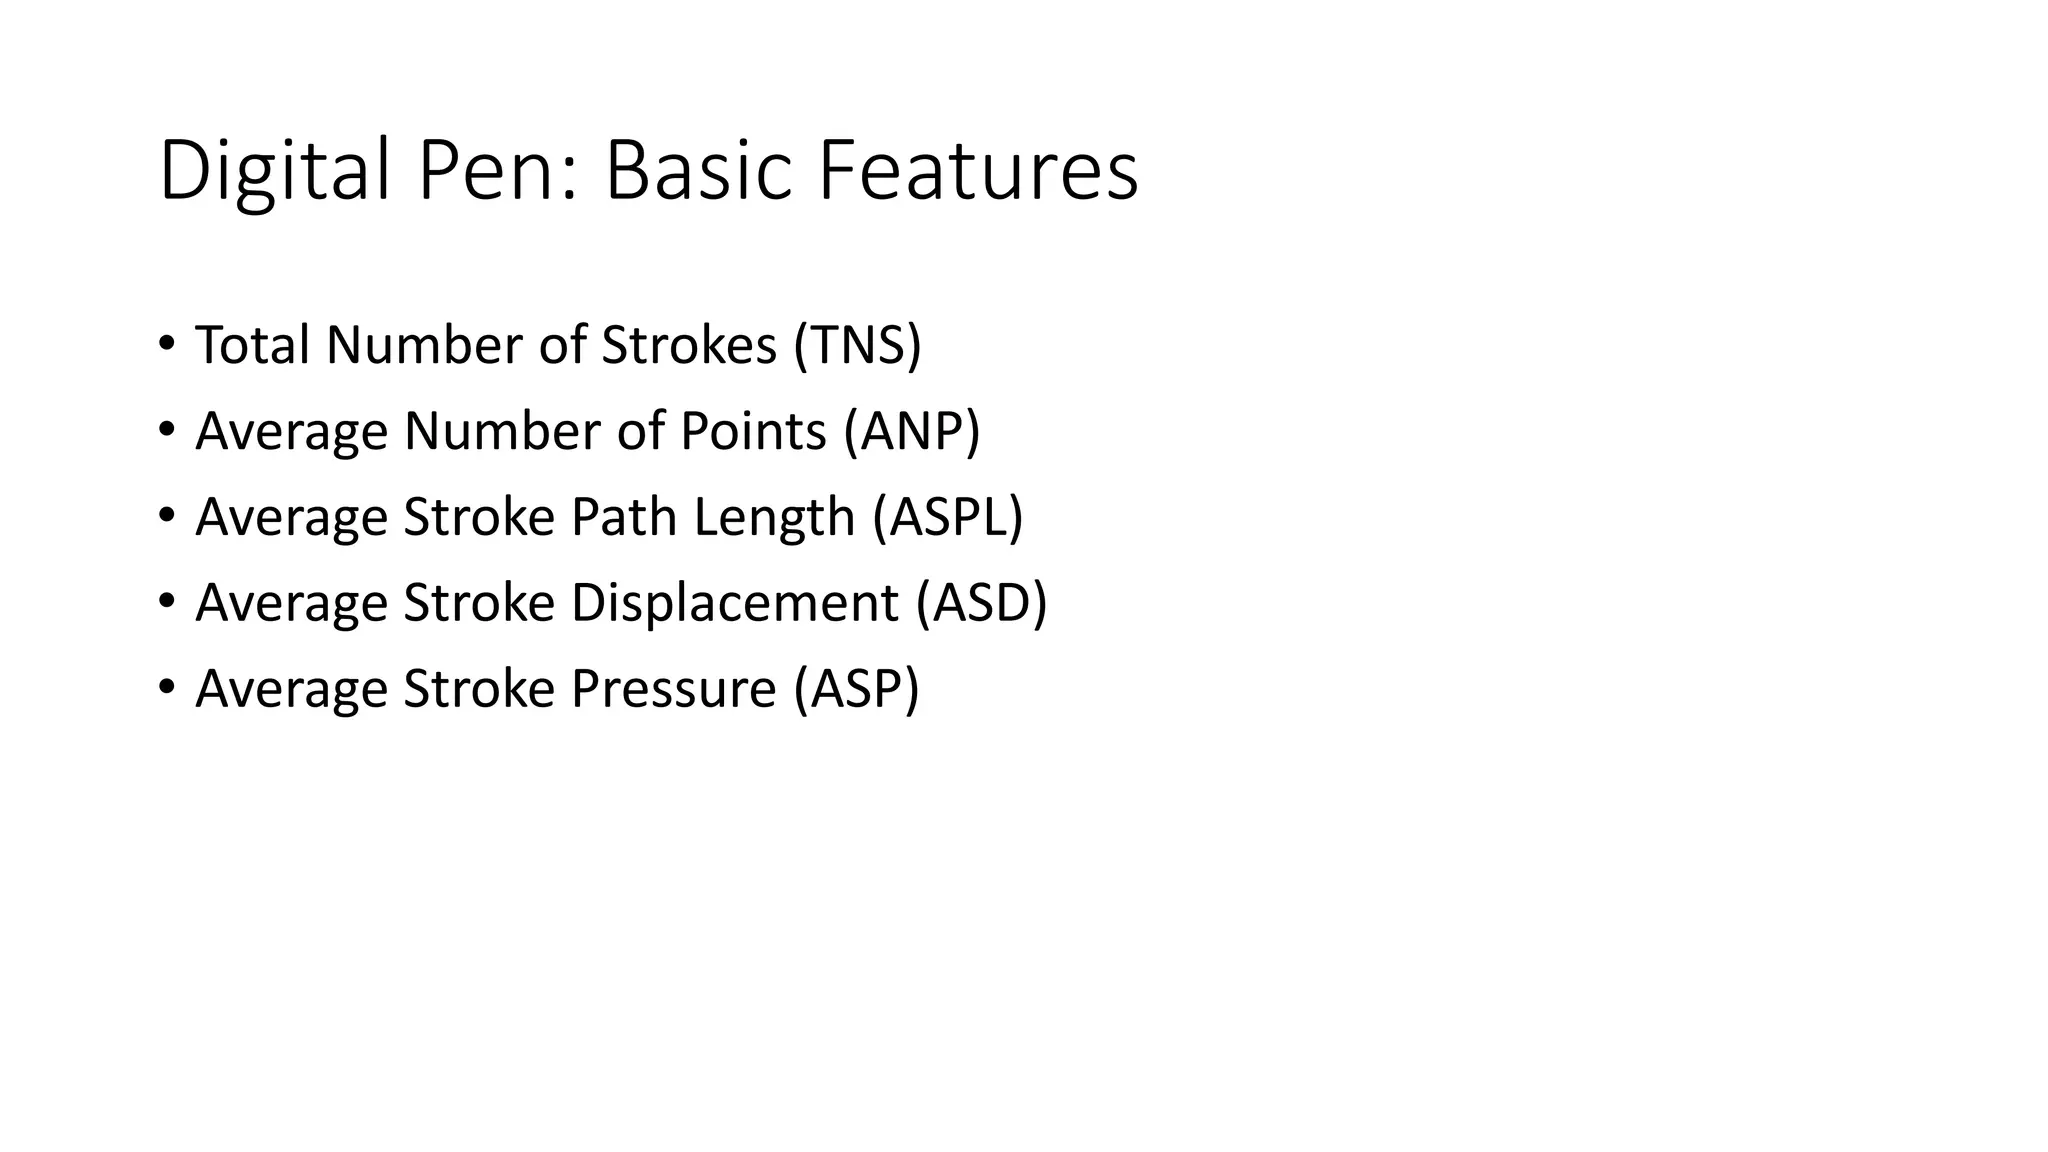
mber of Point s (AN P): Represents, in
mber of points that compose each stroke
sub-sets. Classification Trees, provided by
in the R statistical software [21] for Mac, w
second part of the analysis.](https://image.slidesharecdn.com/mla-150924064352-lva1-app6892/75/Multimodal-Learning-Analytics-57-2048.jpg)
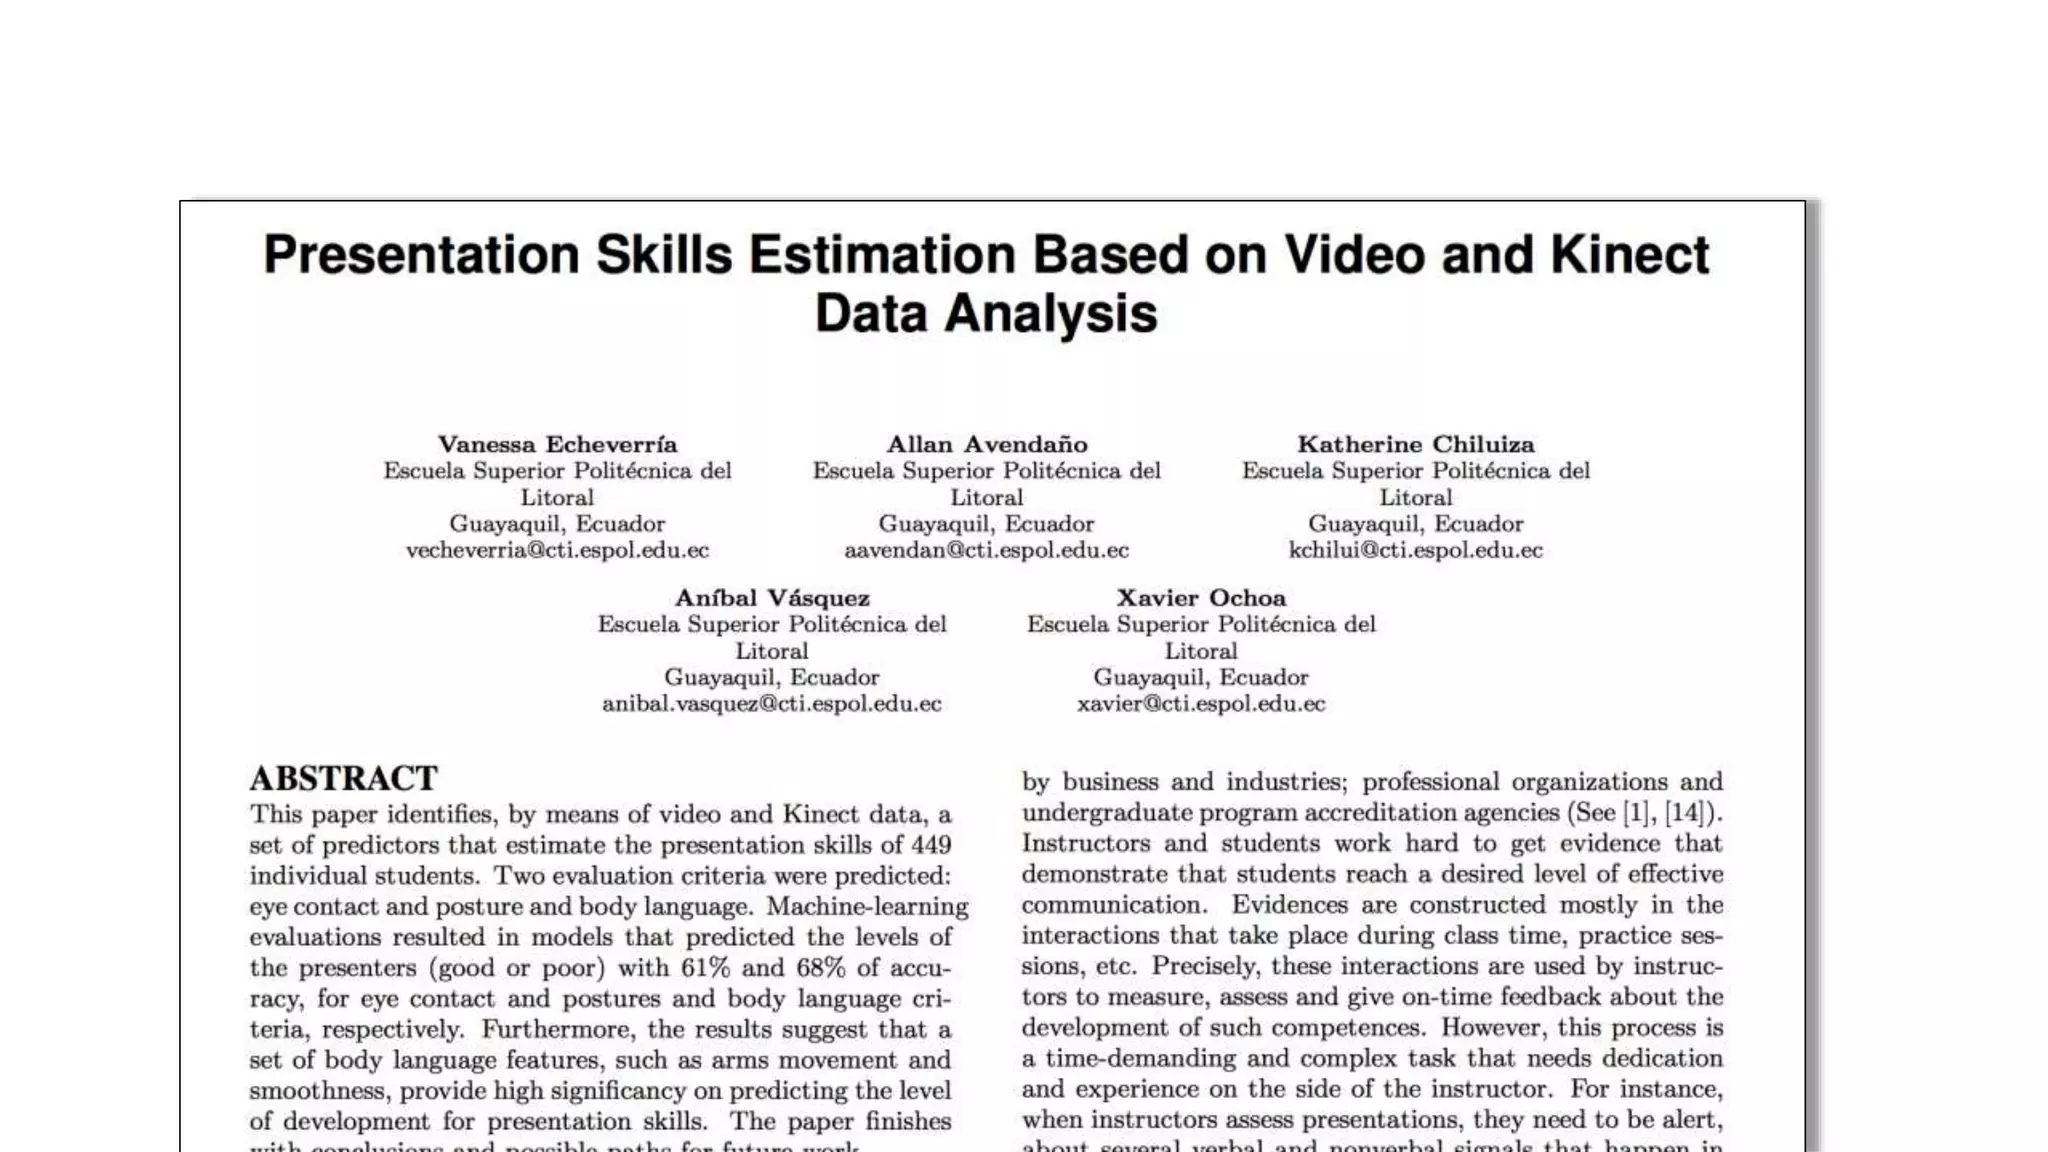
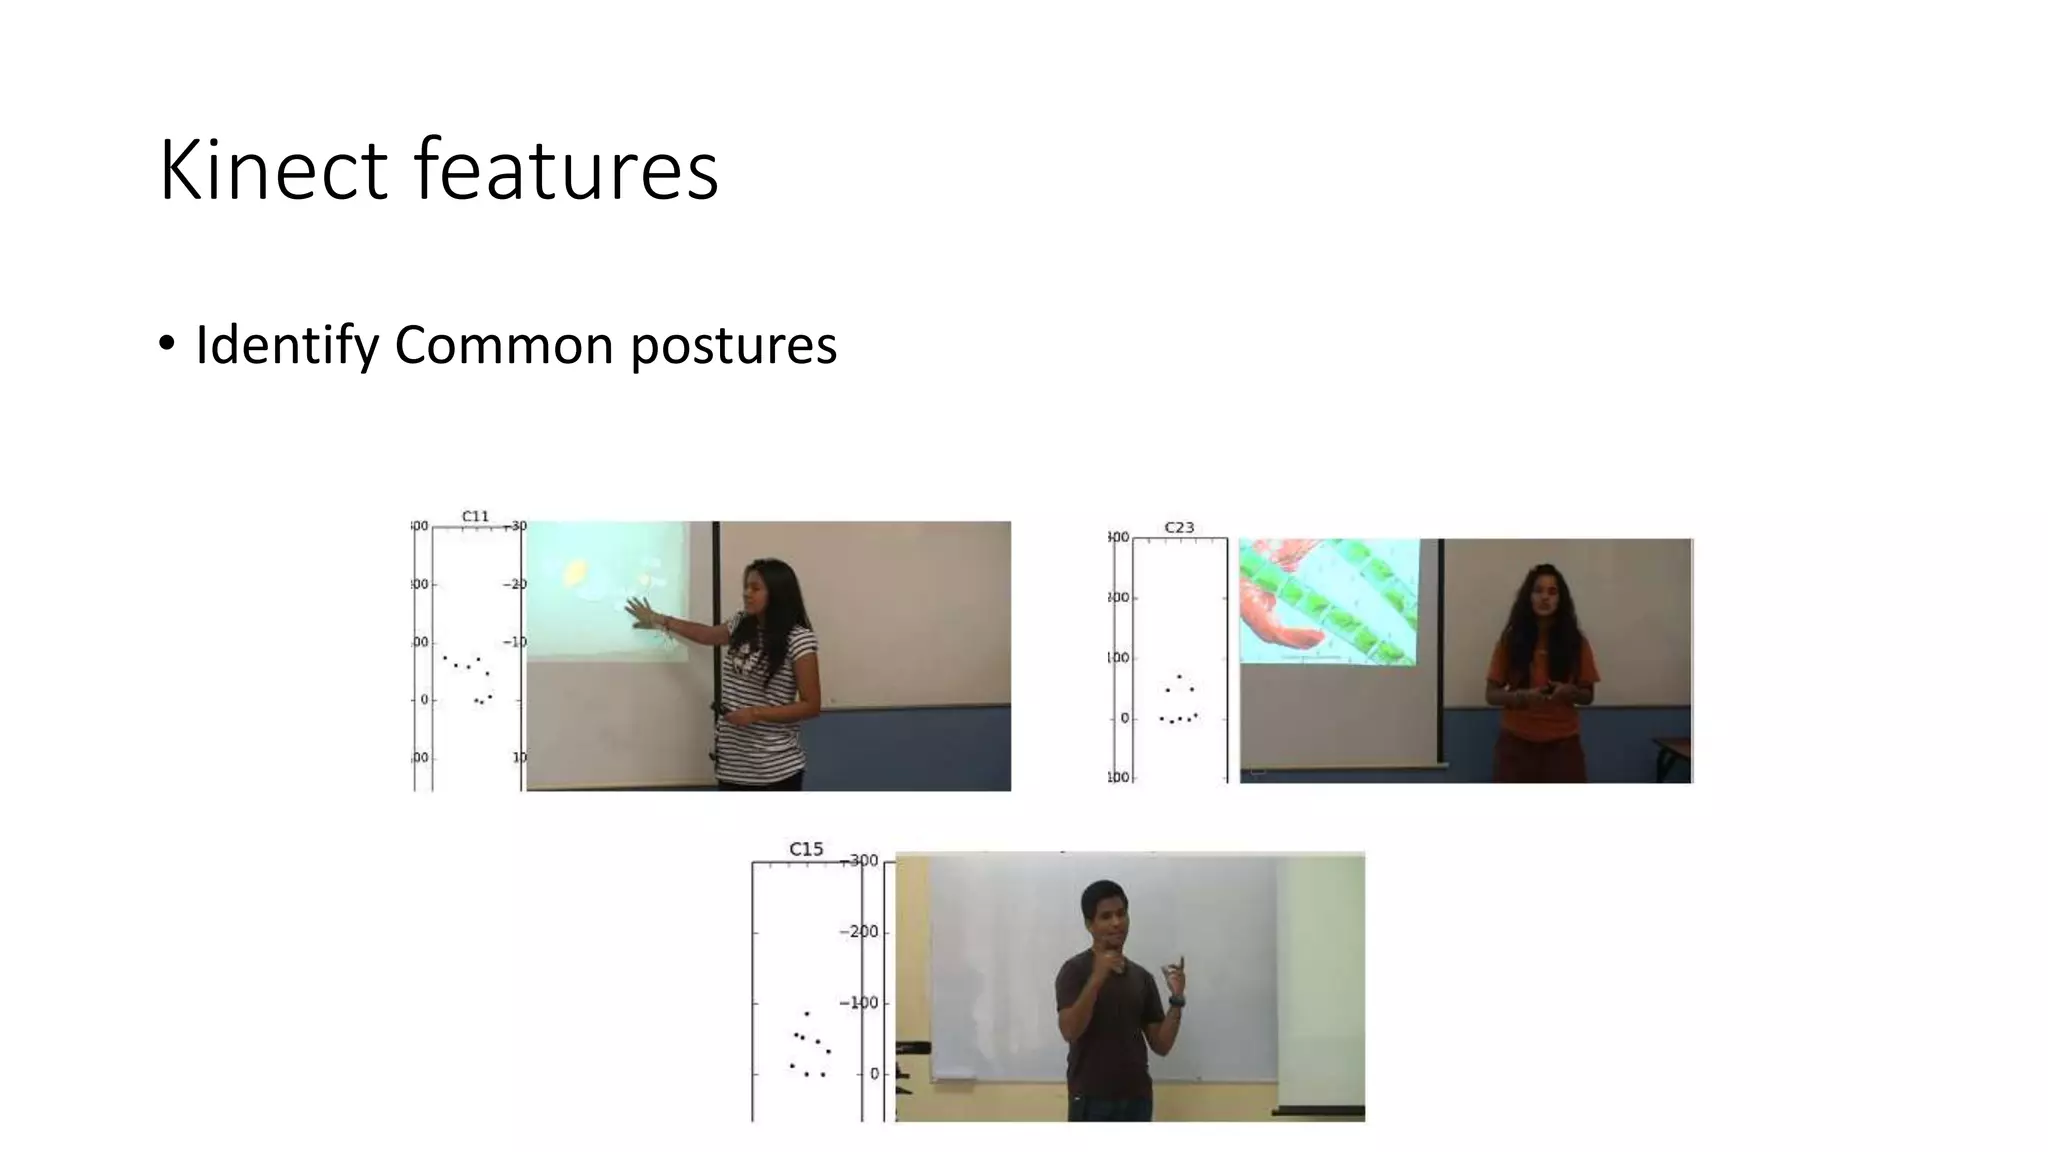


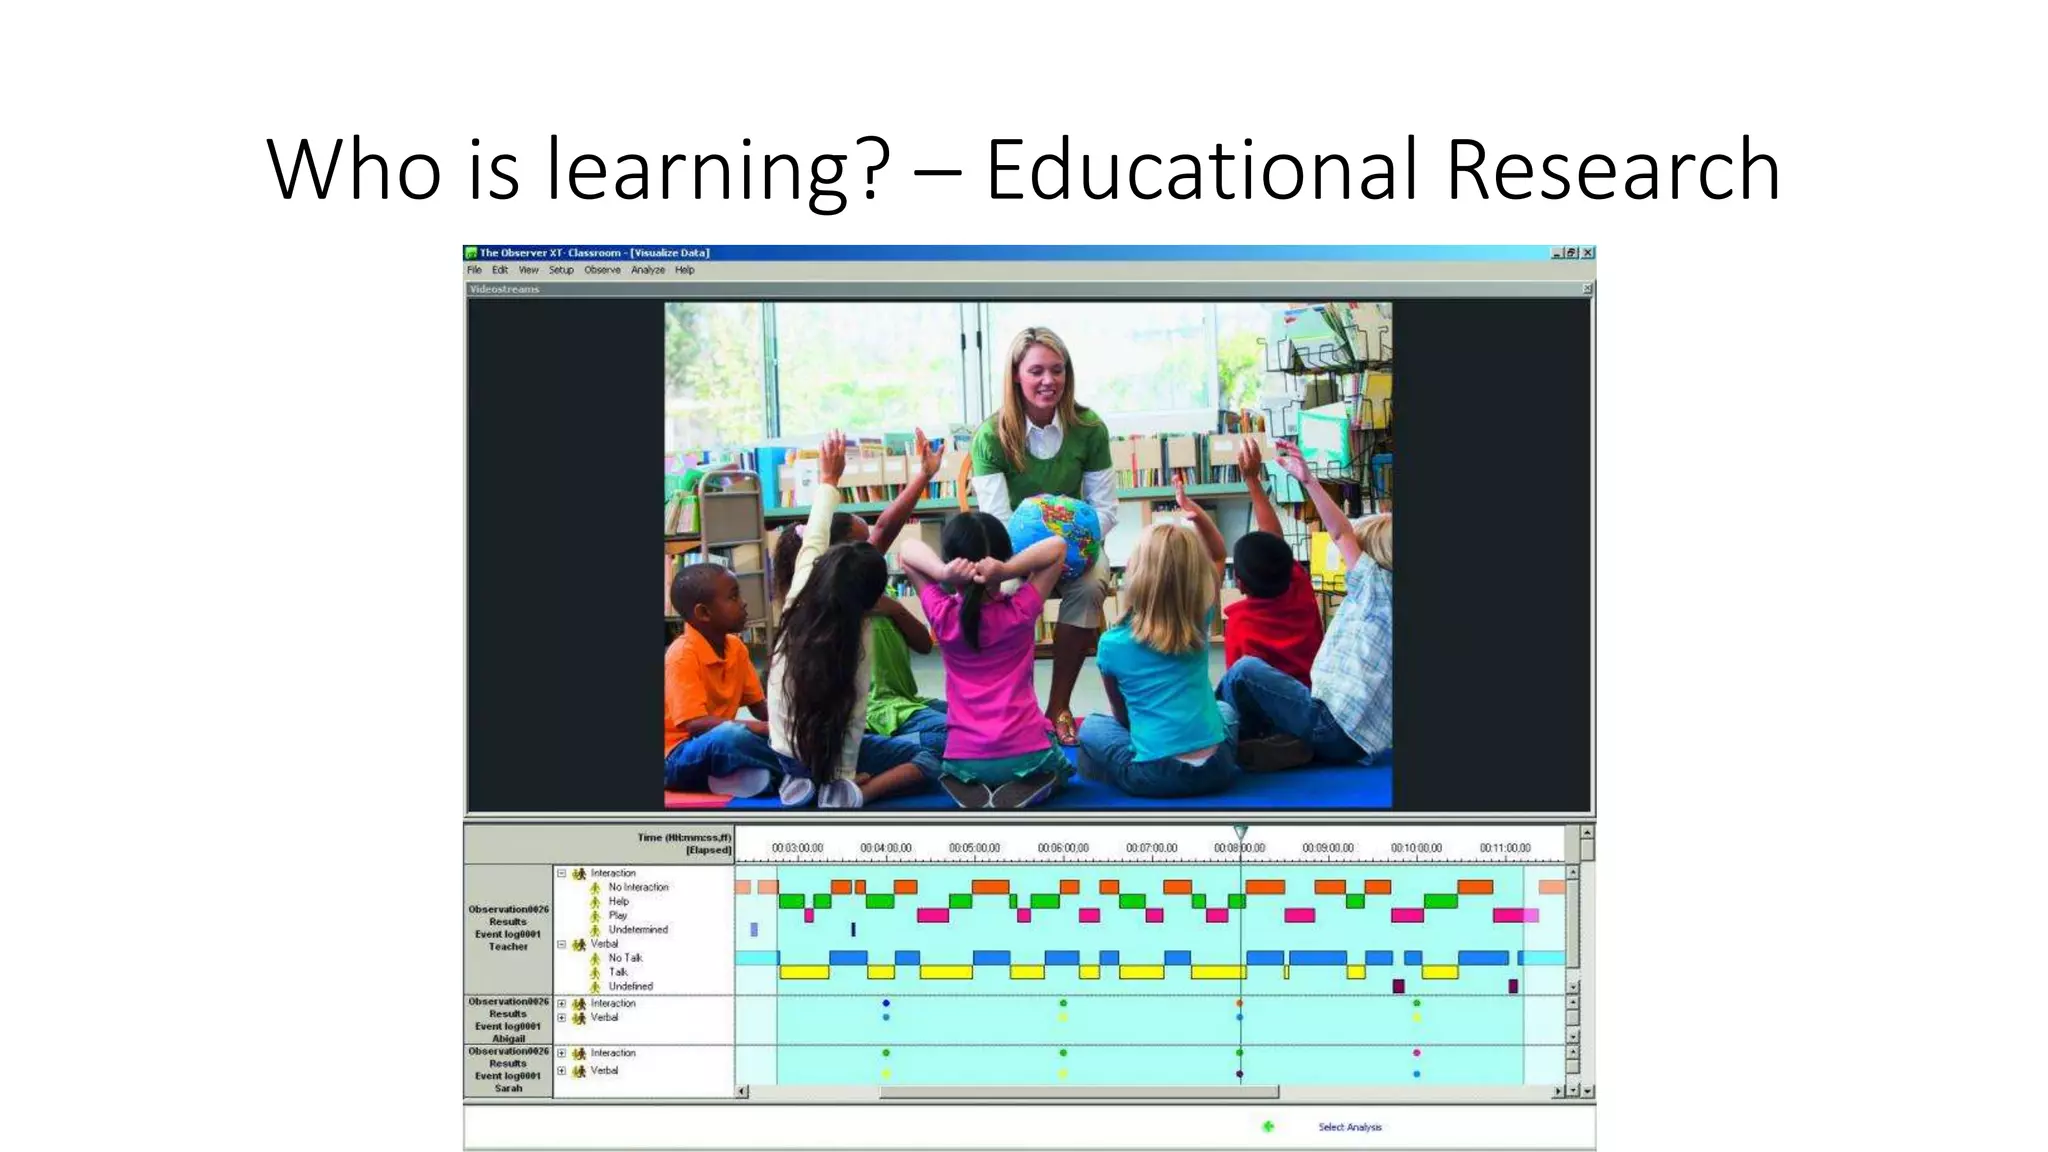
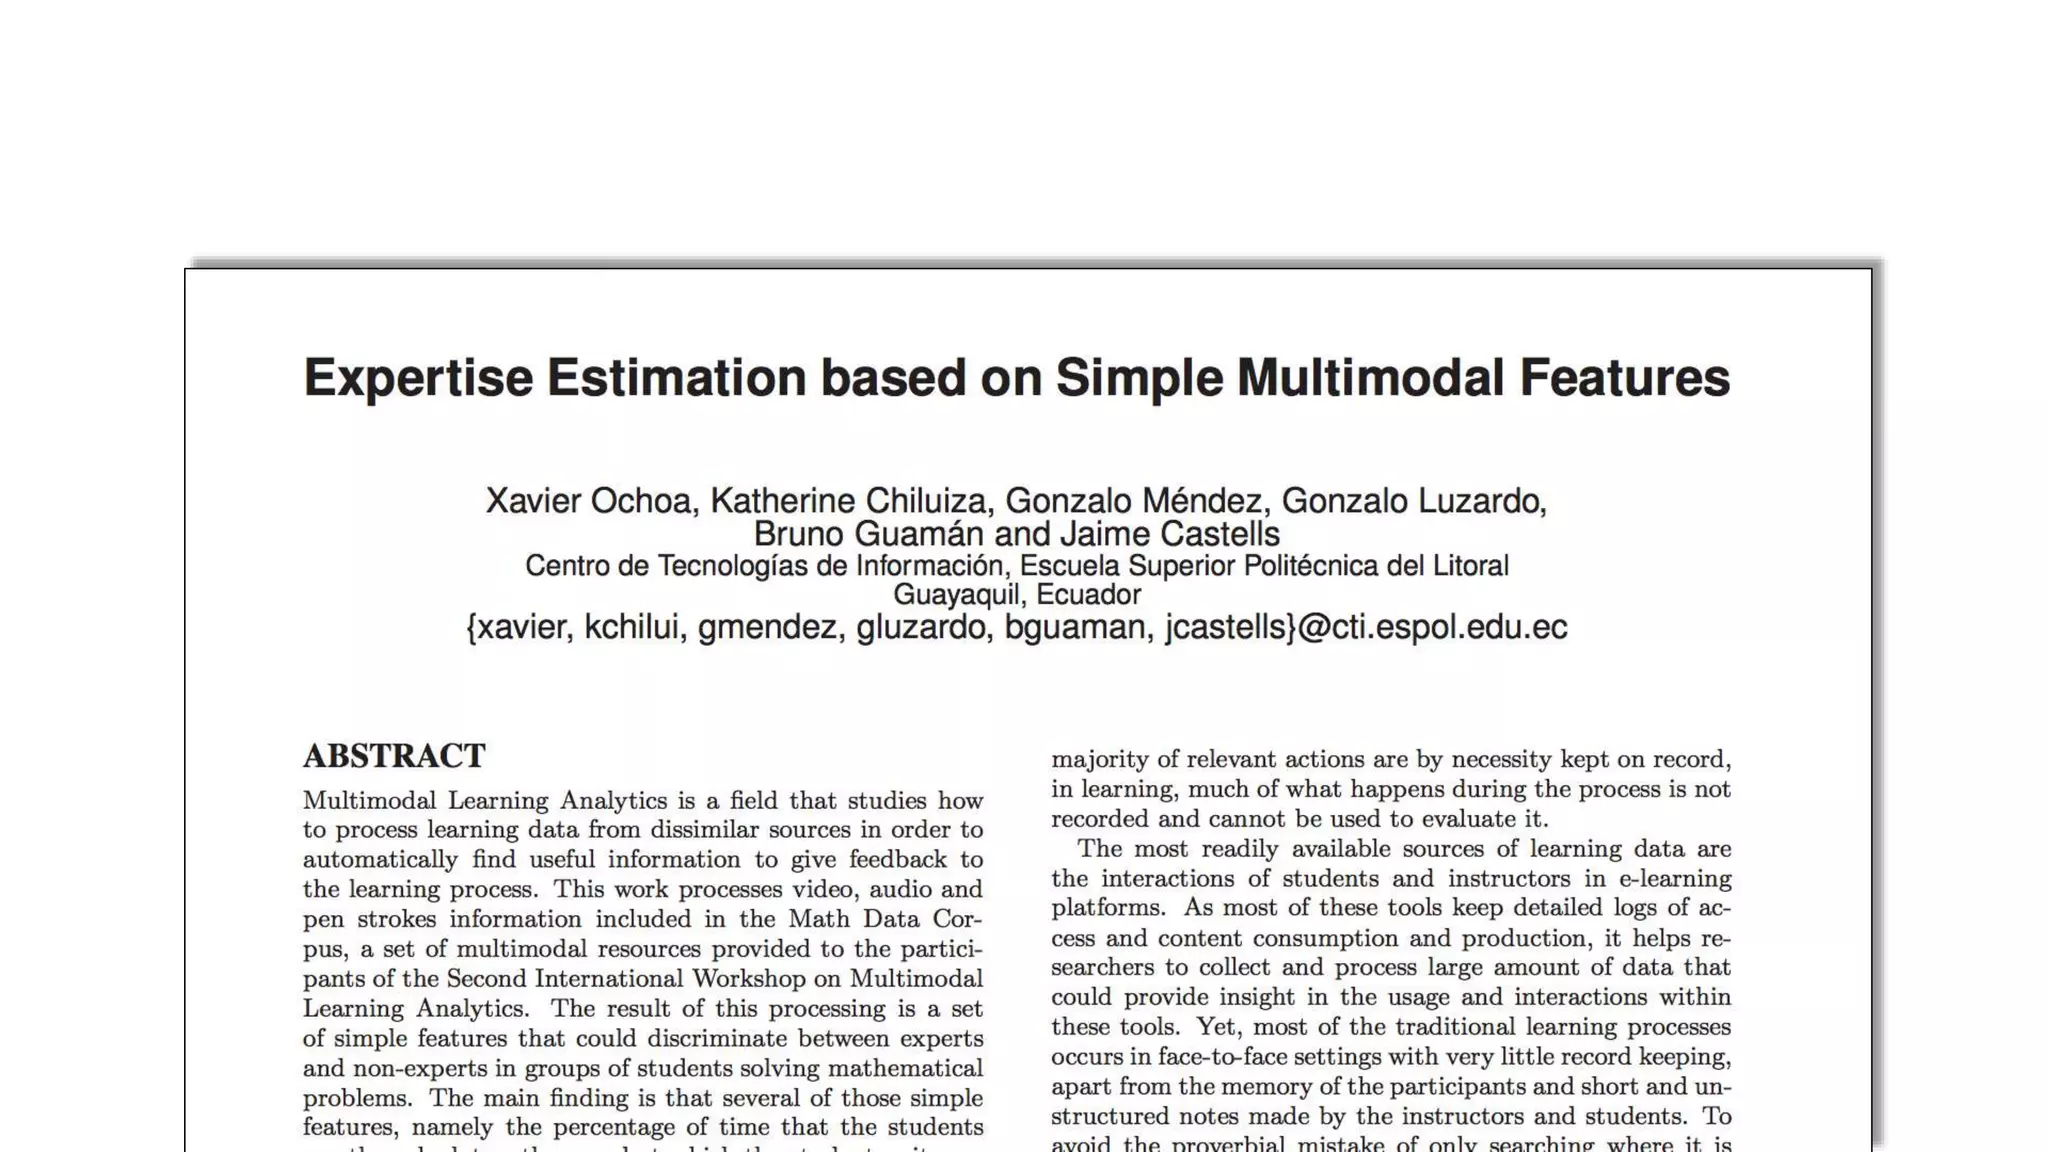
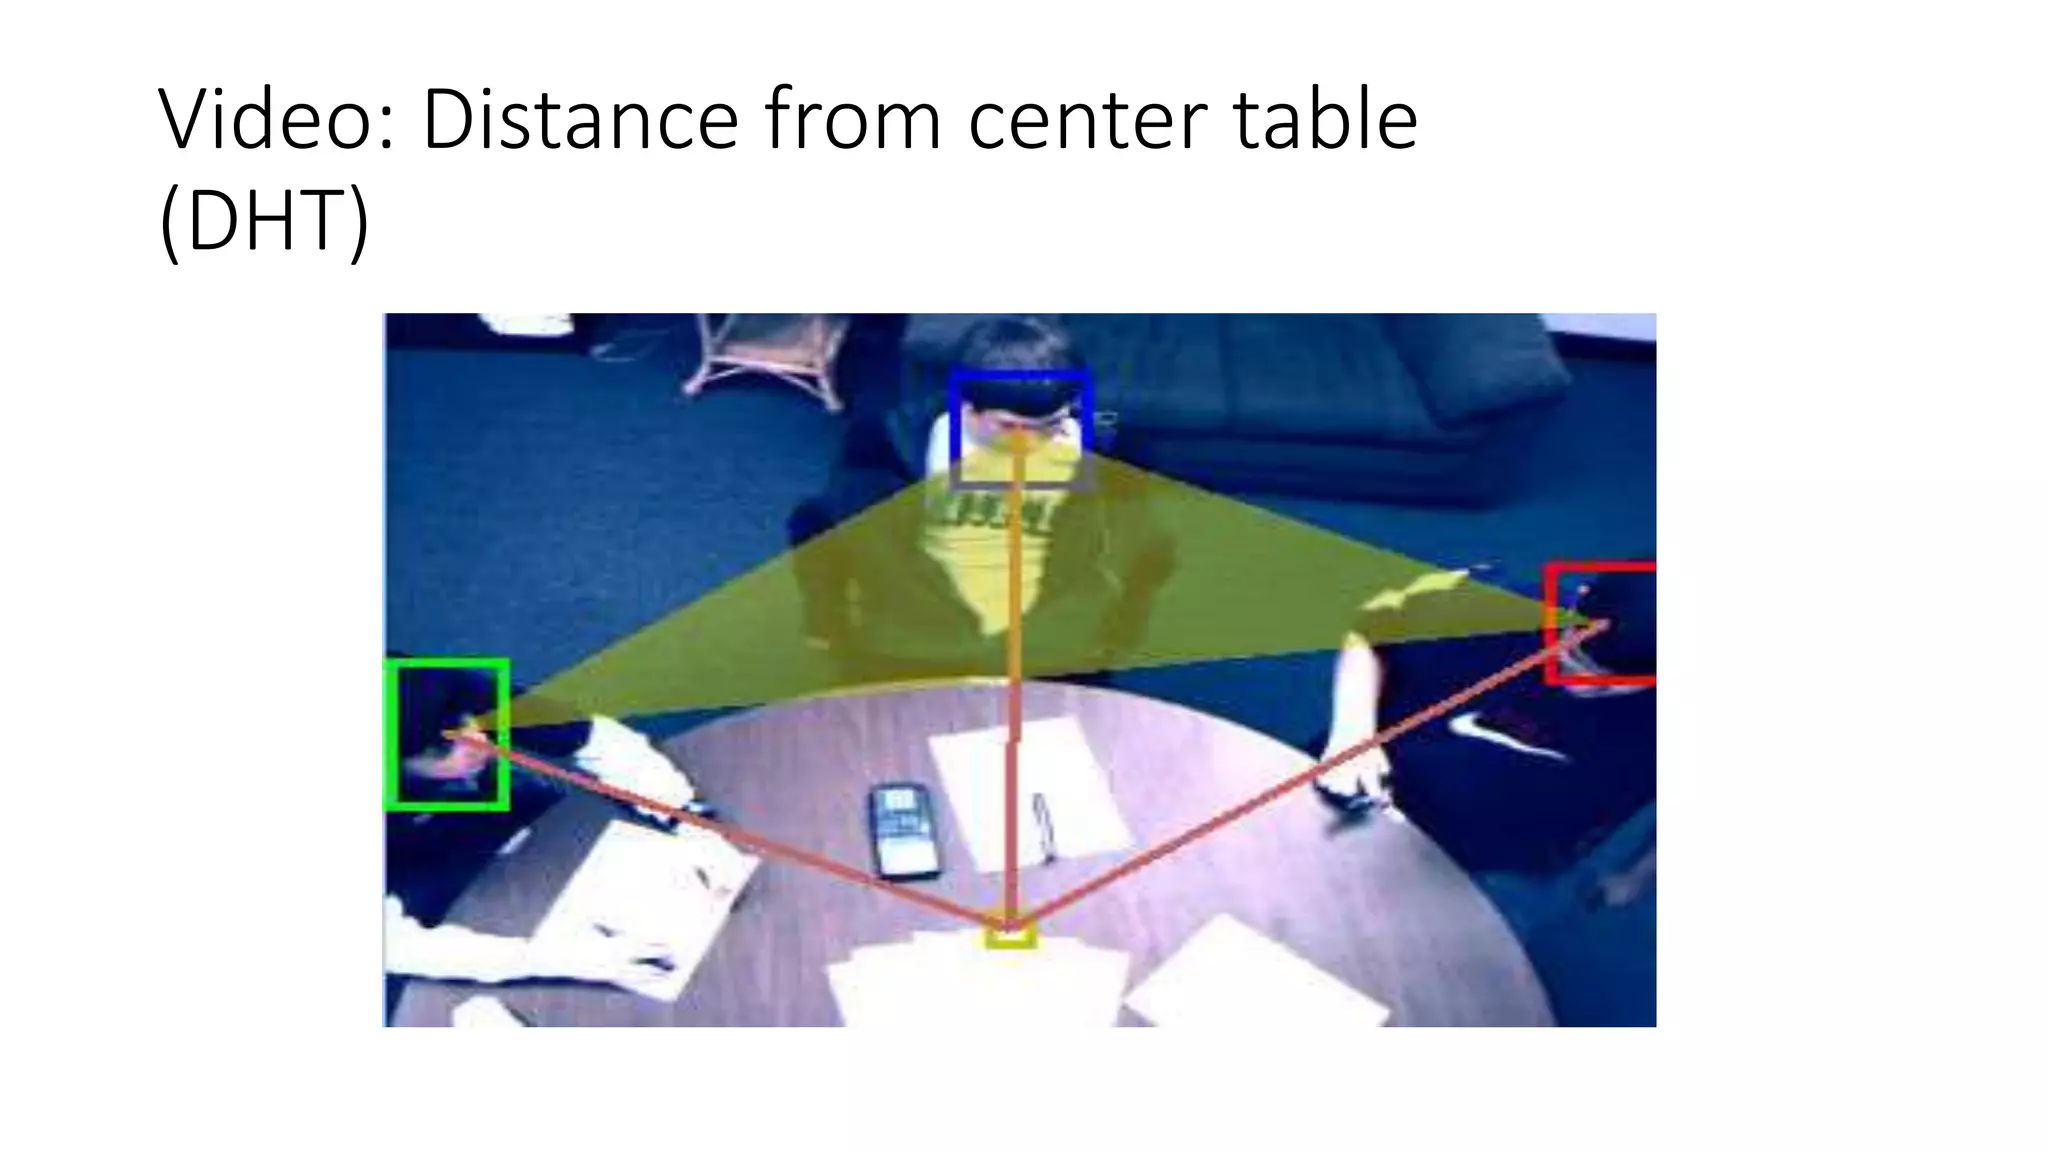
This document discusses multimodal learning analytics (MLA), which examines learning through multiple modalities like video, audio, digital pens, etc. It provides examples of extracting features from these modalities to analyze problem solving, expertise levels, and presentation quality. Key challenges of MLA are integrating different modalities and developing tools to capture real-world learning outside online systems. While current accuracy is limited, MLA is an emerging field that could provide insights beyond traditional learning analytics.


![[系列活動] Machine Learning 機器學習課程](https://cdn.slidesharecdn.com/ss_thumbnails/ml4ds02122017-170212005829-thumbnail.jpg?width=640&height=640&fit=bounds)


![[DSC Europe 25] Nikola Rajovic - Hardware Technologies Under the Hood: RISC-V...](https://cdn.slidesharecdn.com/ss_thumbnails/o2gptrmtoyqndgoshwgq-dsc2025-tenstorrent-rajovic-251205090438-814685f5-thumbnail.jpg?width=640&height=640&fit=bounds)


![[DSC Europe 25] Bogdan Daniel Maruneac - AI - It starts with you.pptx](https://cdn.slidesharecdn.com/ss_thumbnails/odov3snhrcqs9hx5ny2n-4-251205085715-f1daacfe-thumbnail.jpg?width=640&height=640&fit=bounds)

![[DSC Europe 25] Max Talanov - Non digital NNs.pptx](https://cdn.slidesharecdn.com/ss_thumbnails/wif8tr3gtua74qvtopke-non-digital-nns-251205090438-26b0eea6-thumbnail.jpg?width=640&height=640&fit=bounds)

![[DSC Europe 25] Andy Cotgreave - Nothing is new in analytics.pptx](https://cdn.slidesharecdn.com/ss_thumbnails/mba4vzcurvoh5lfrd5zw-6-251205194645-341bbbbe-thumbnail.jpg?width=640&height=640&fit=bounds)


![[DSC Europe 25] Goran Obradovic - The Rise of Sovereign AI: Building the Regi...](https://cdn.slidesharecdn.com/ss_thumbnails/7nw2xxixrxqdxvrb5wca-6-251205085714-ab09a2ac-thumbnail.jpg?width=640&height=640&fit=bounds)


