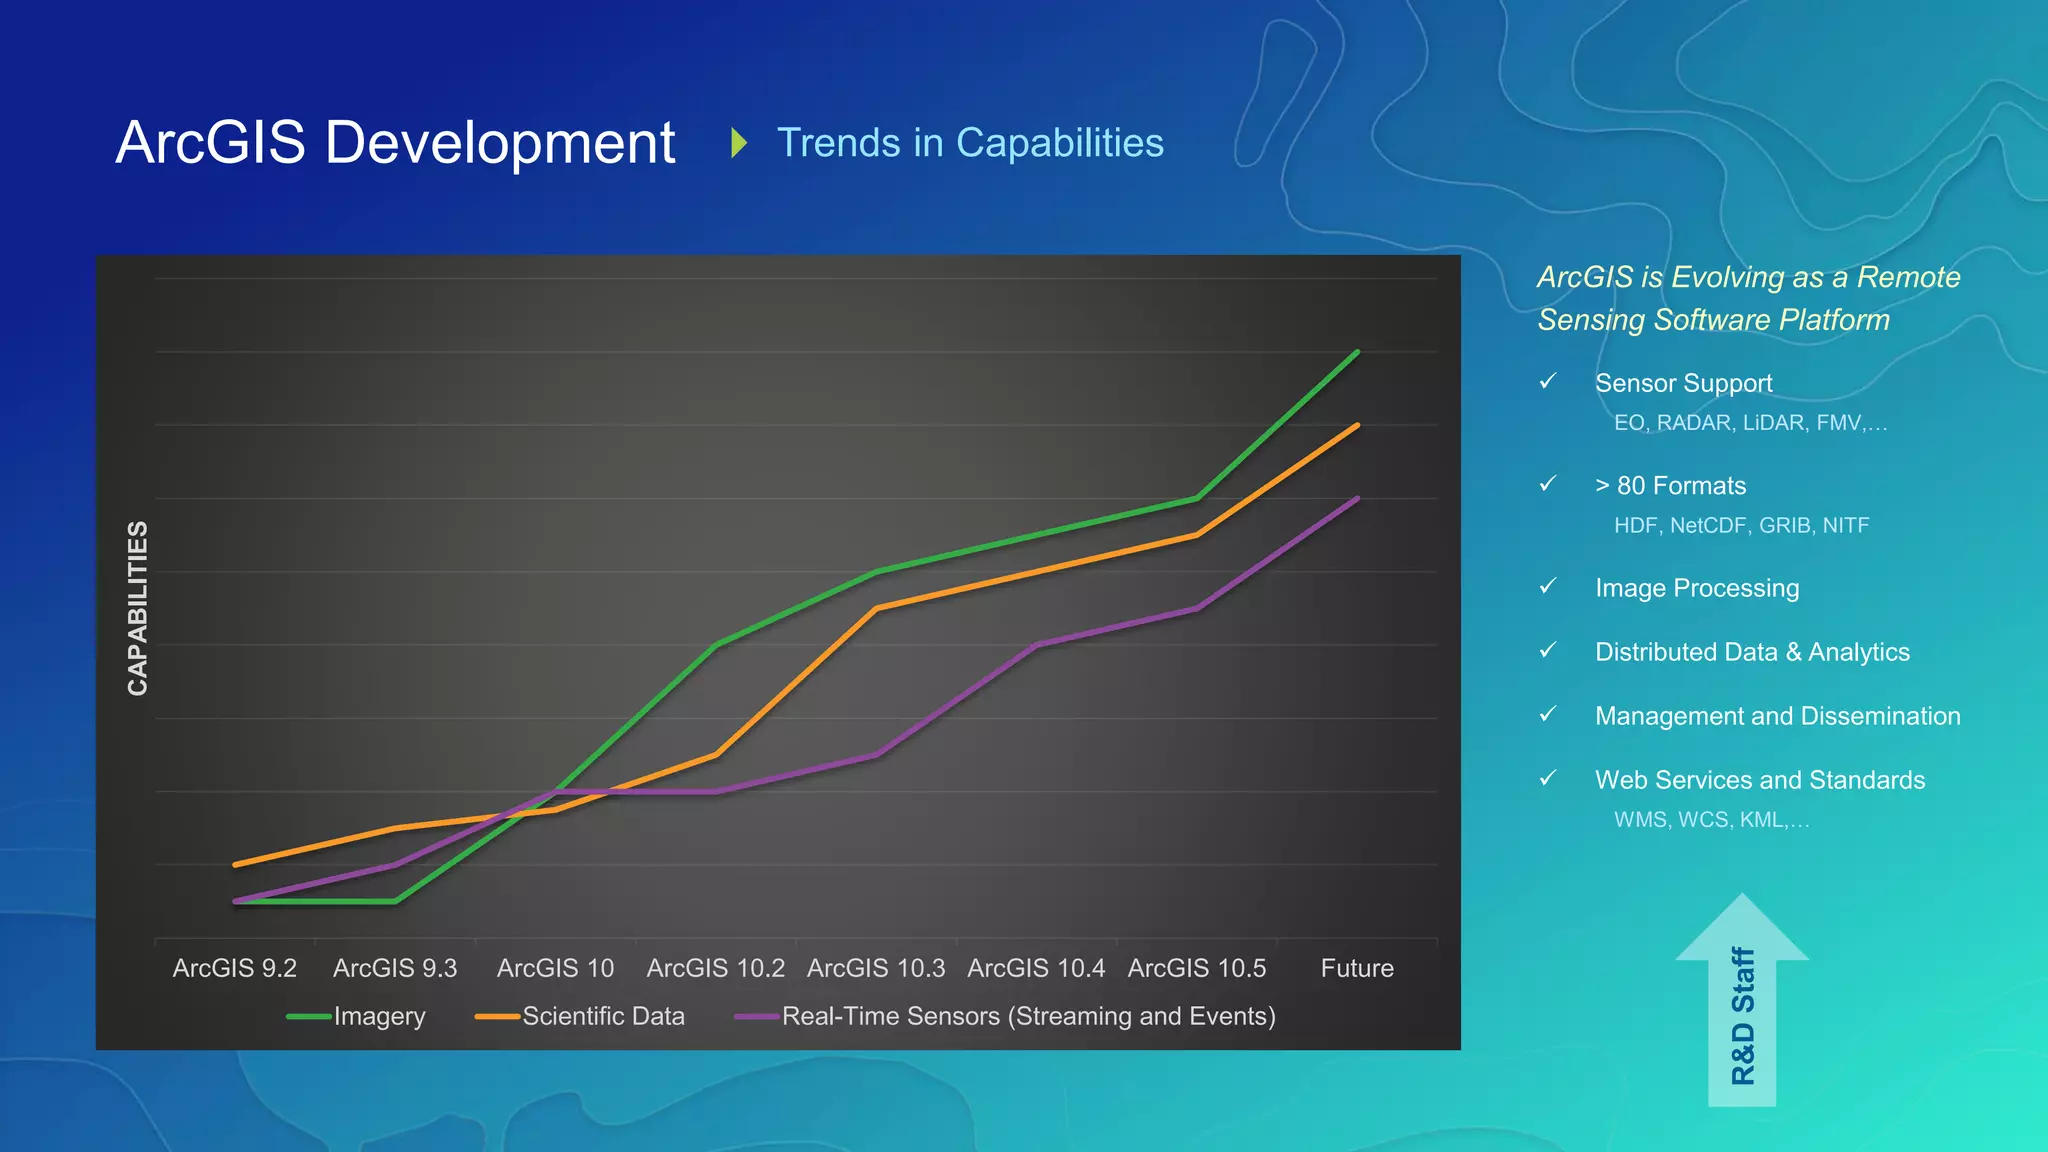
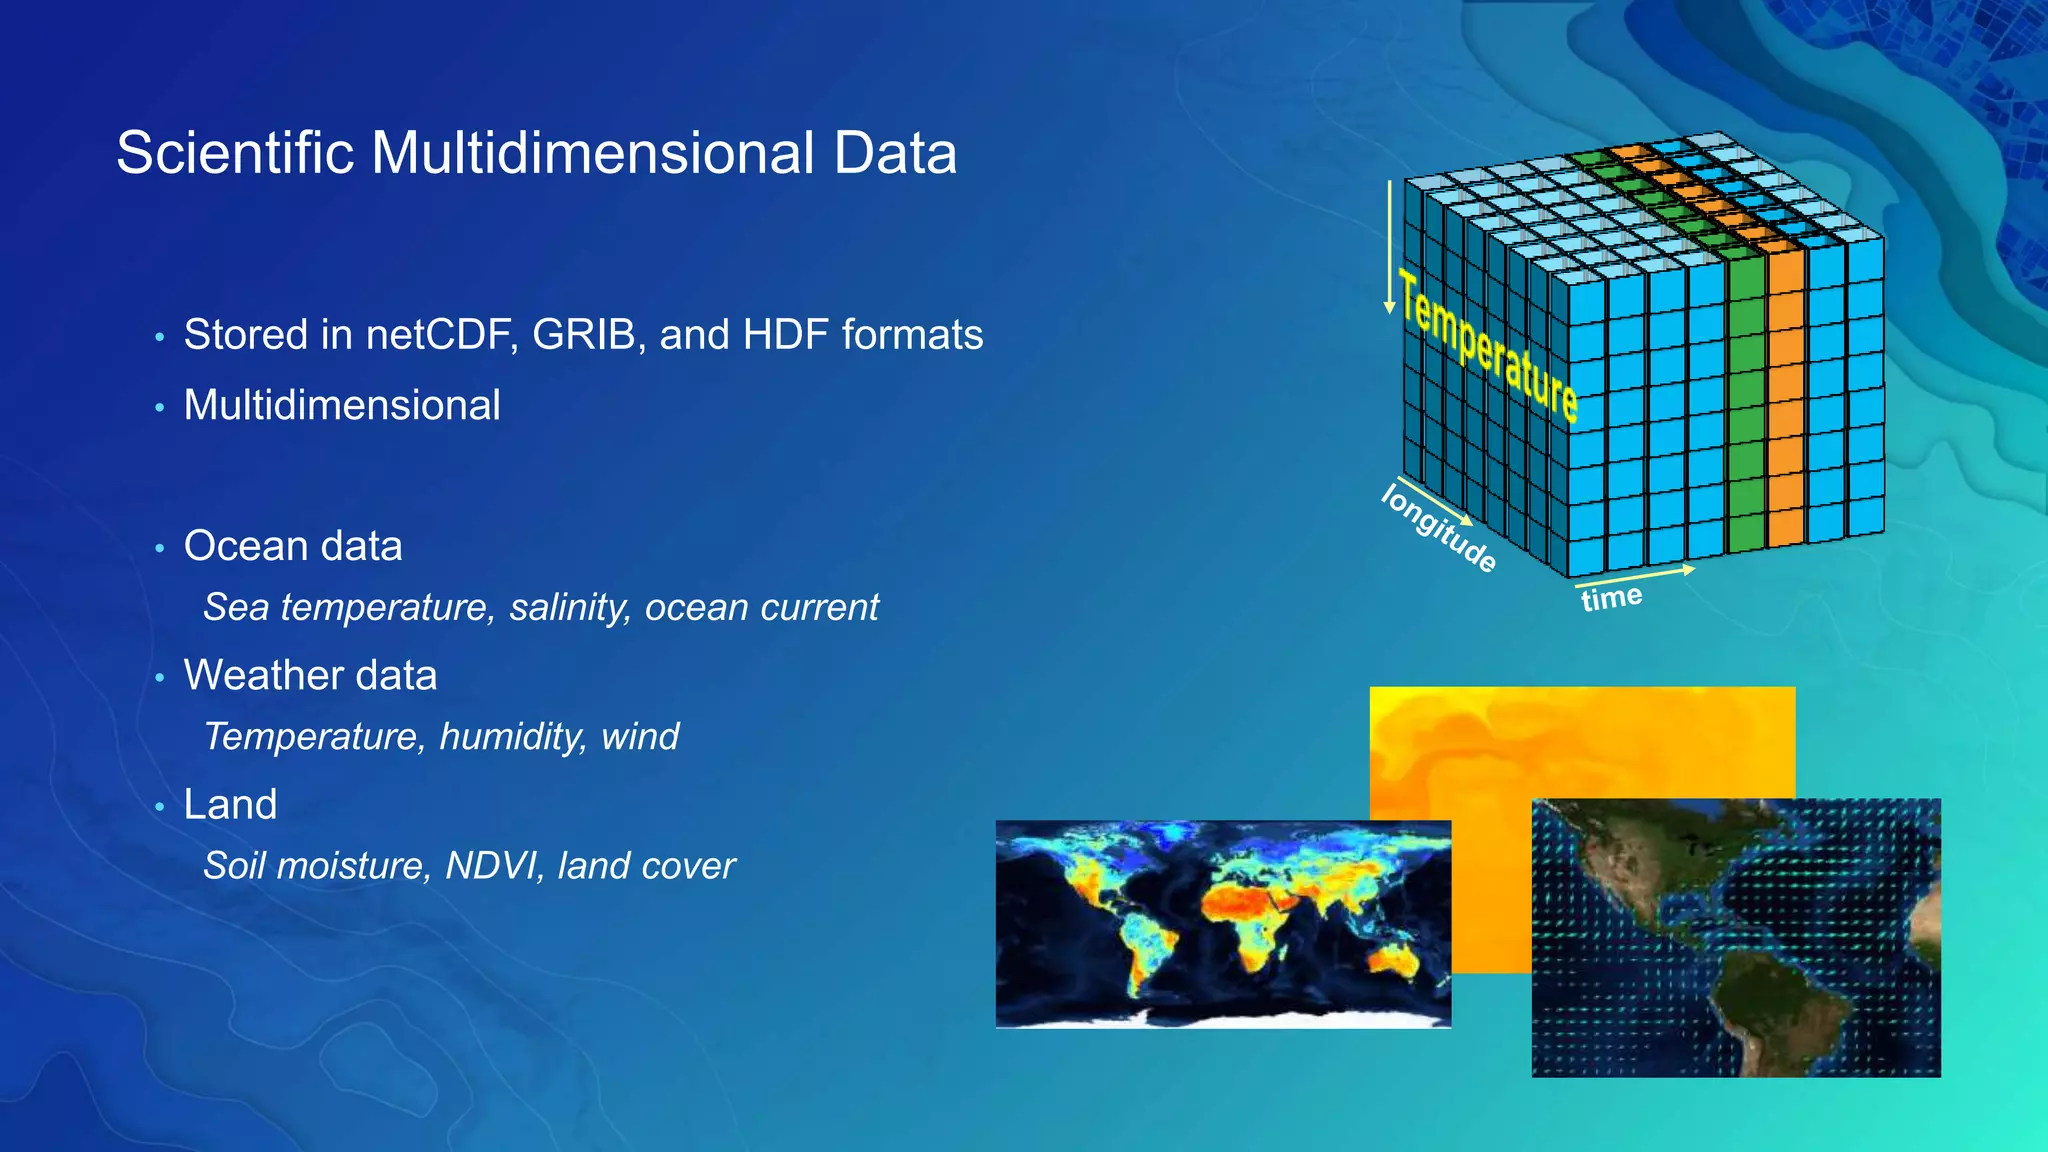
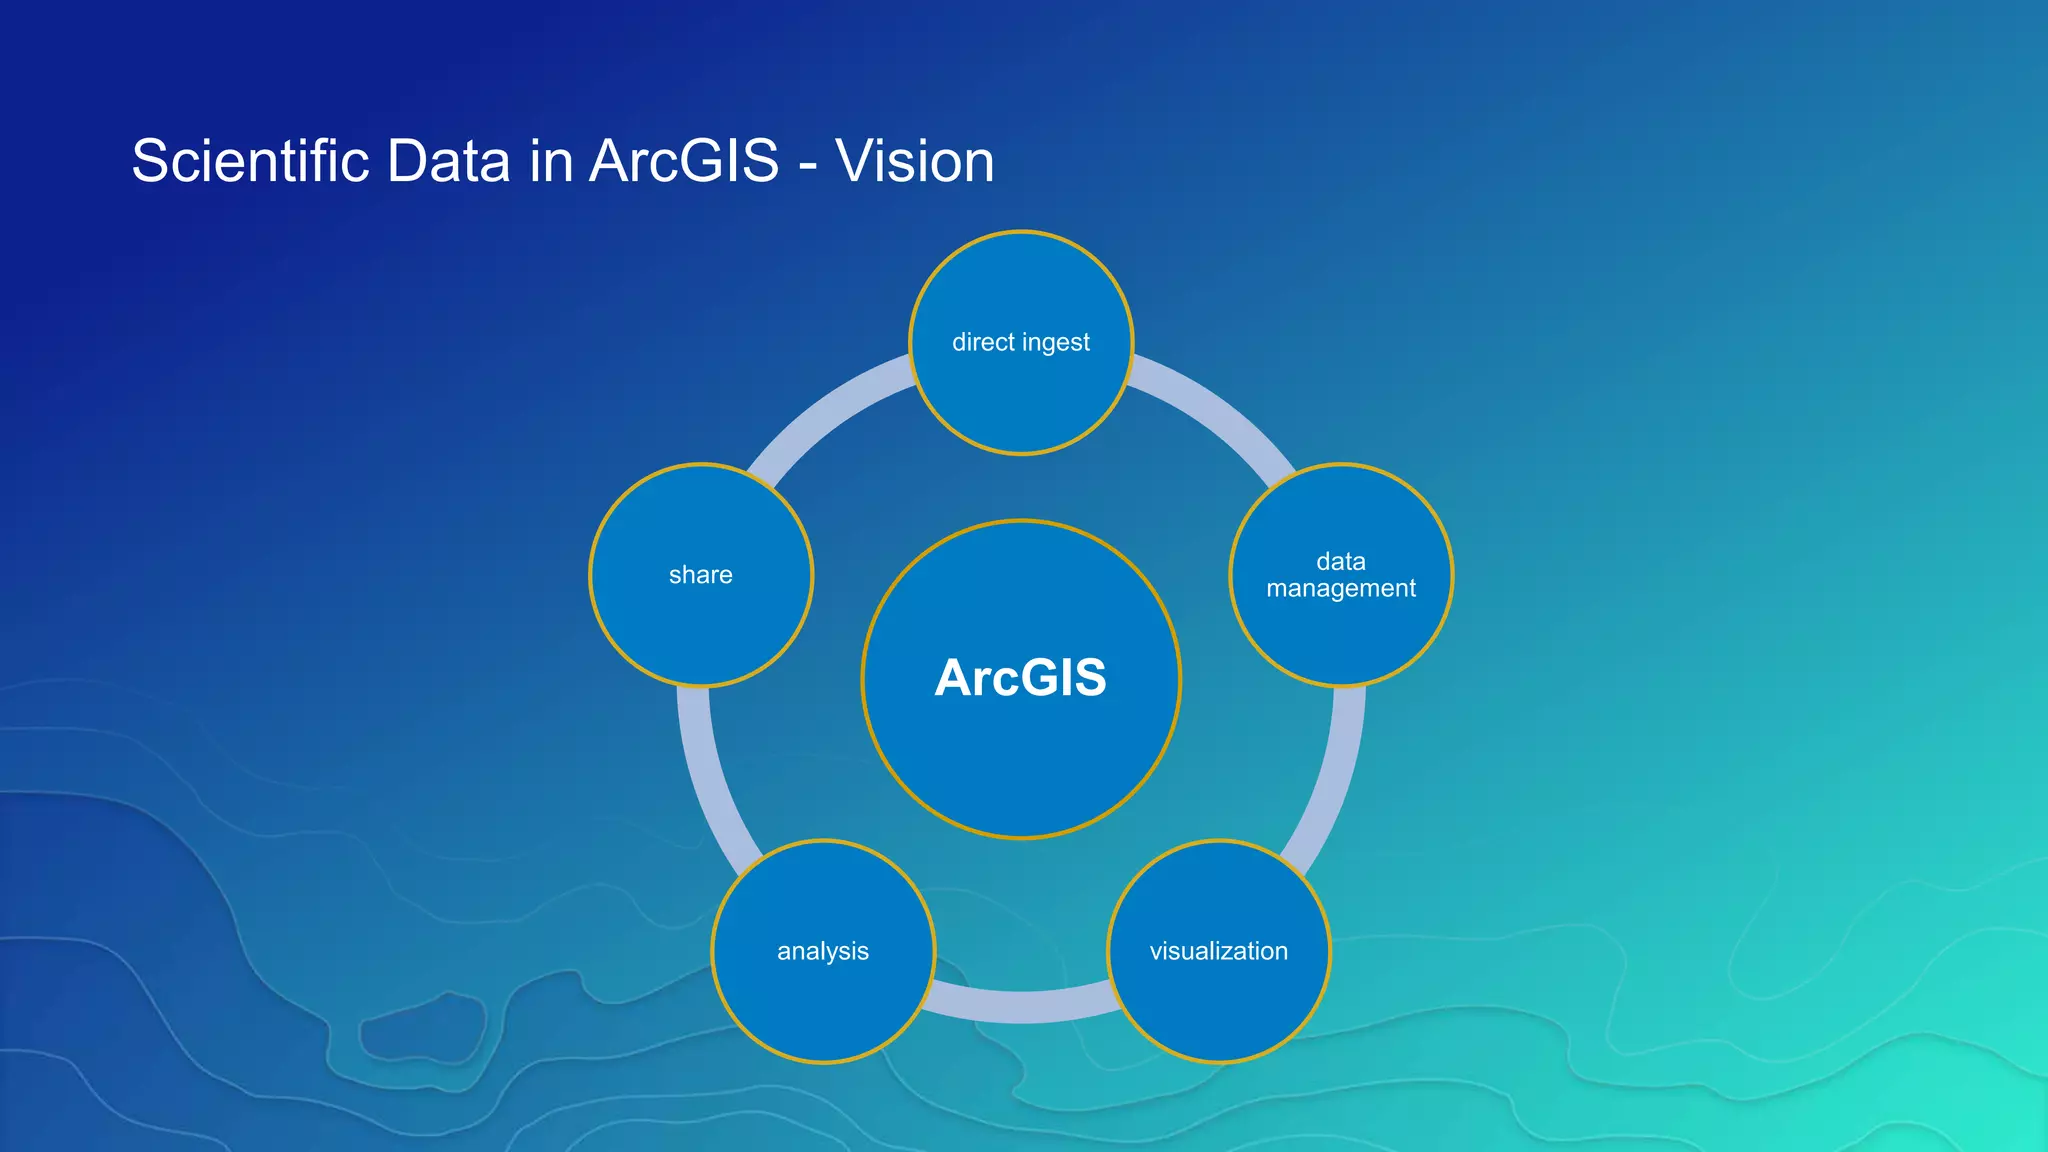
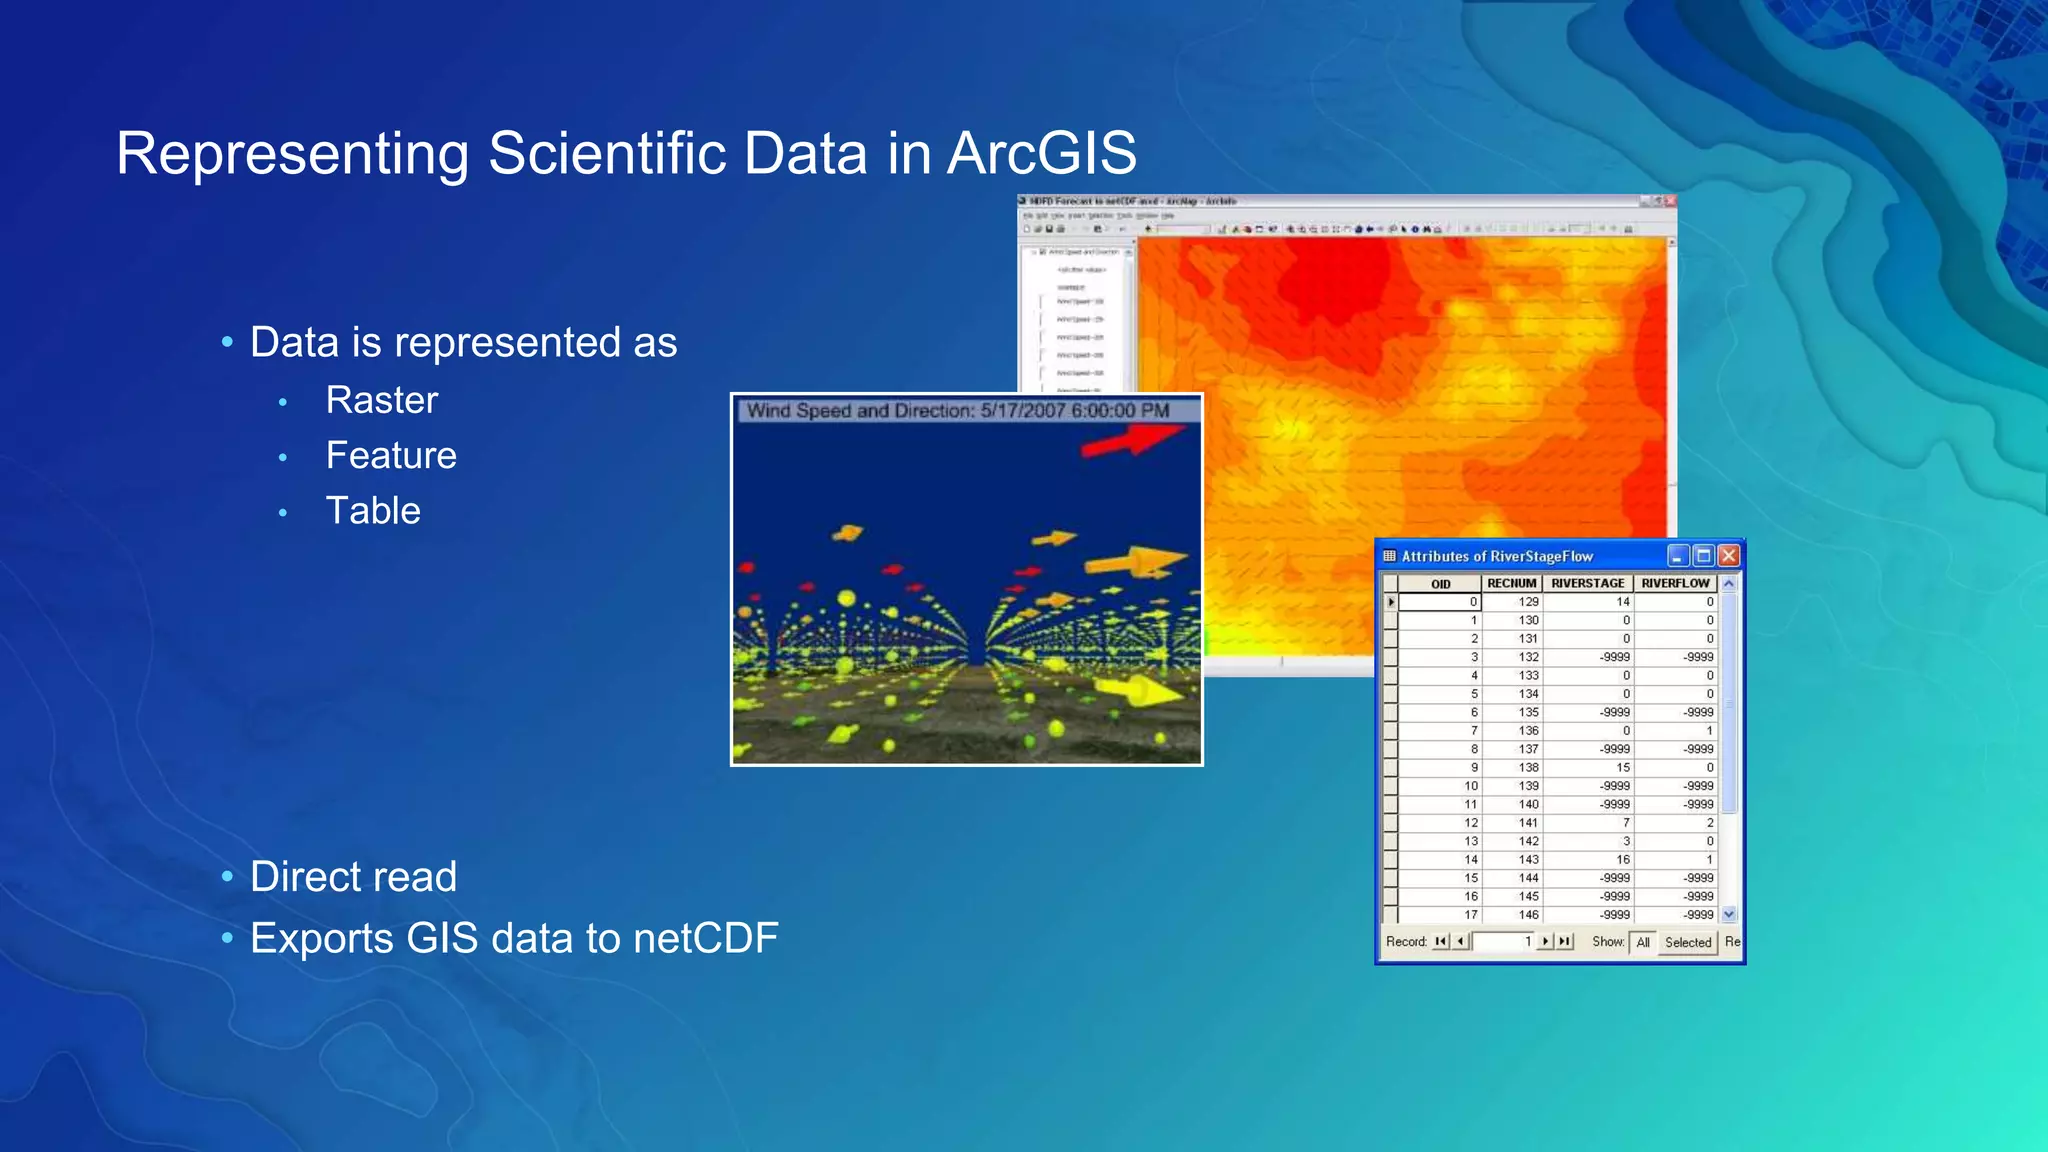
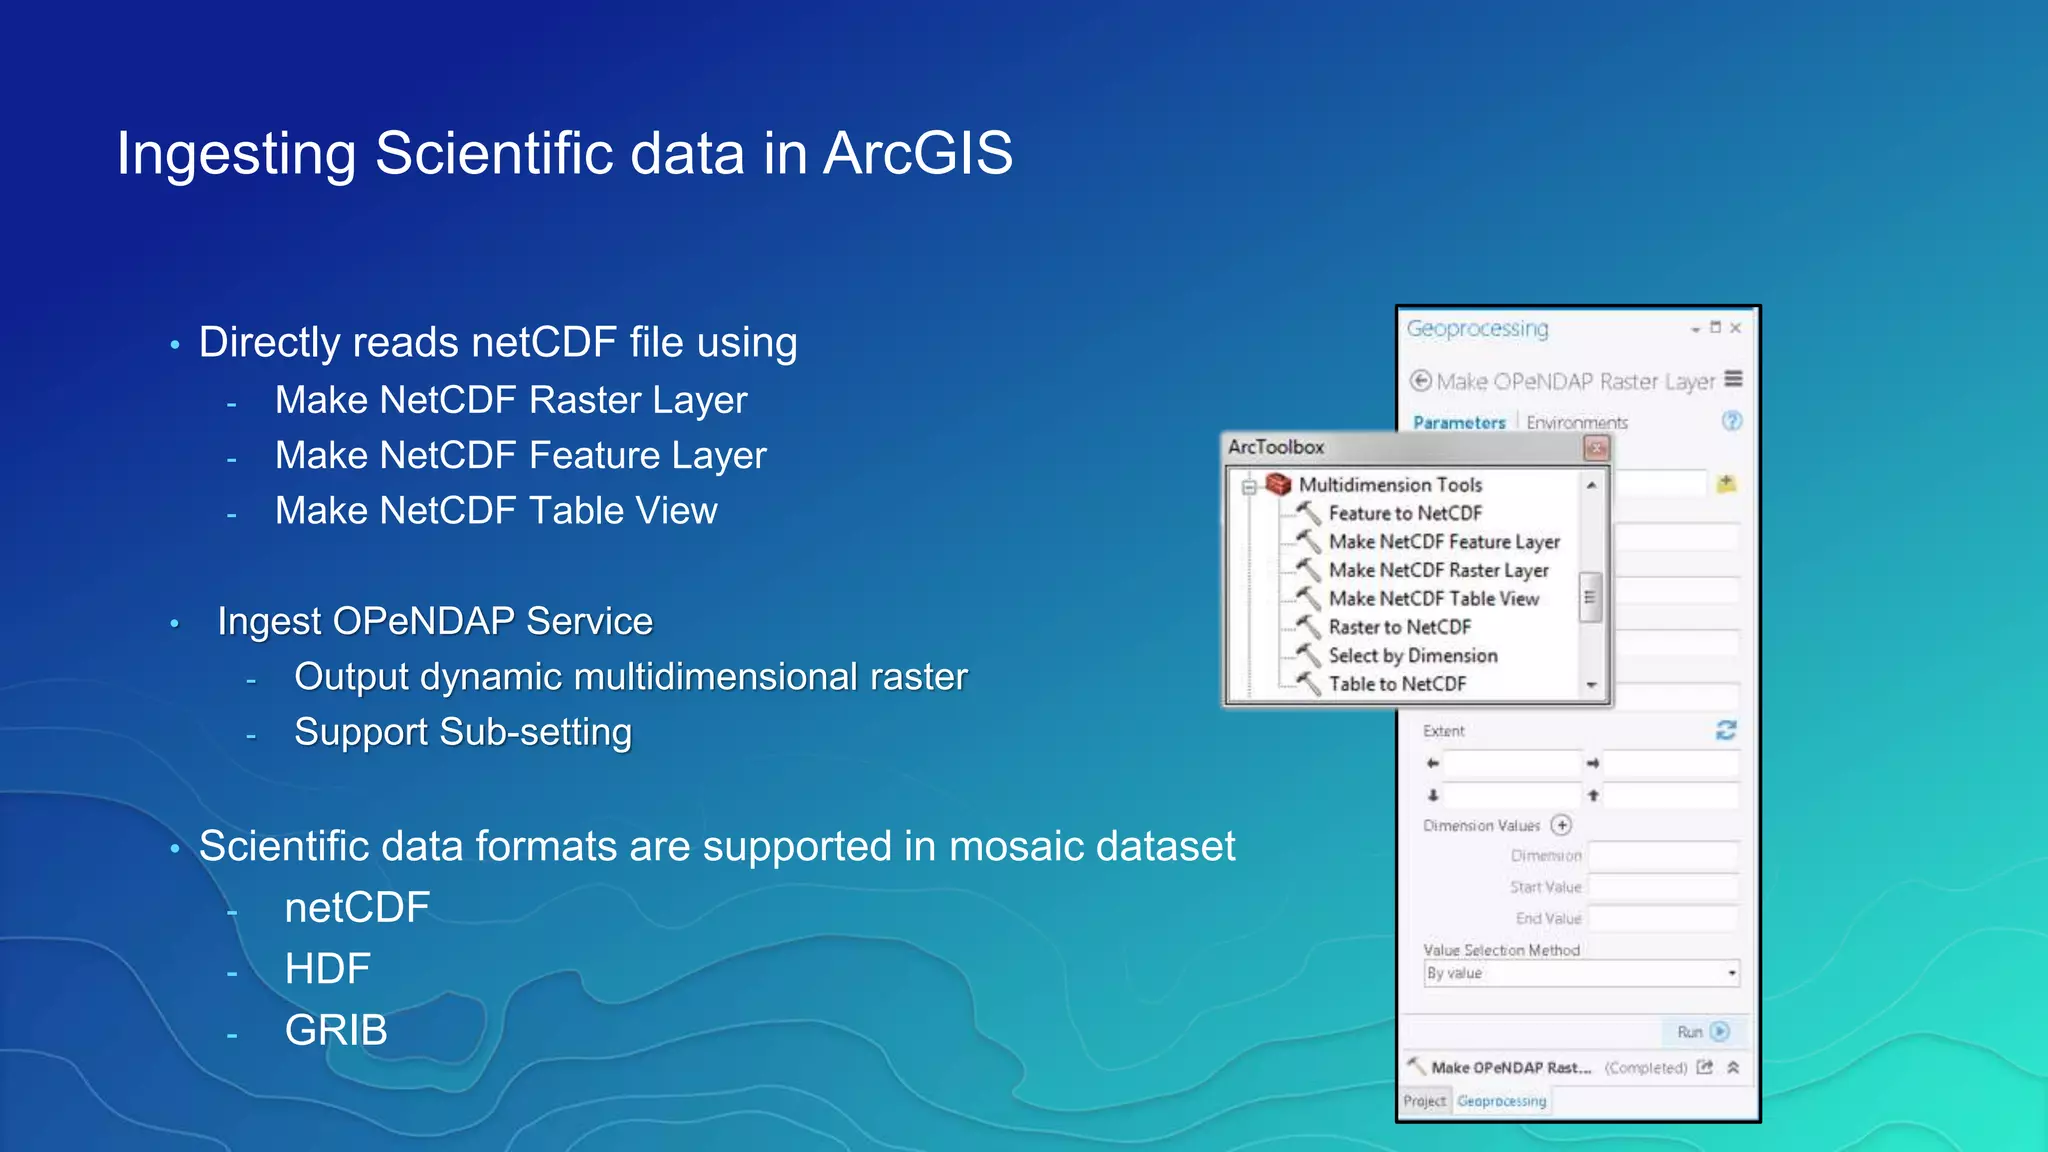
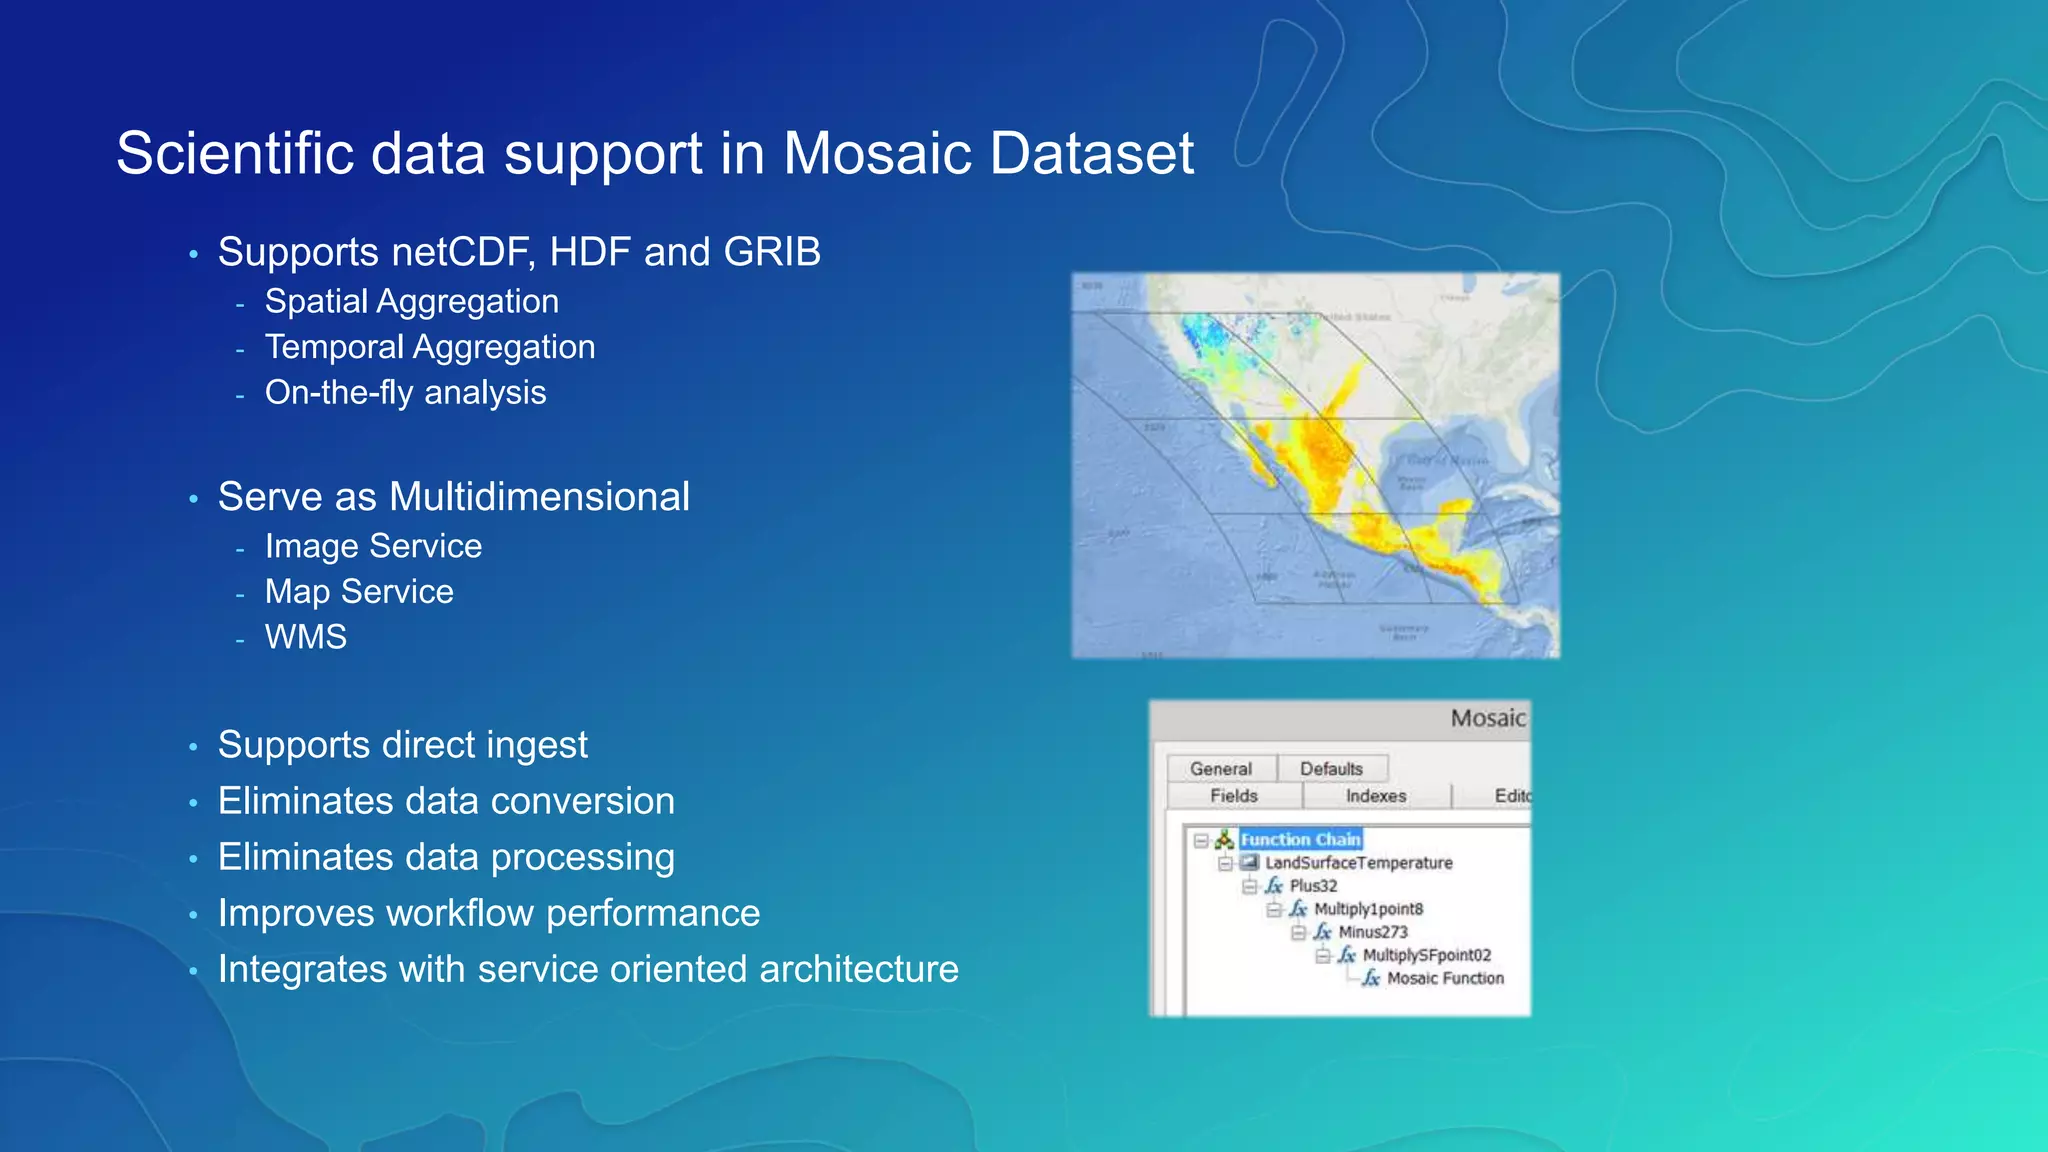
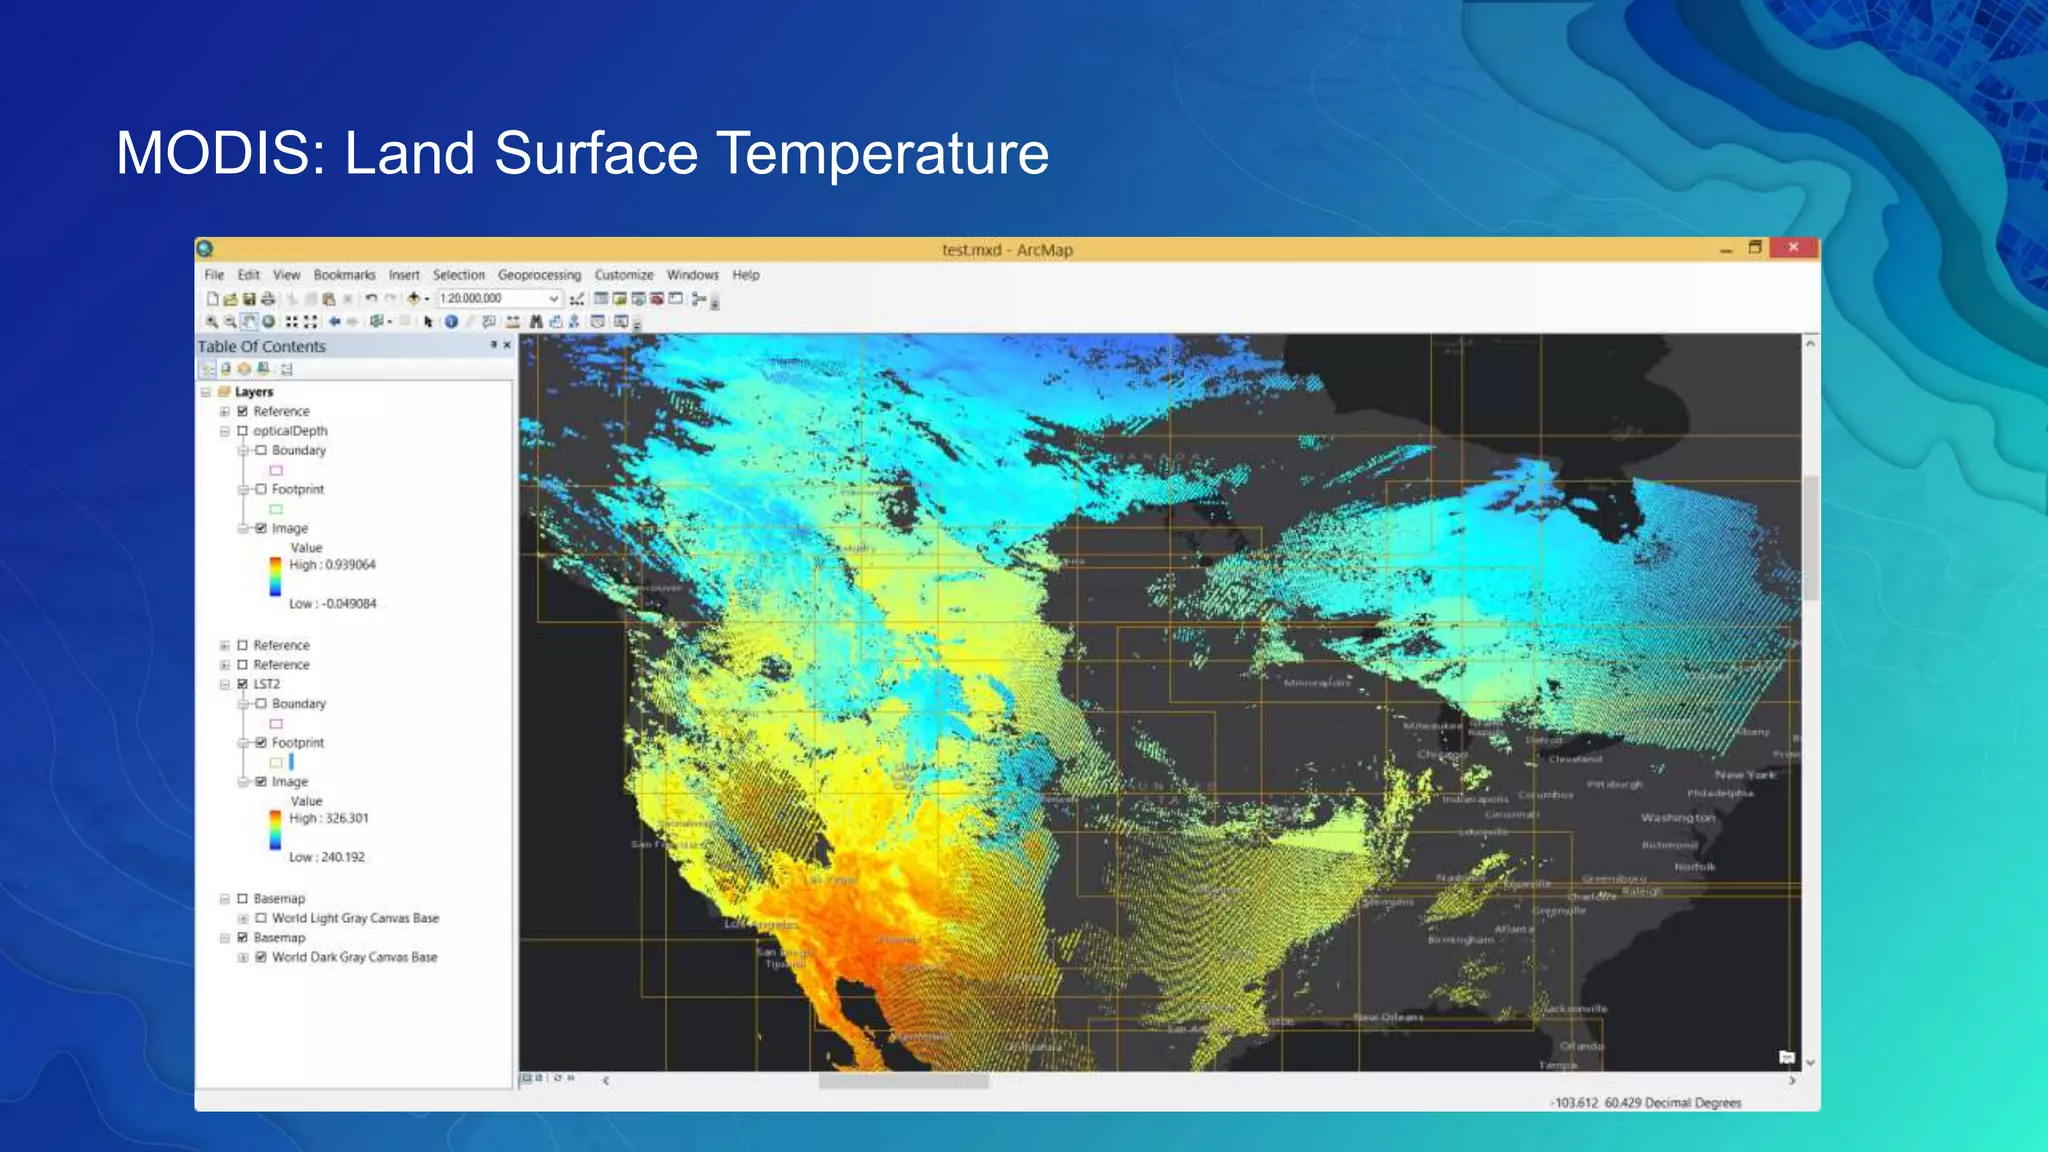
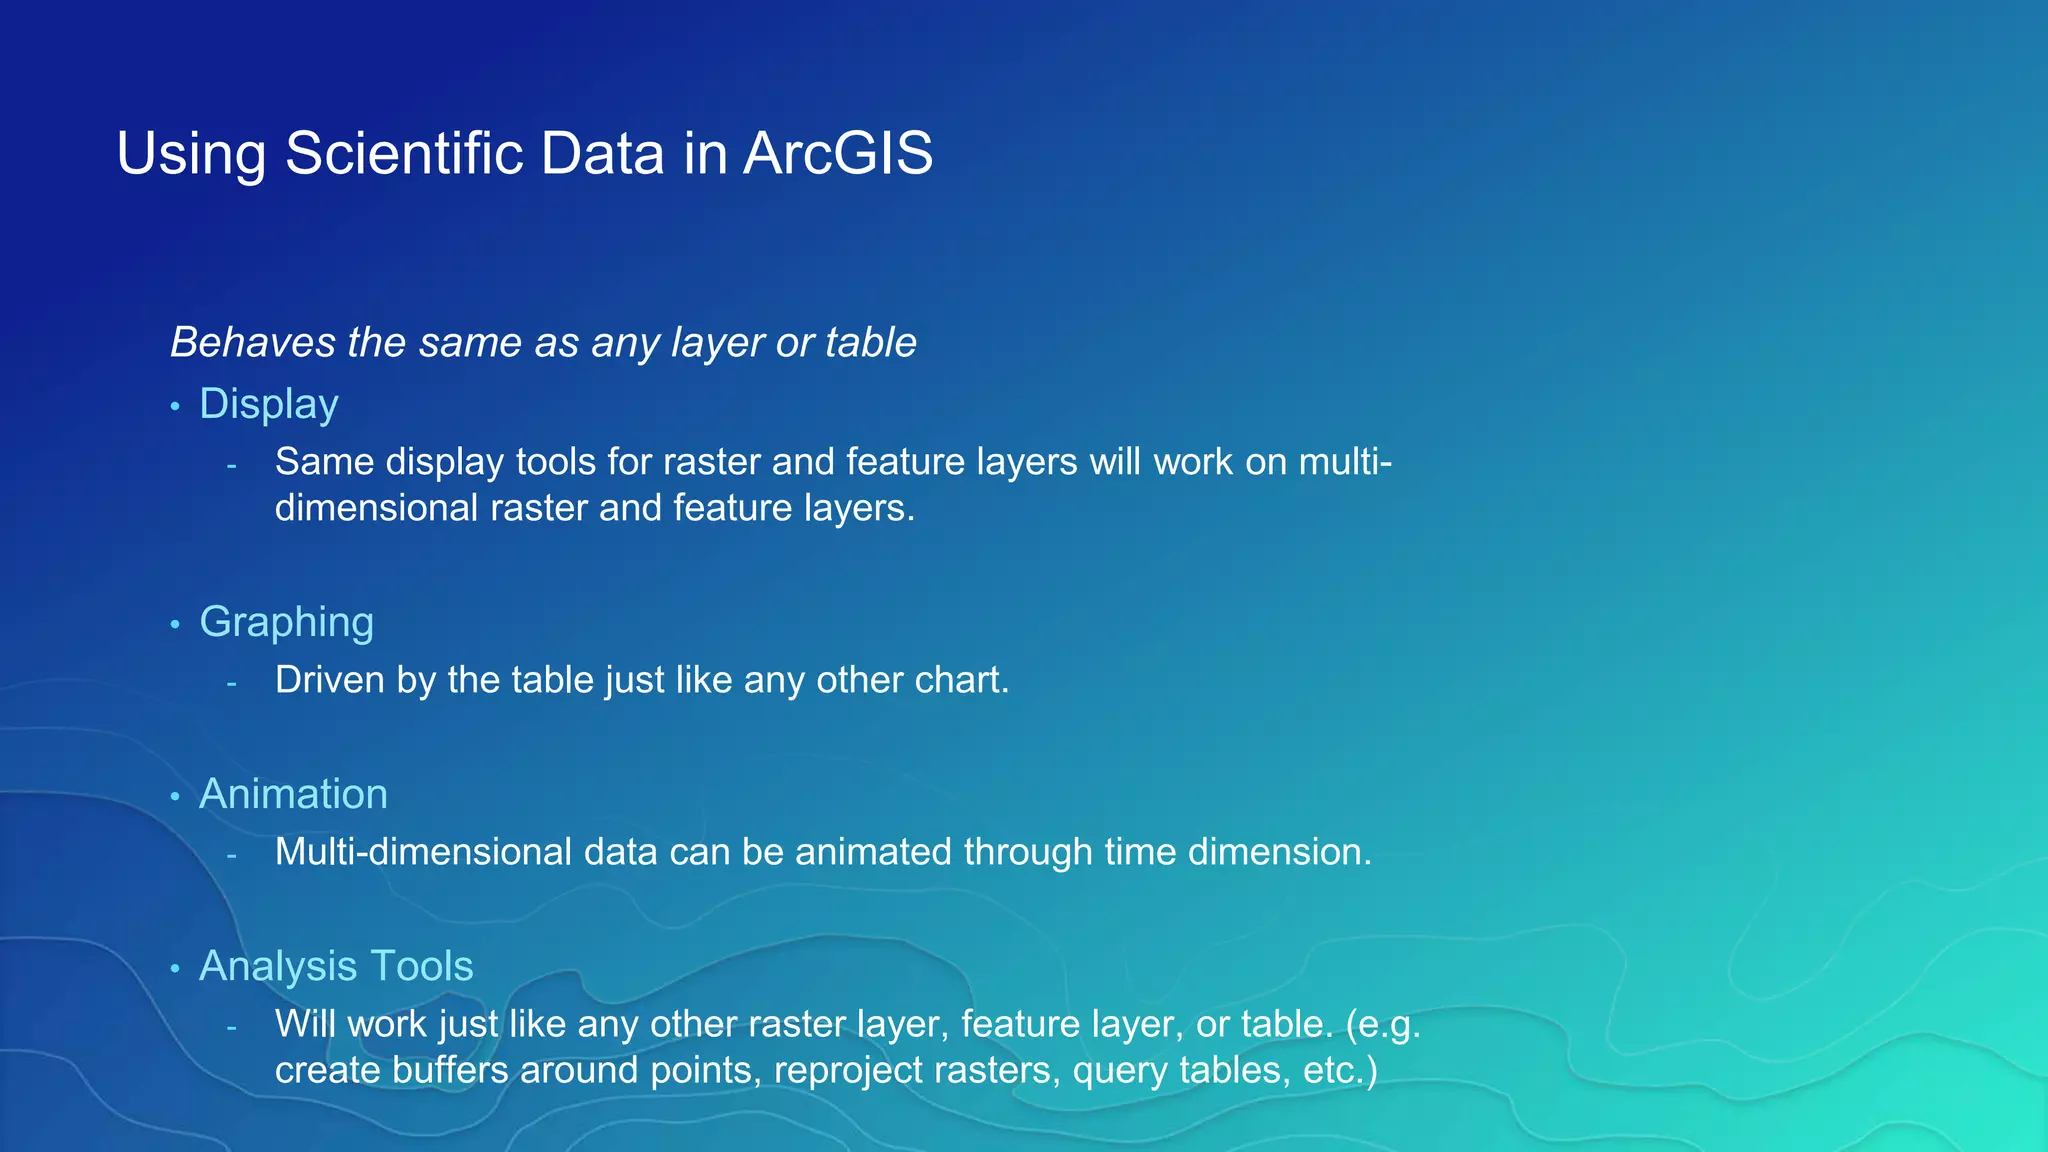
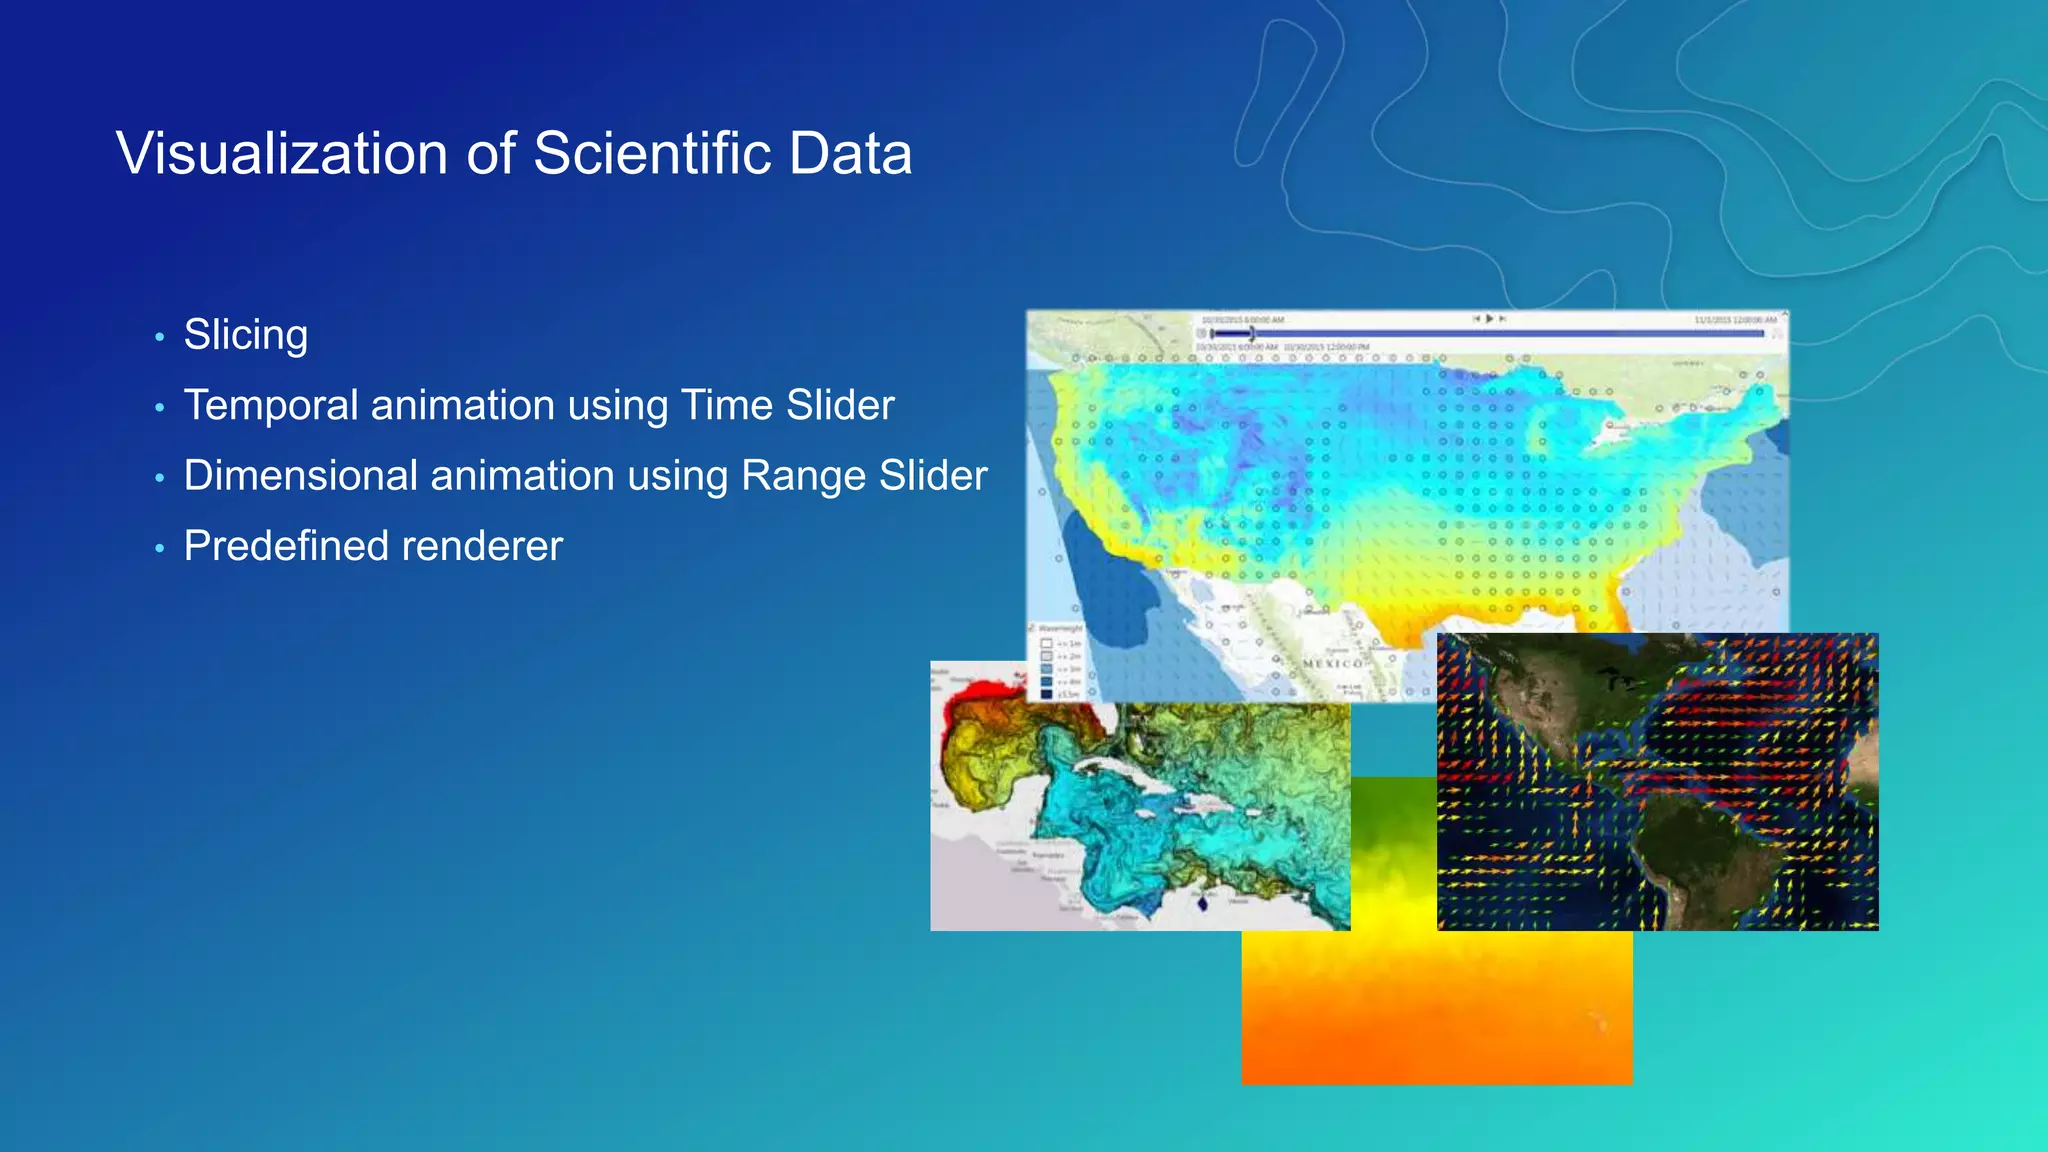
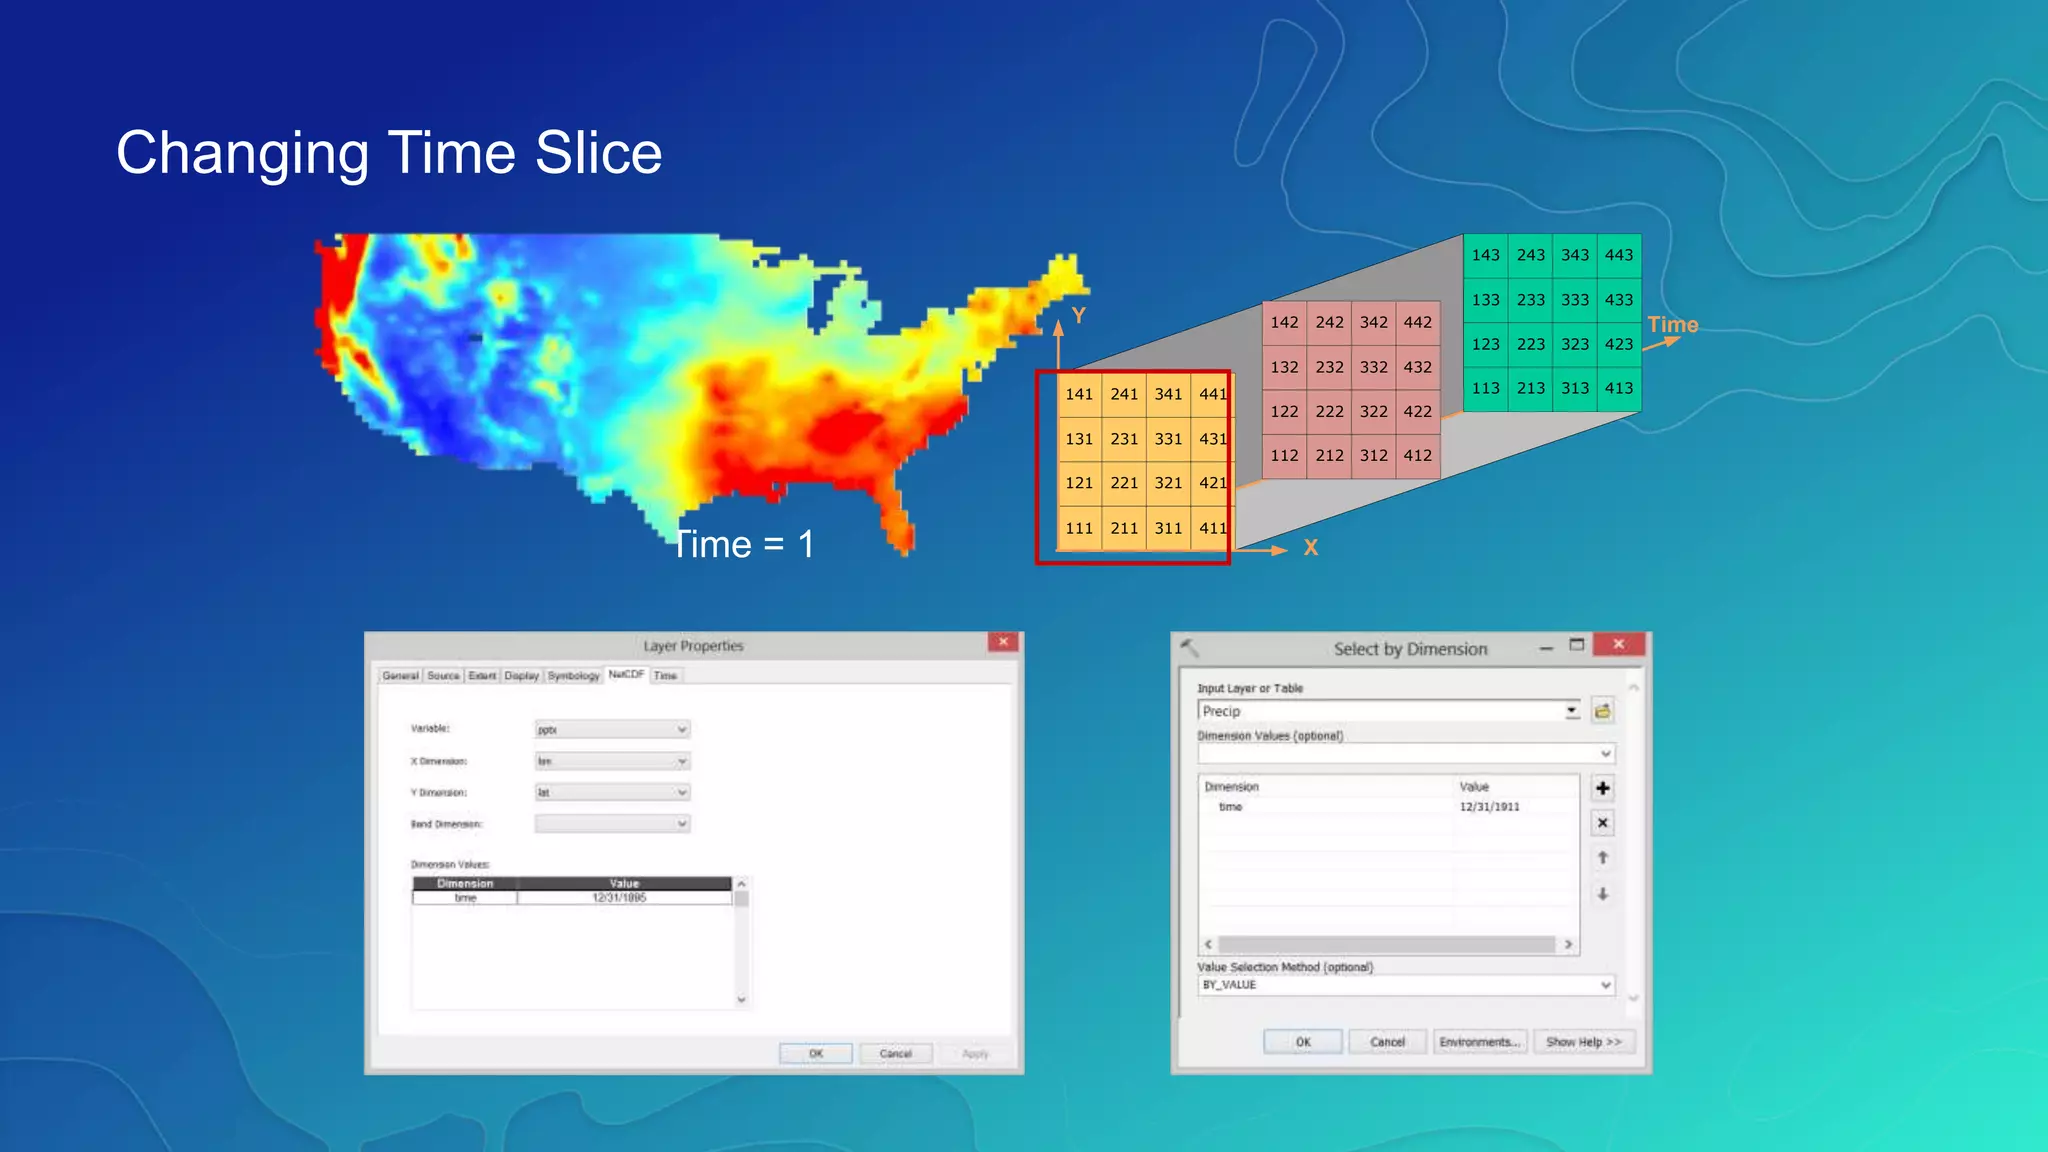
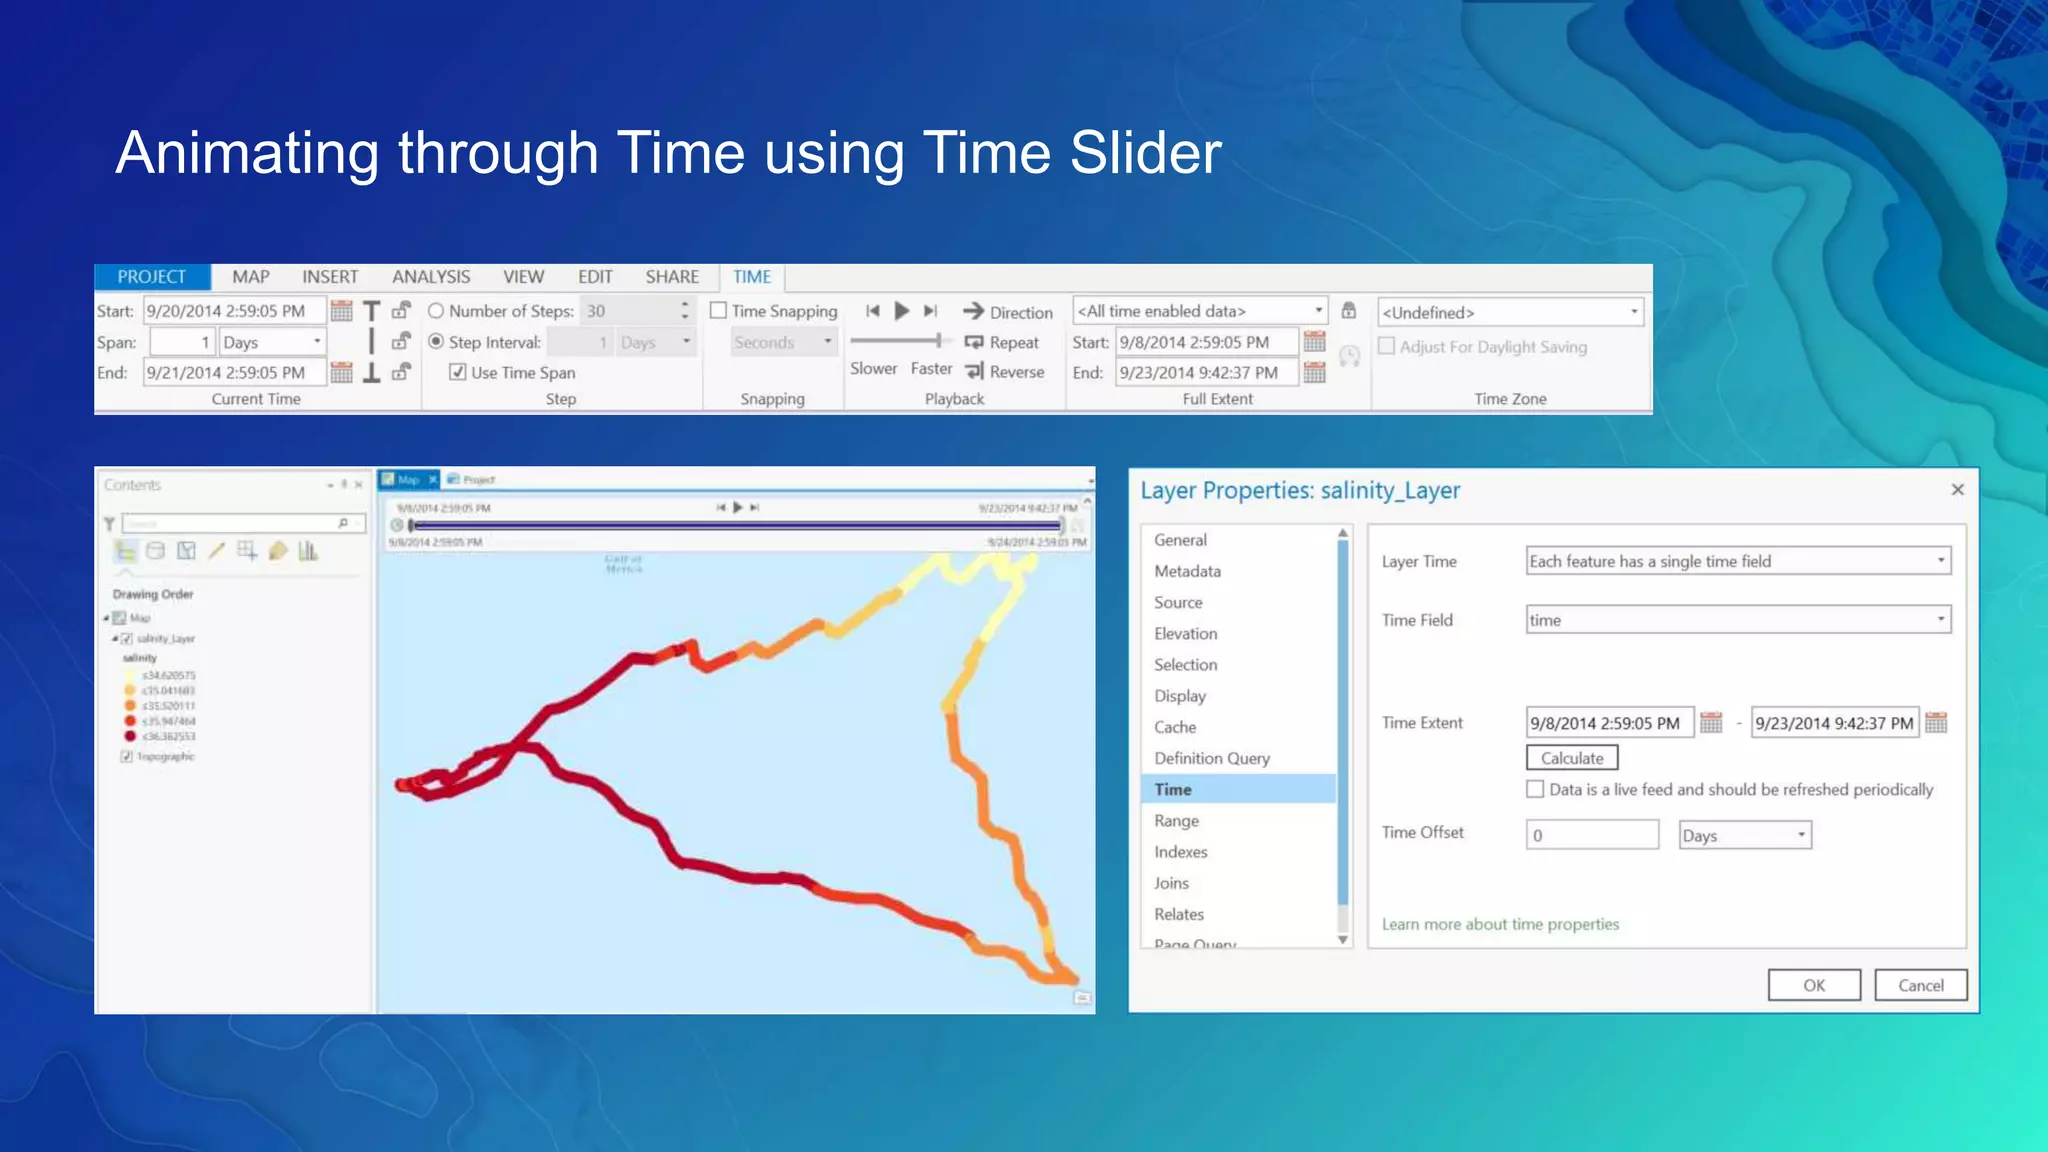
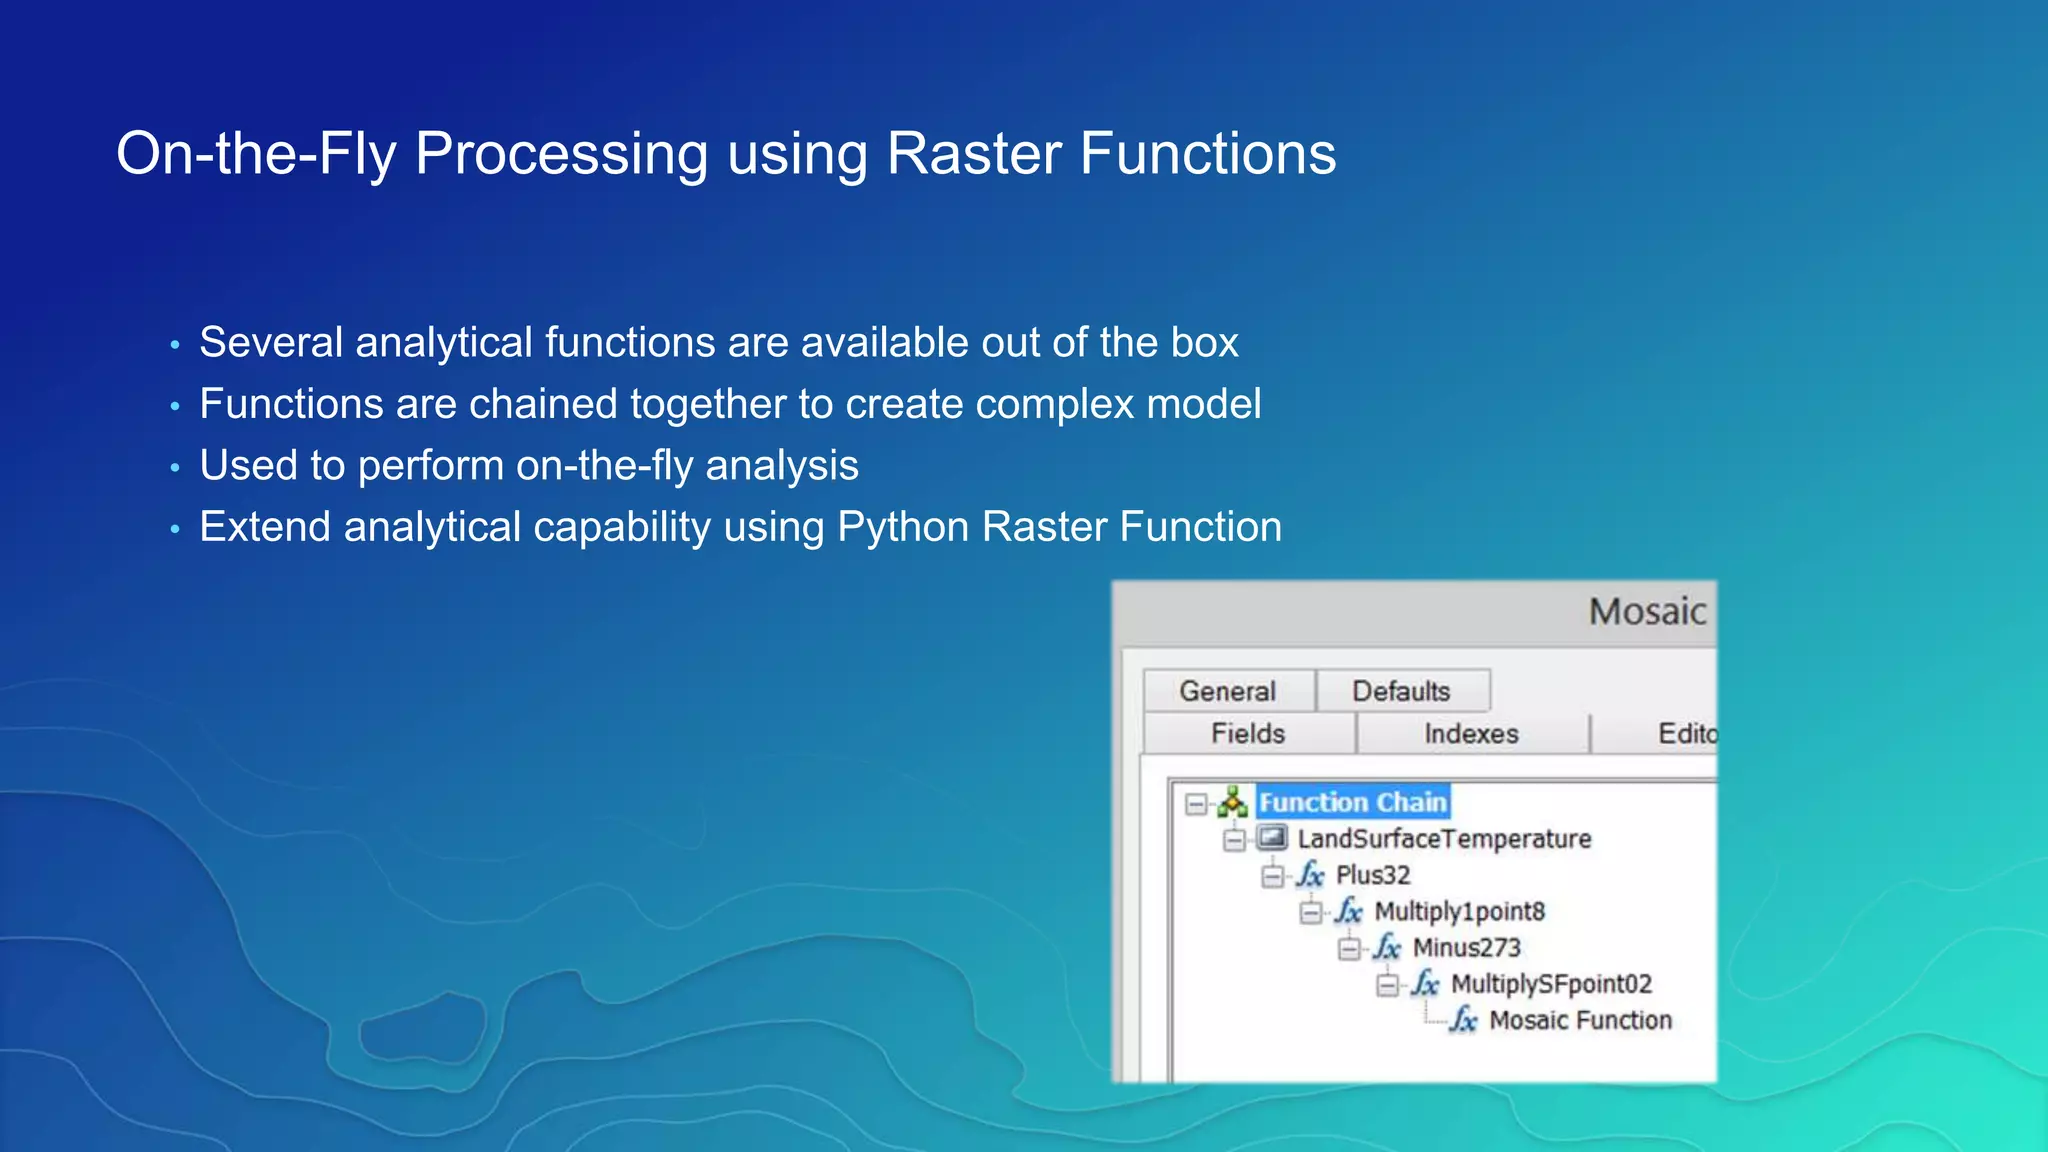
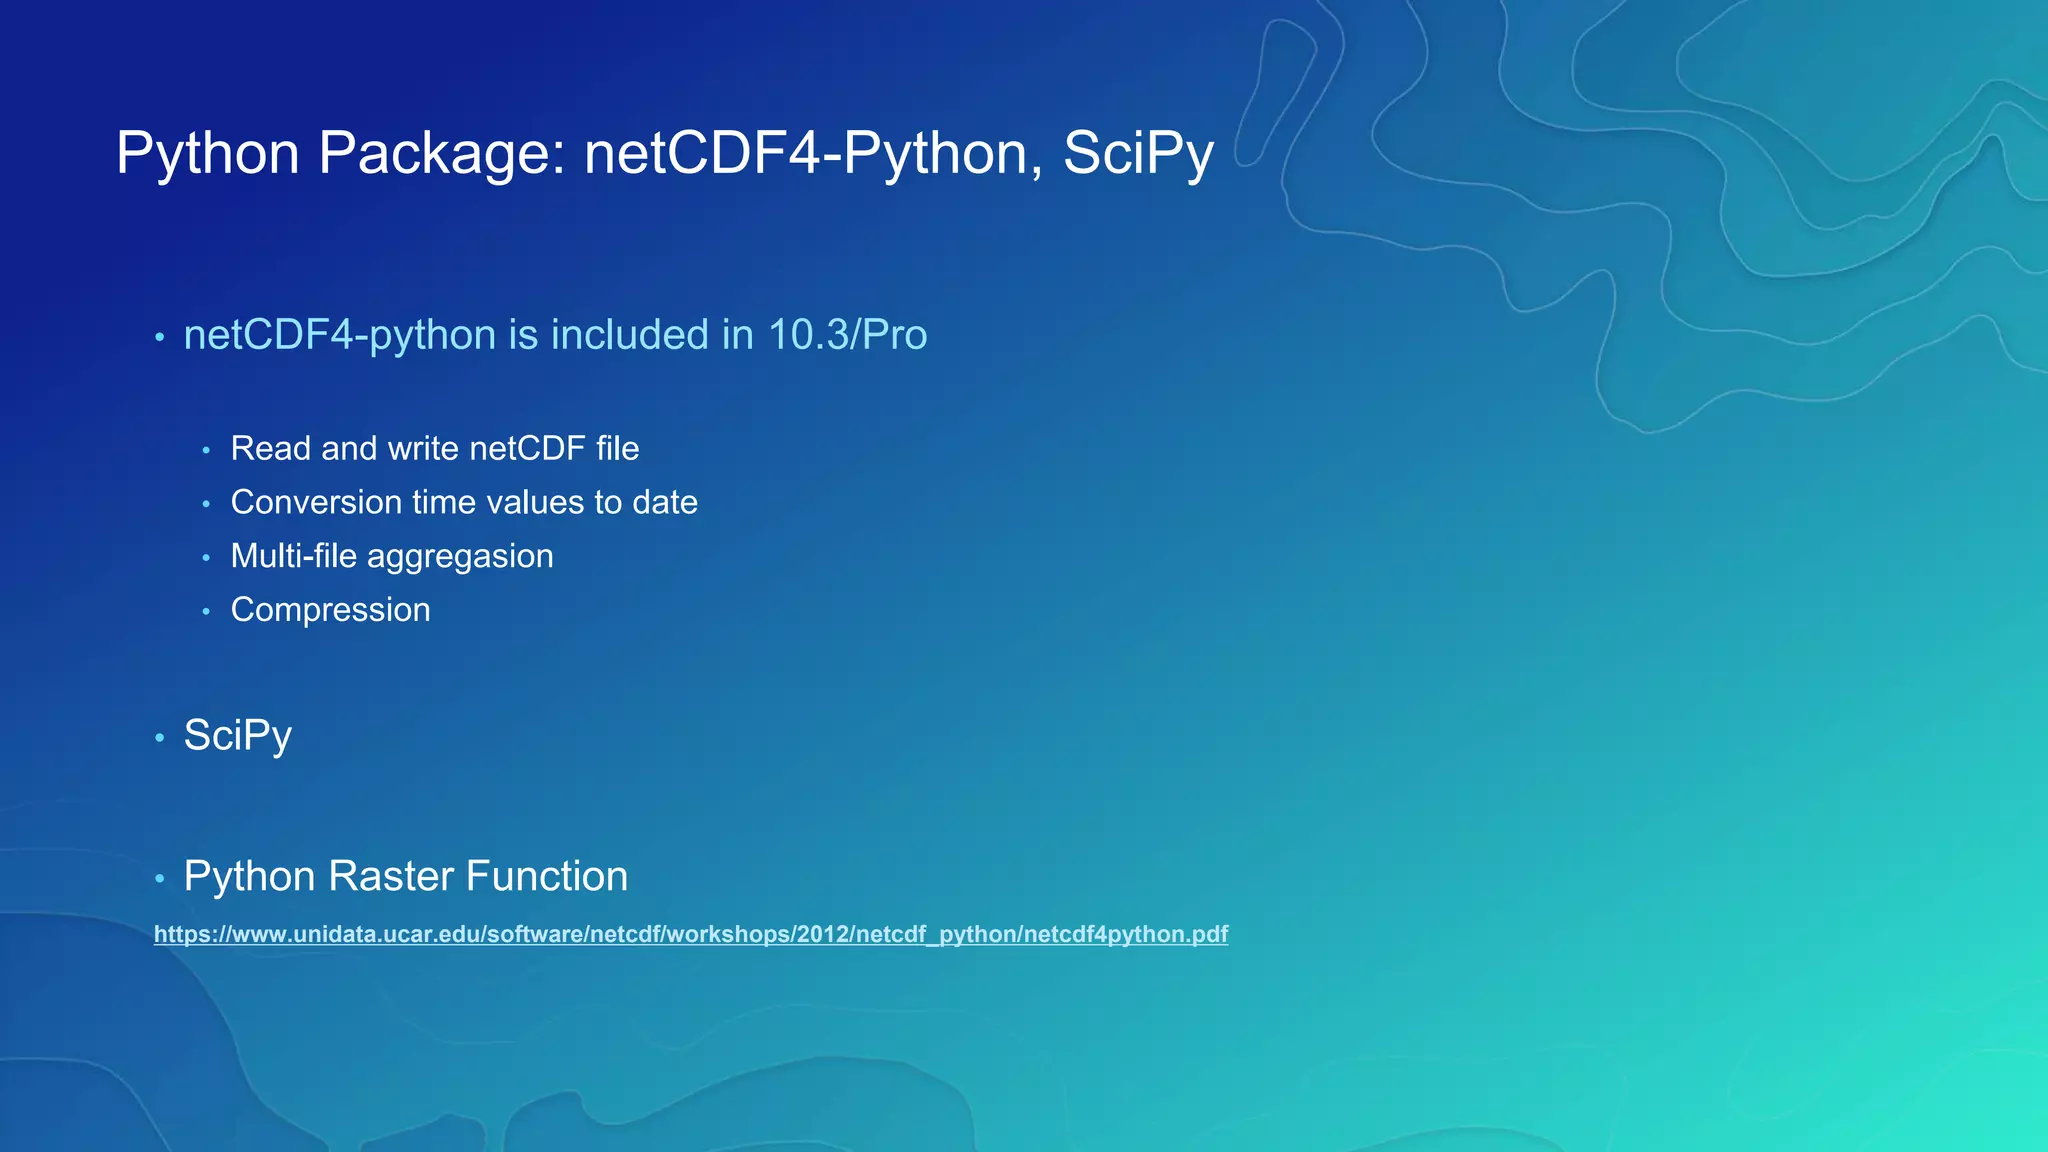
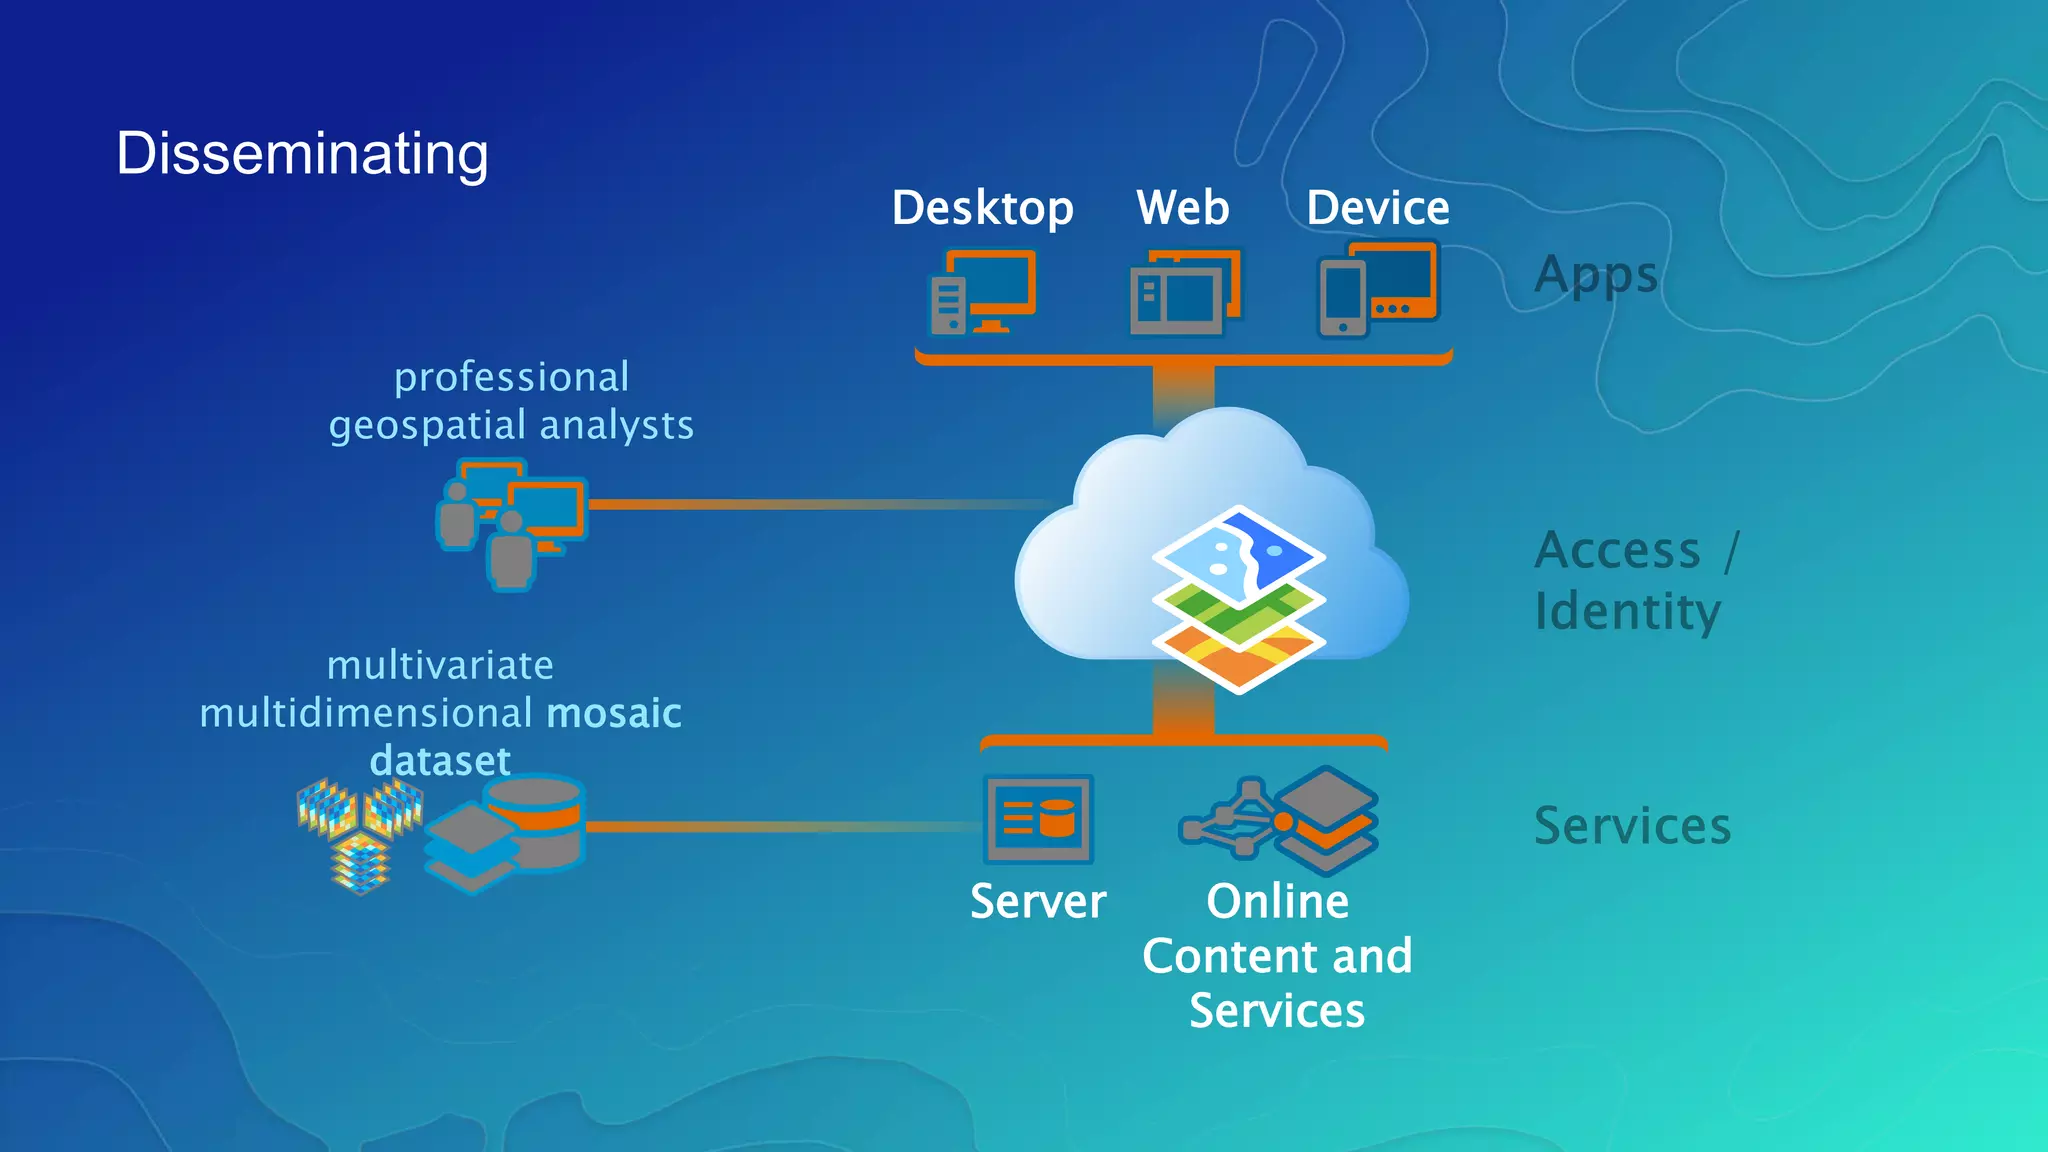
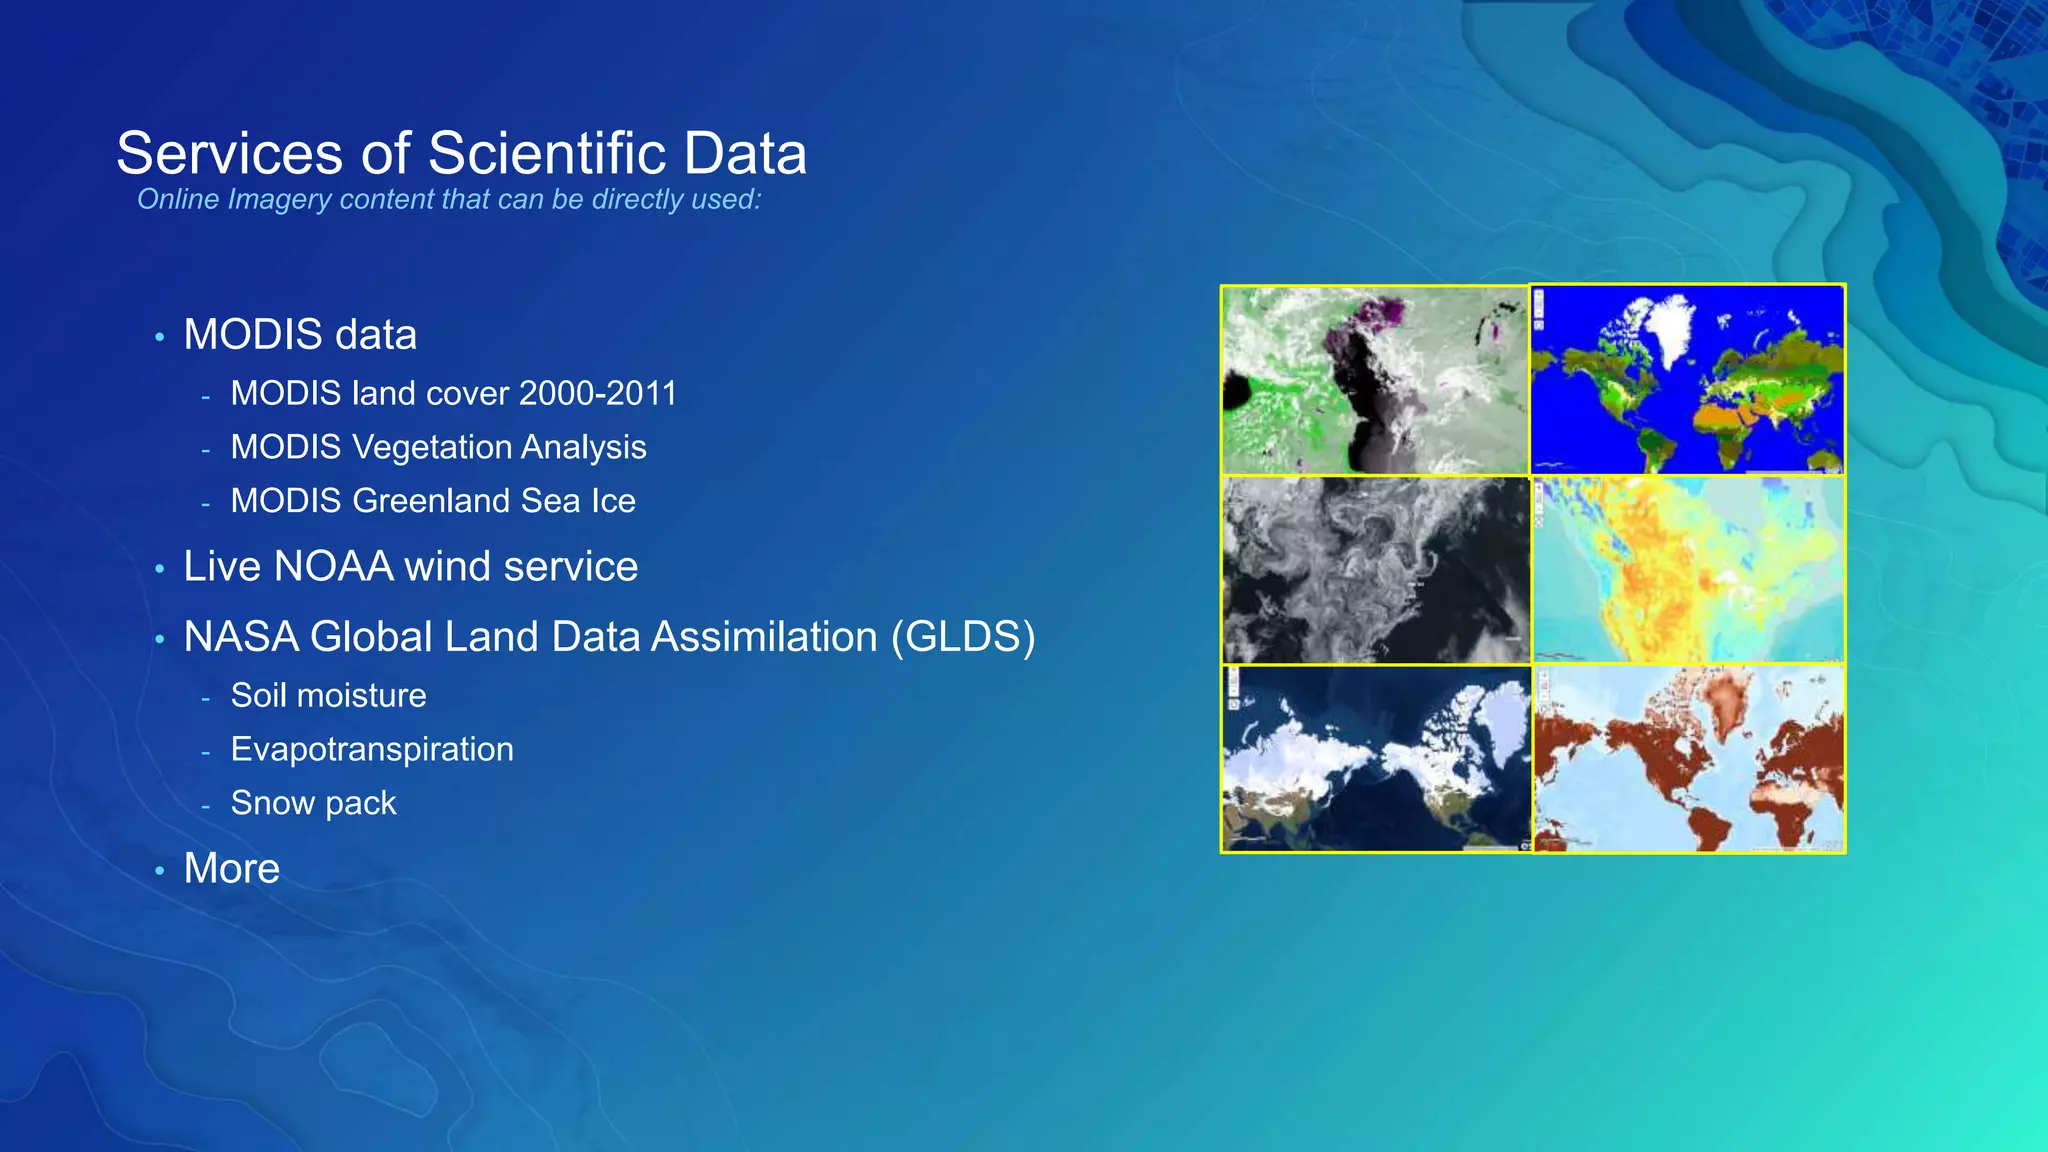
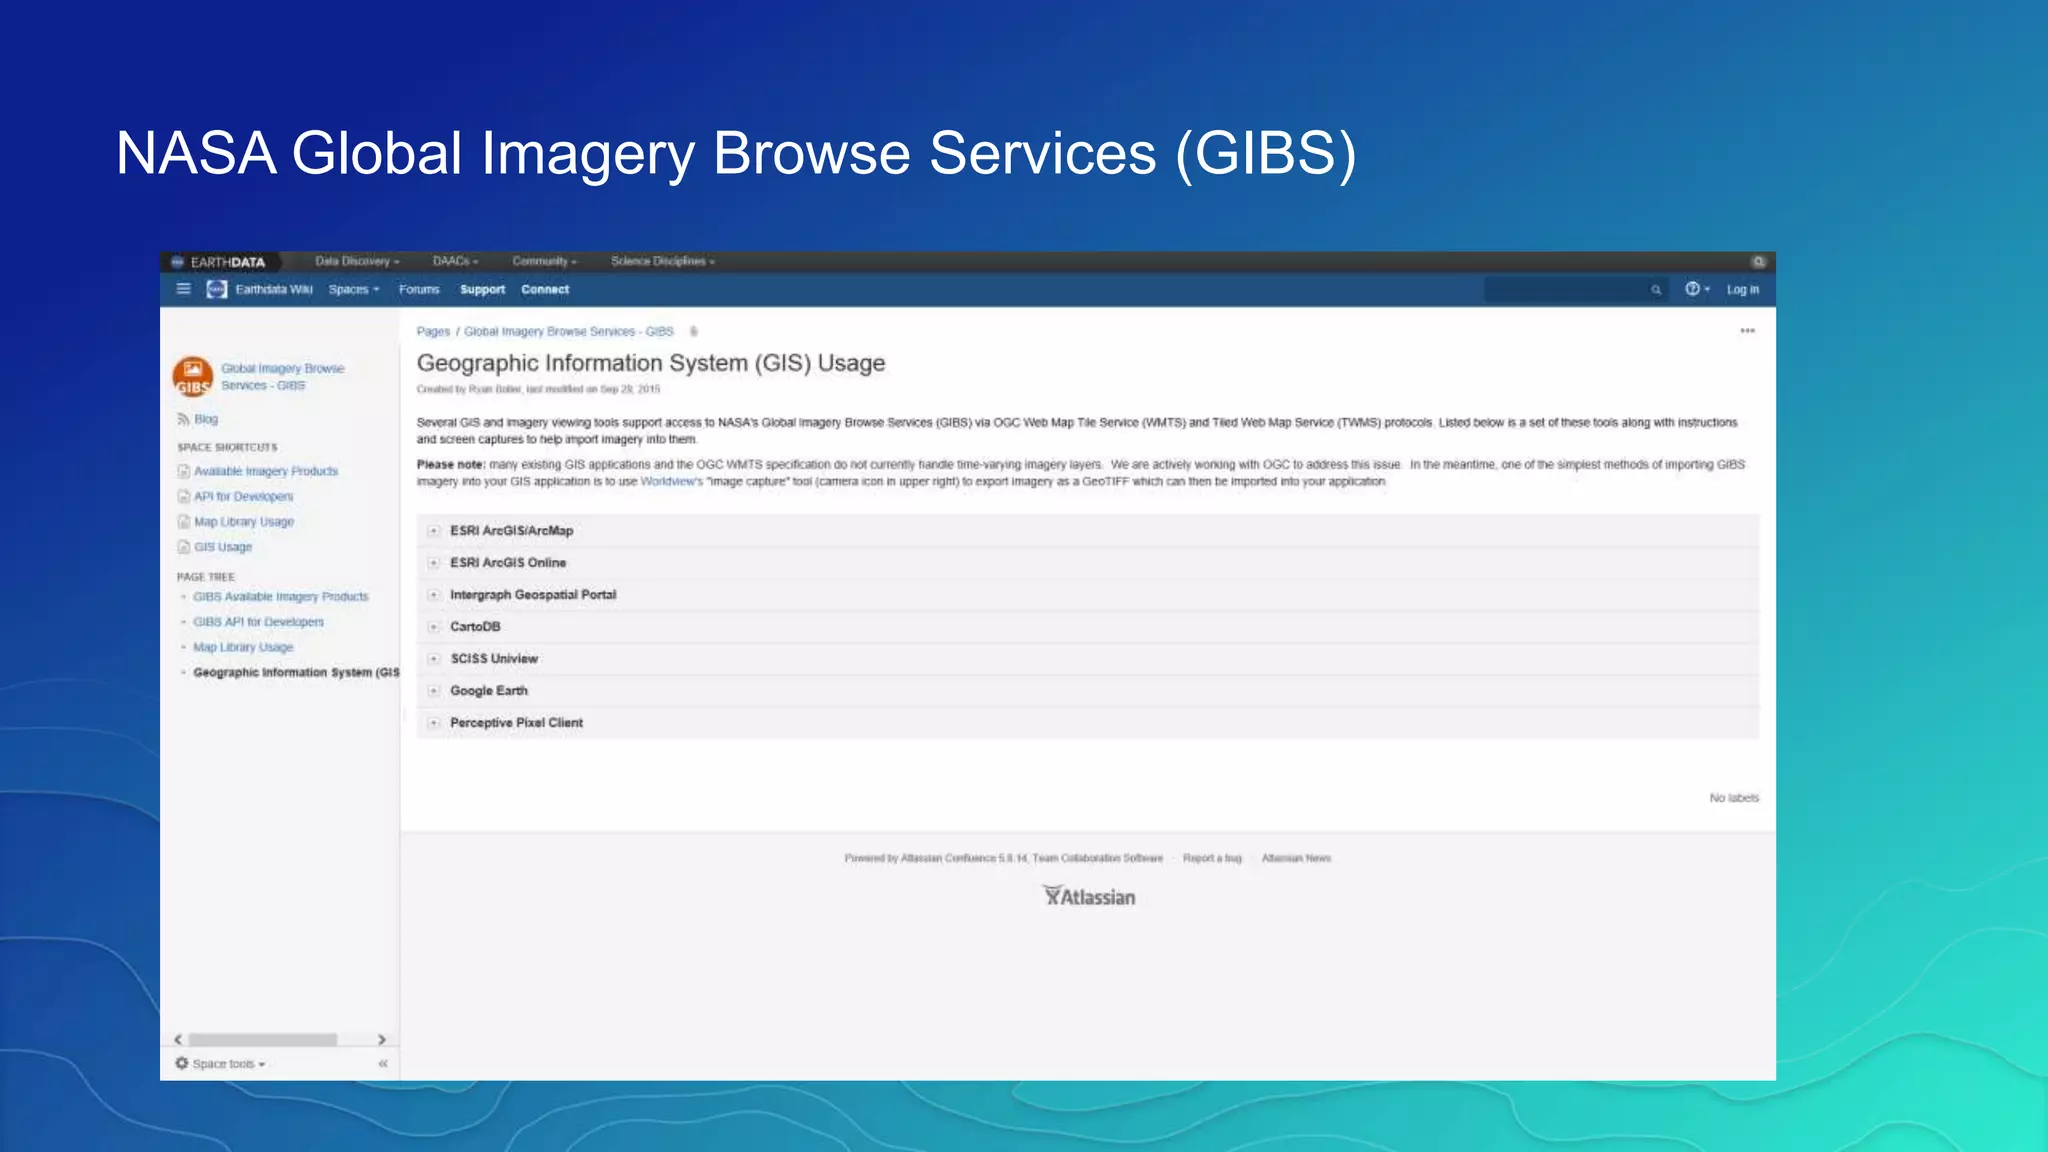
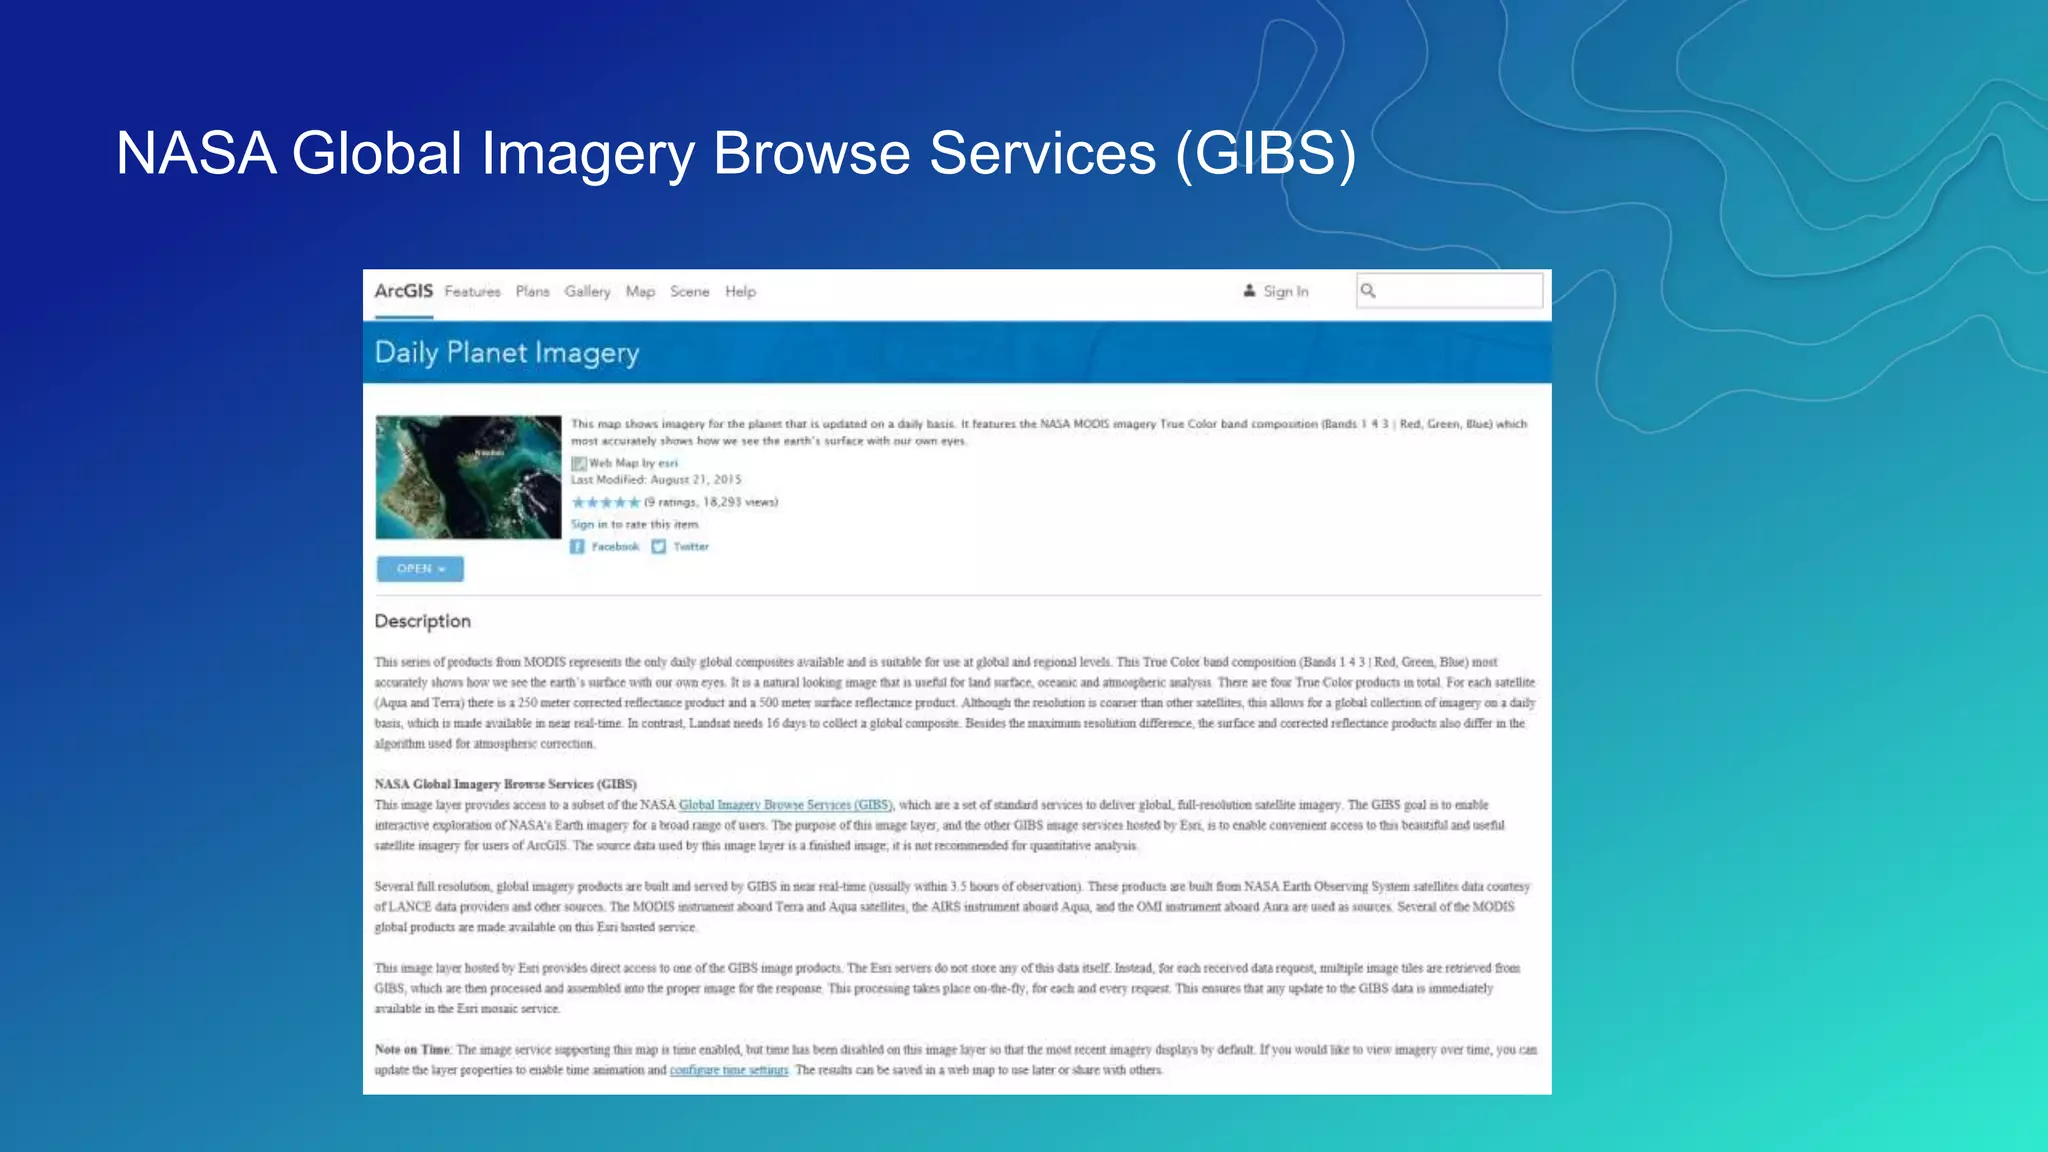
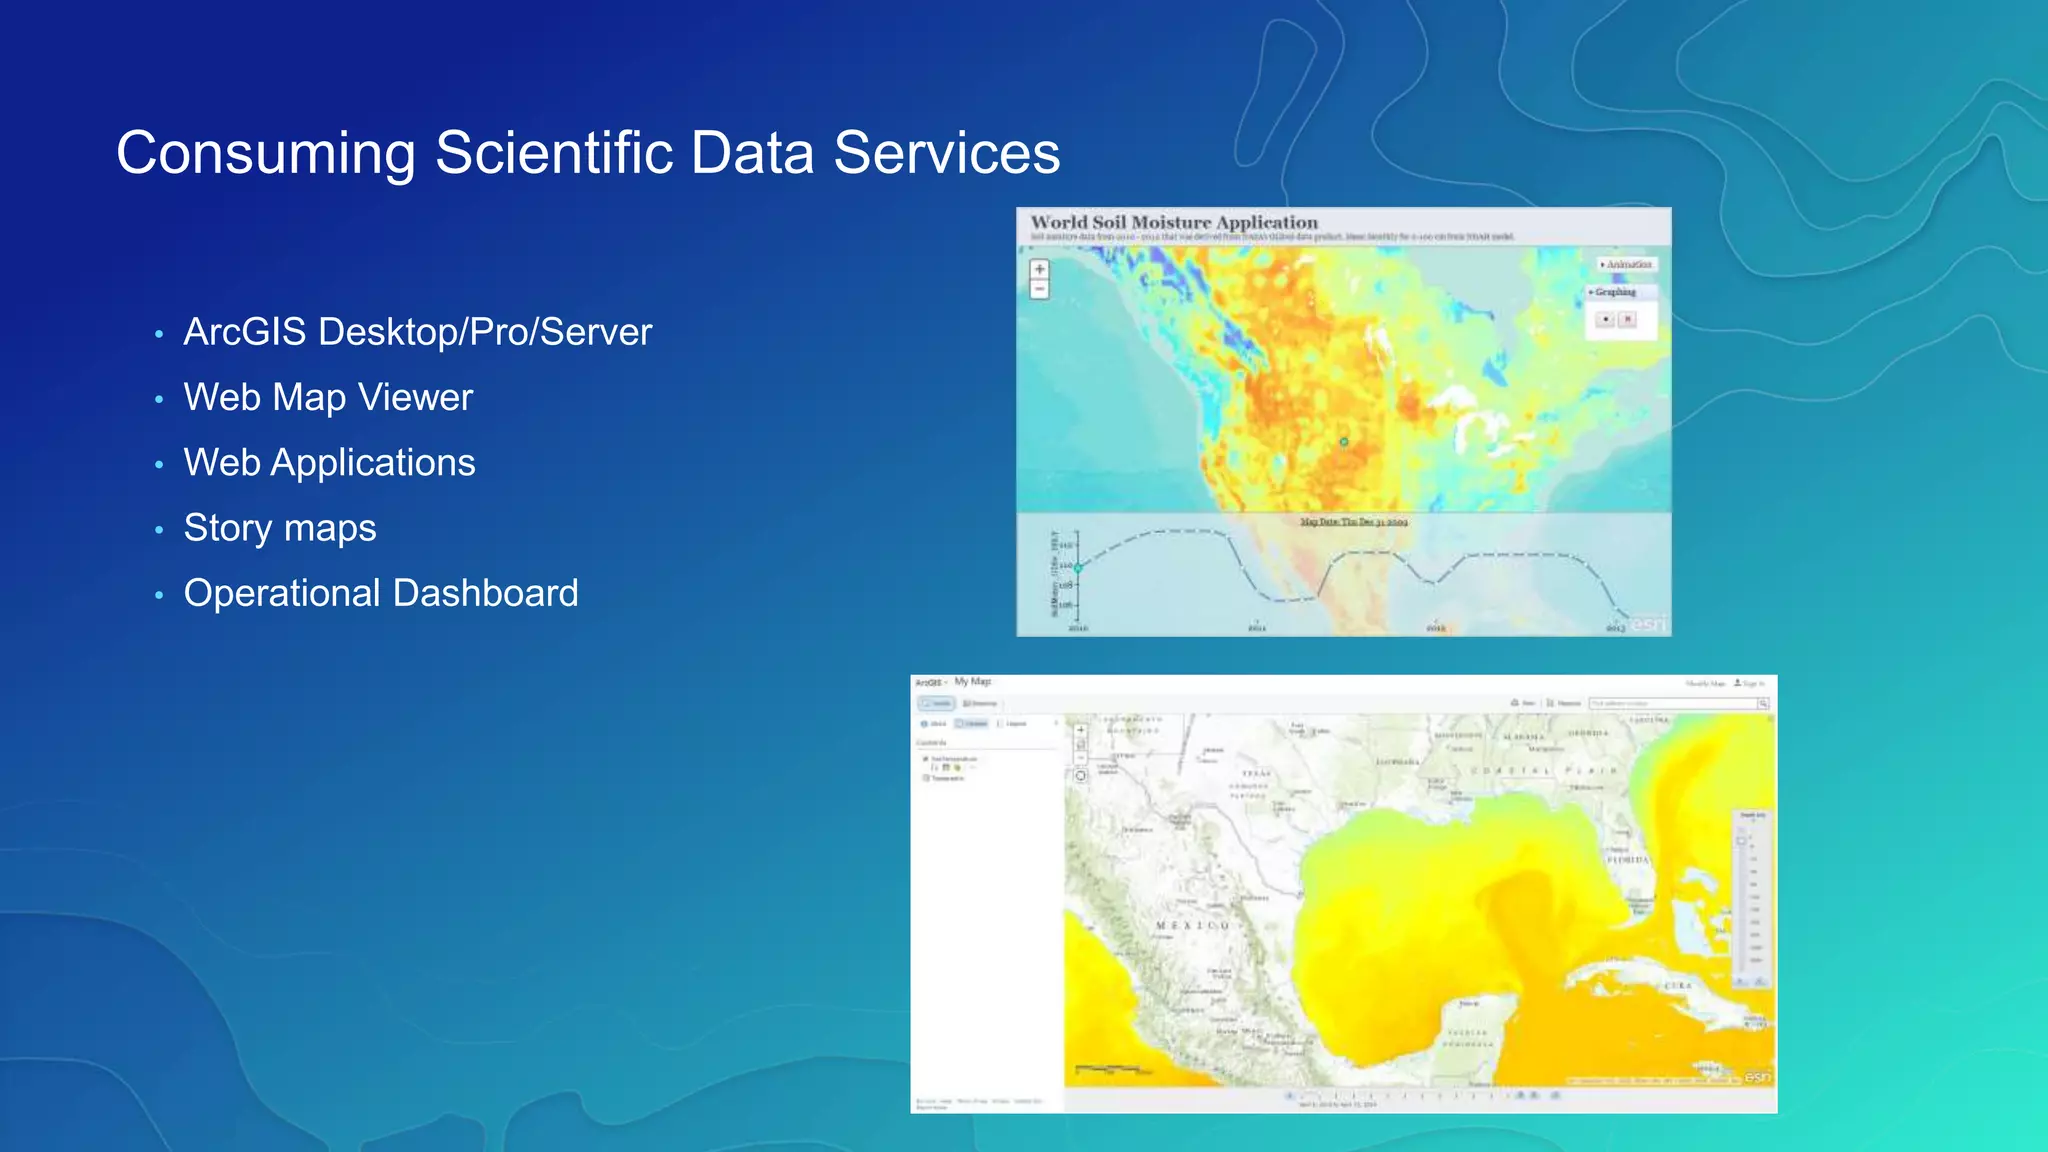
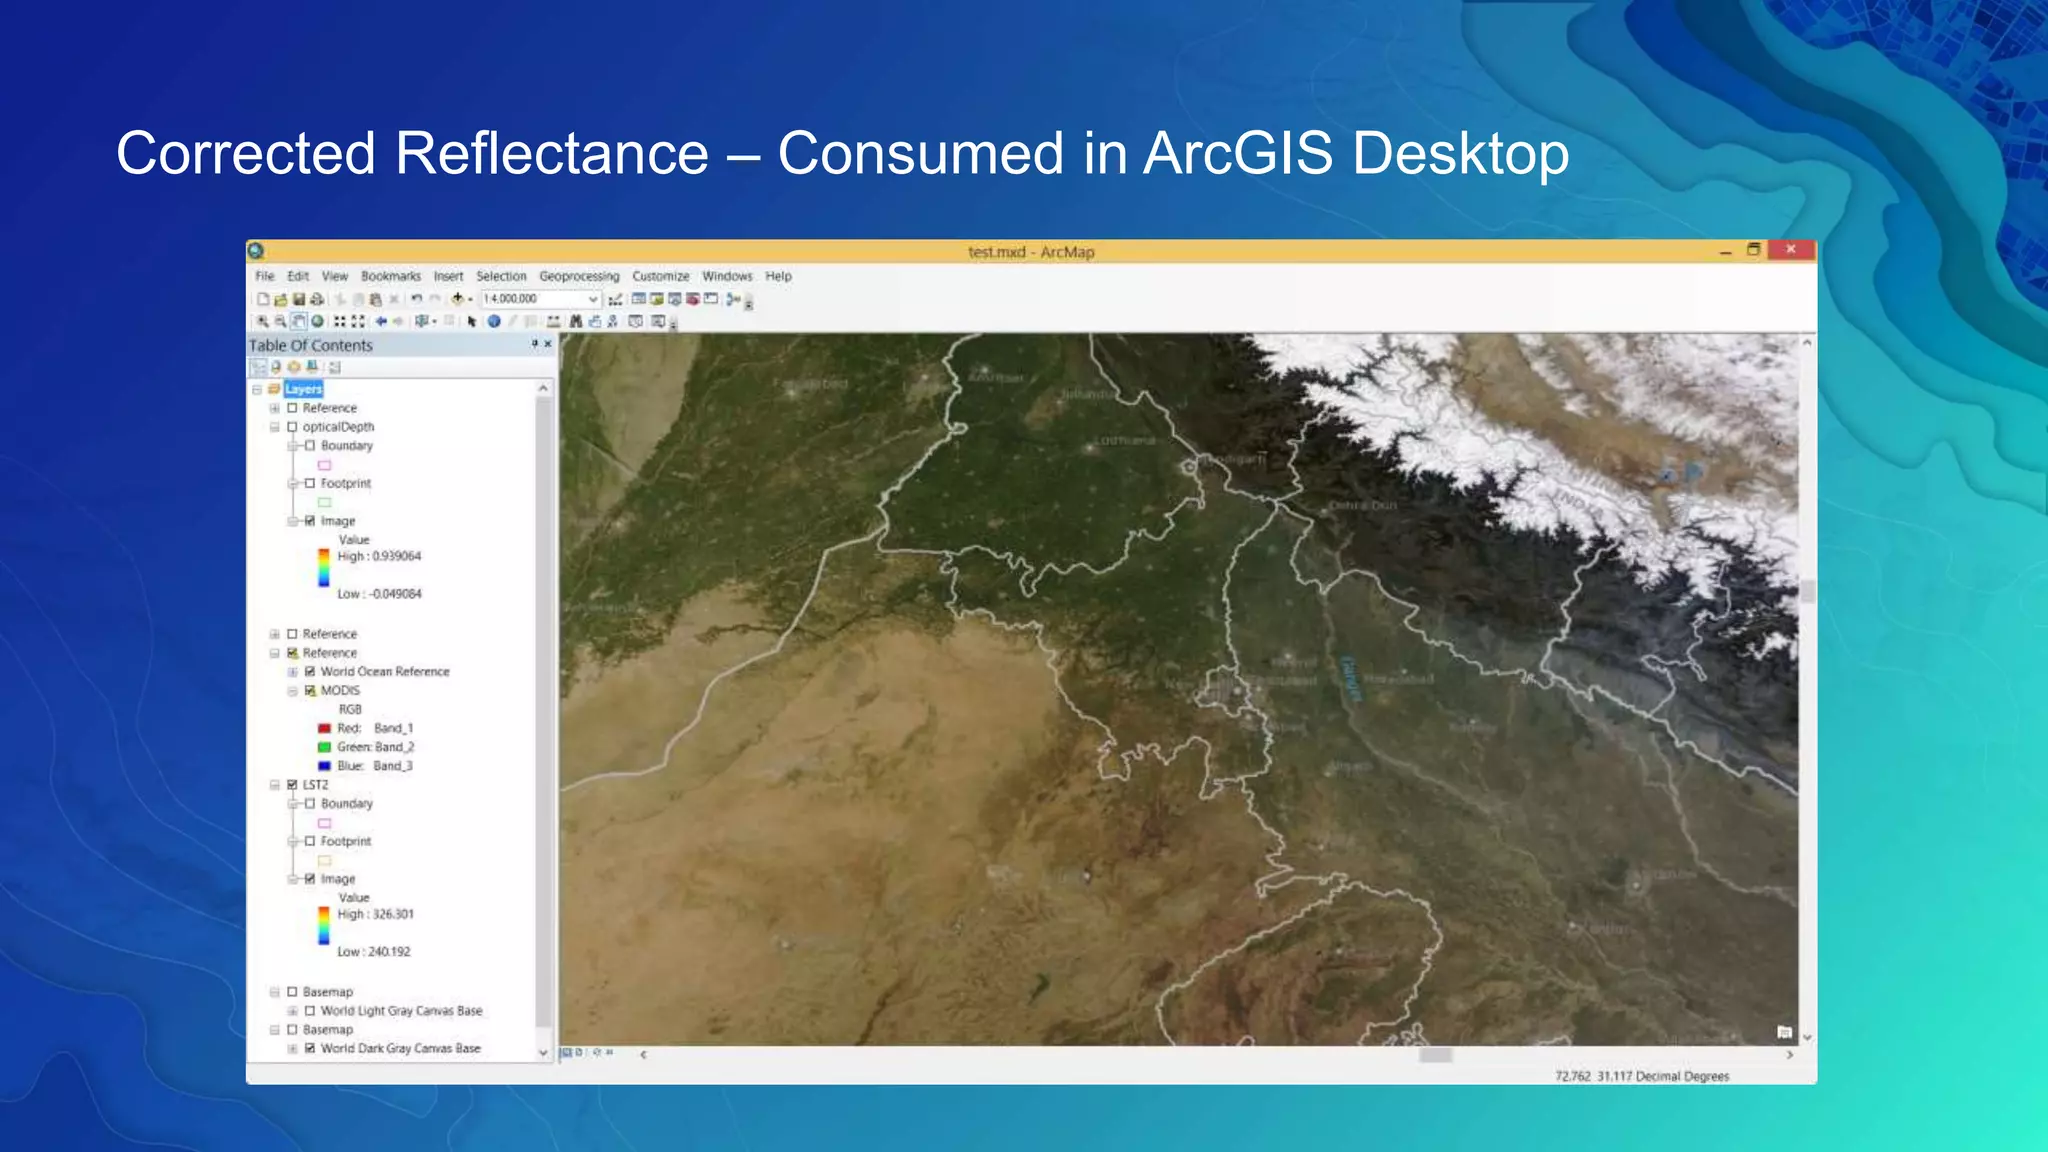
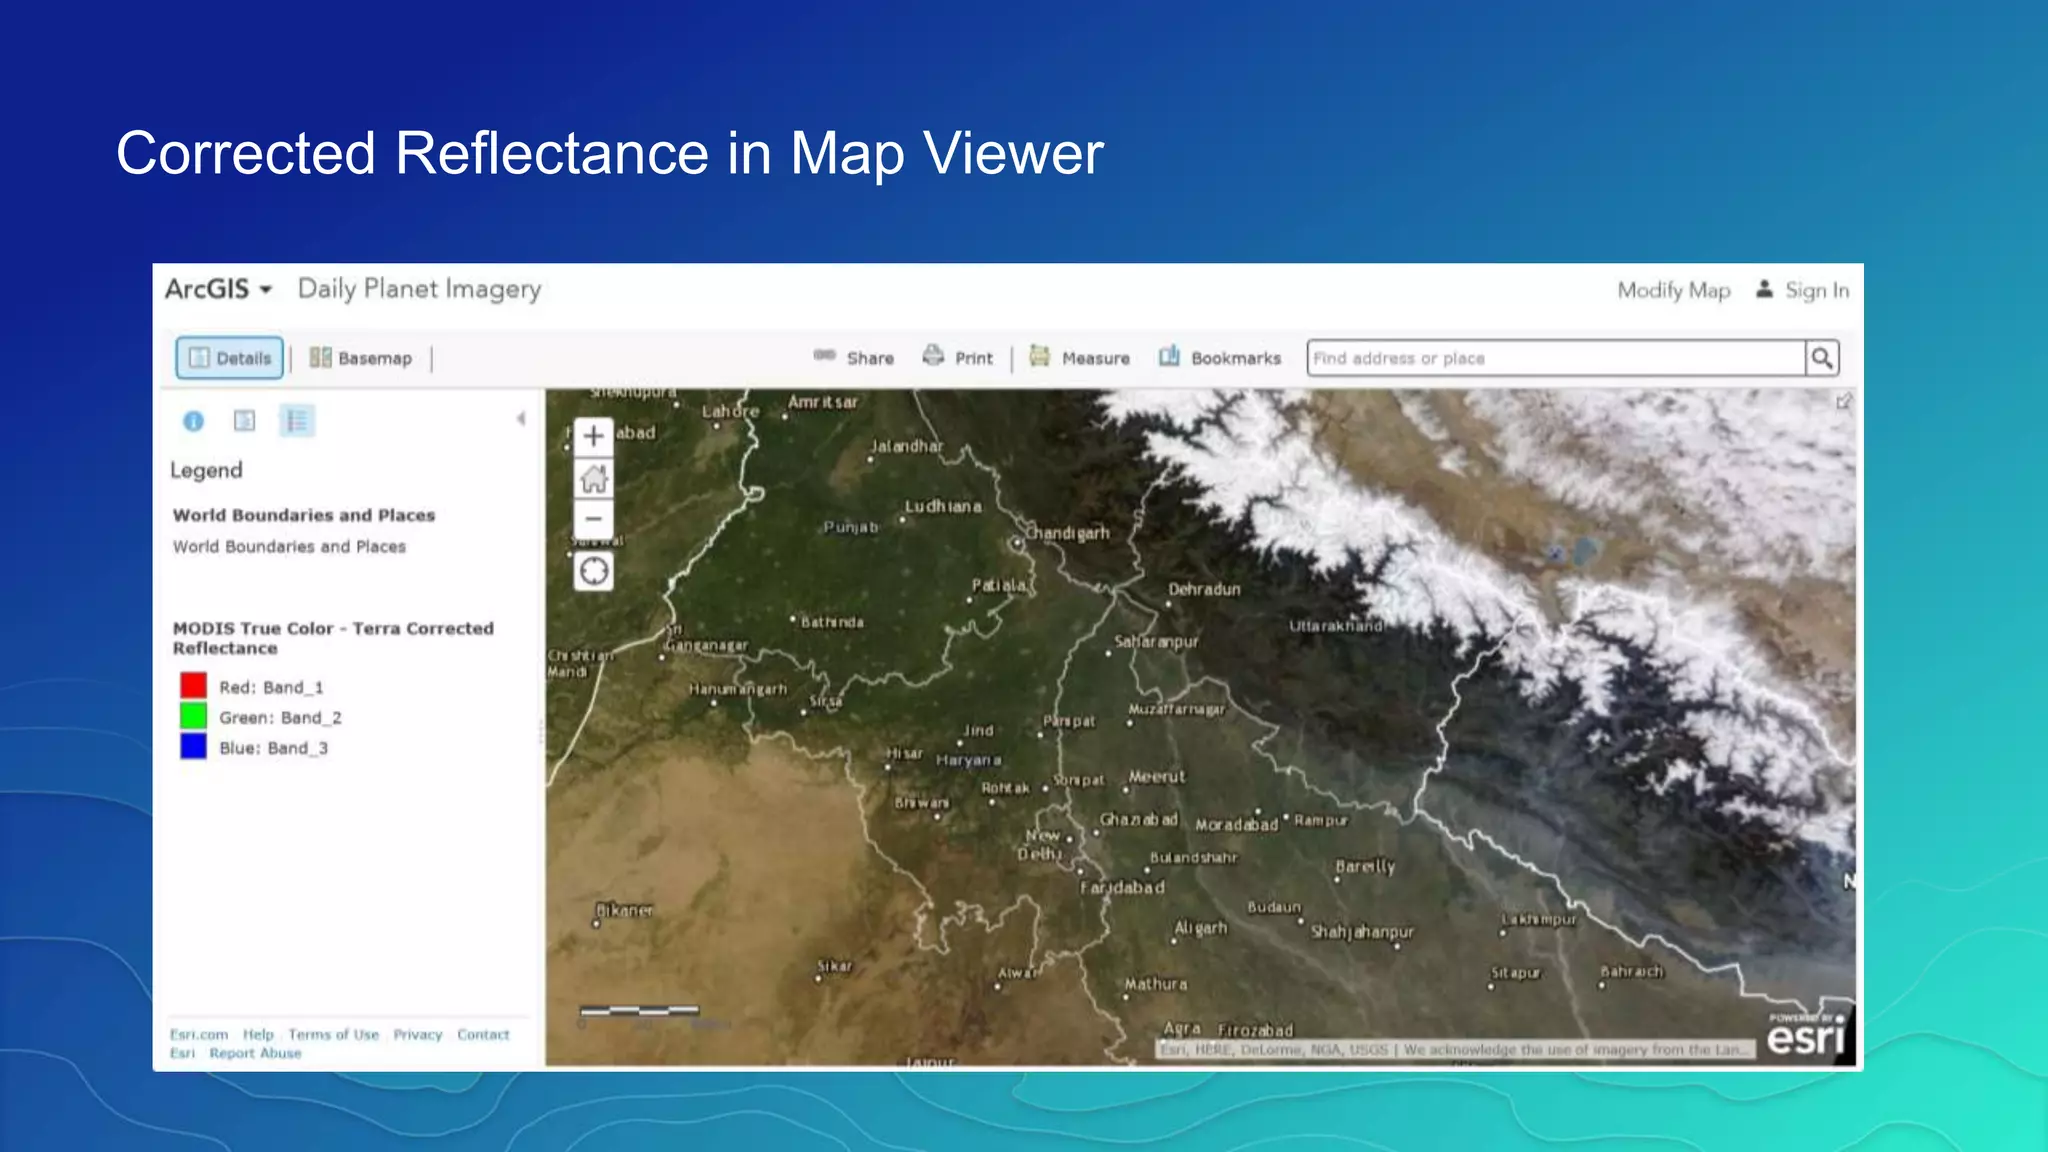
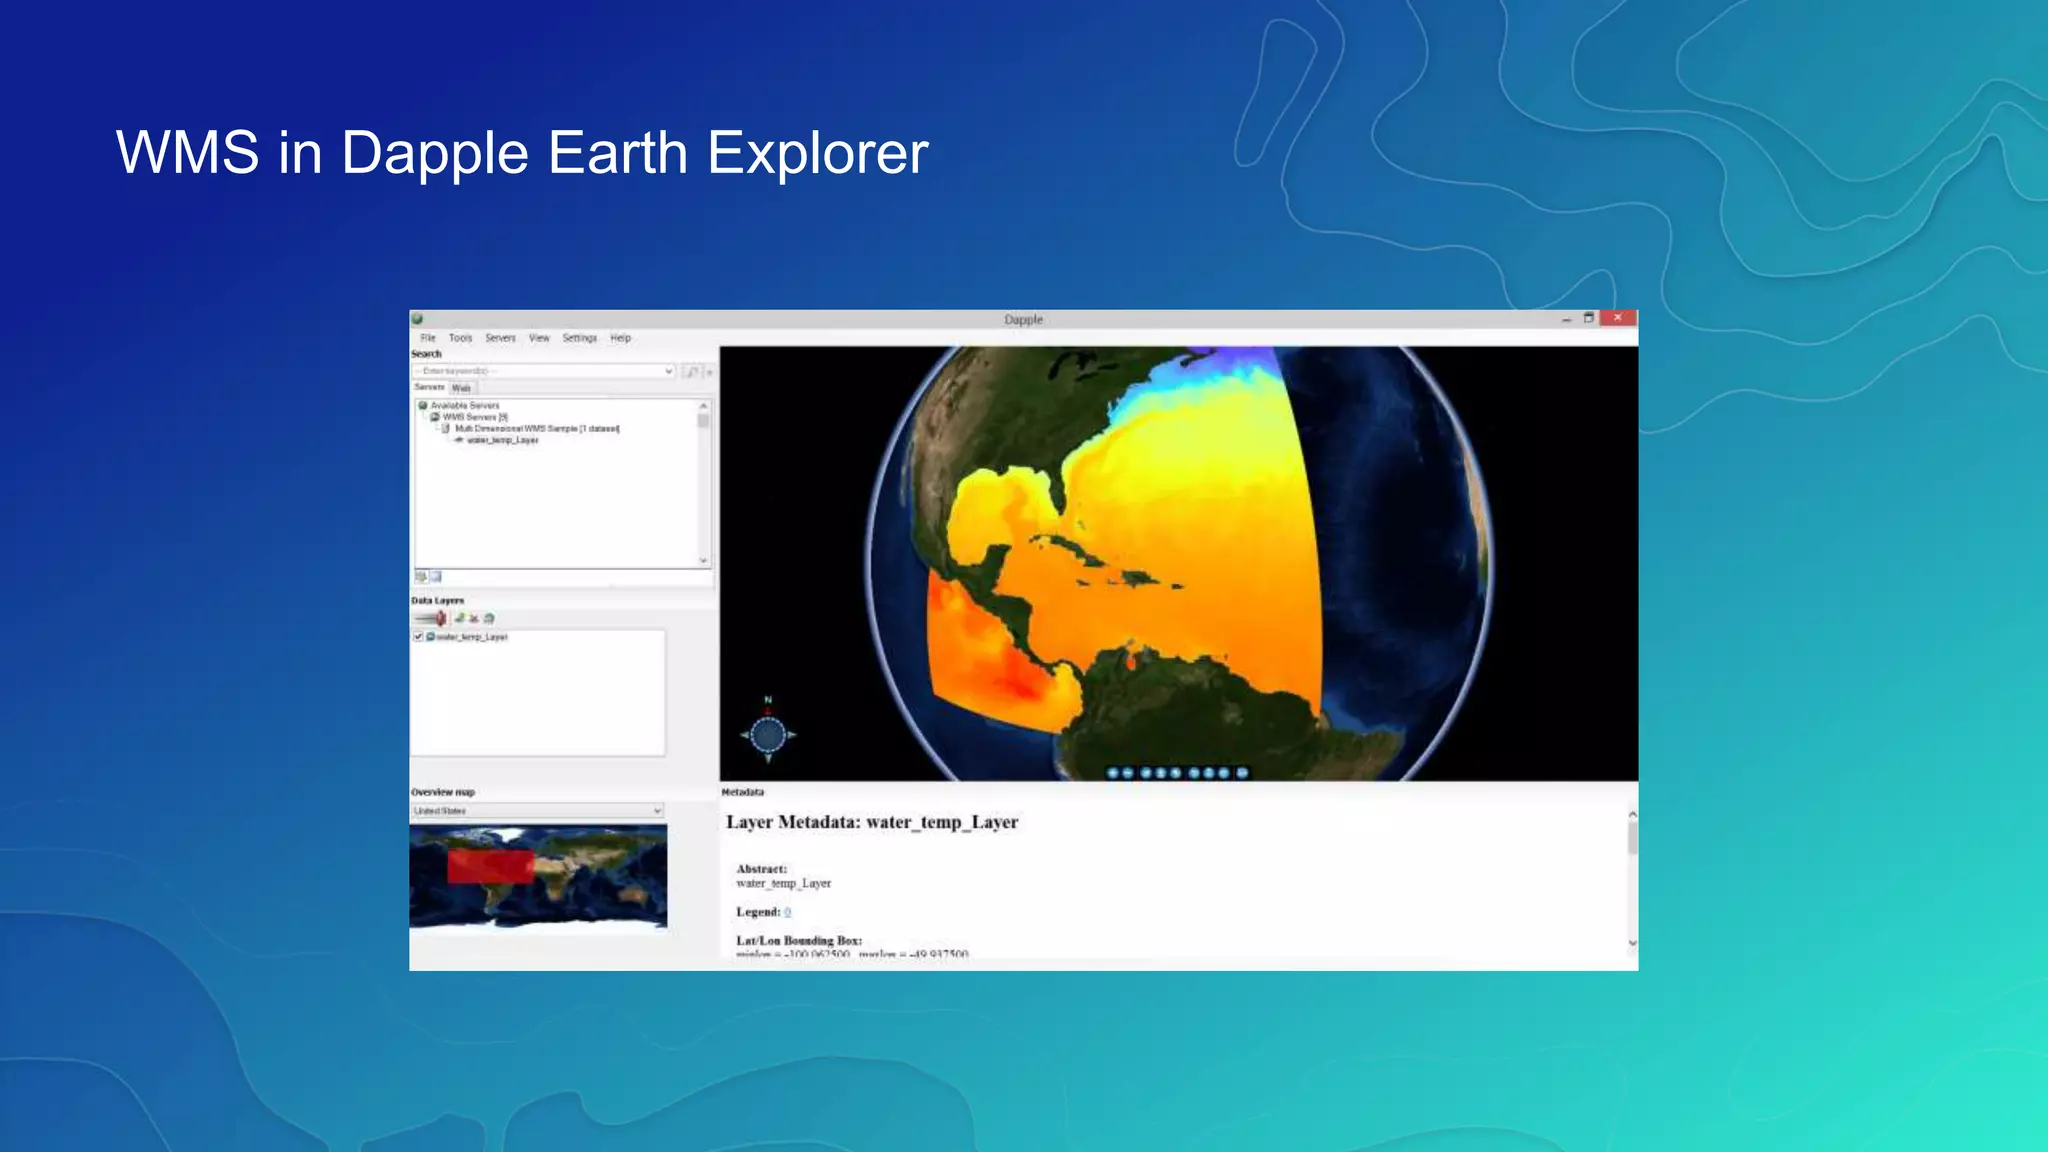
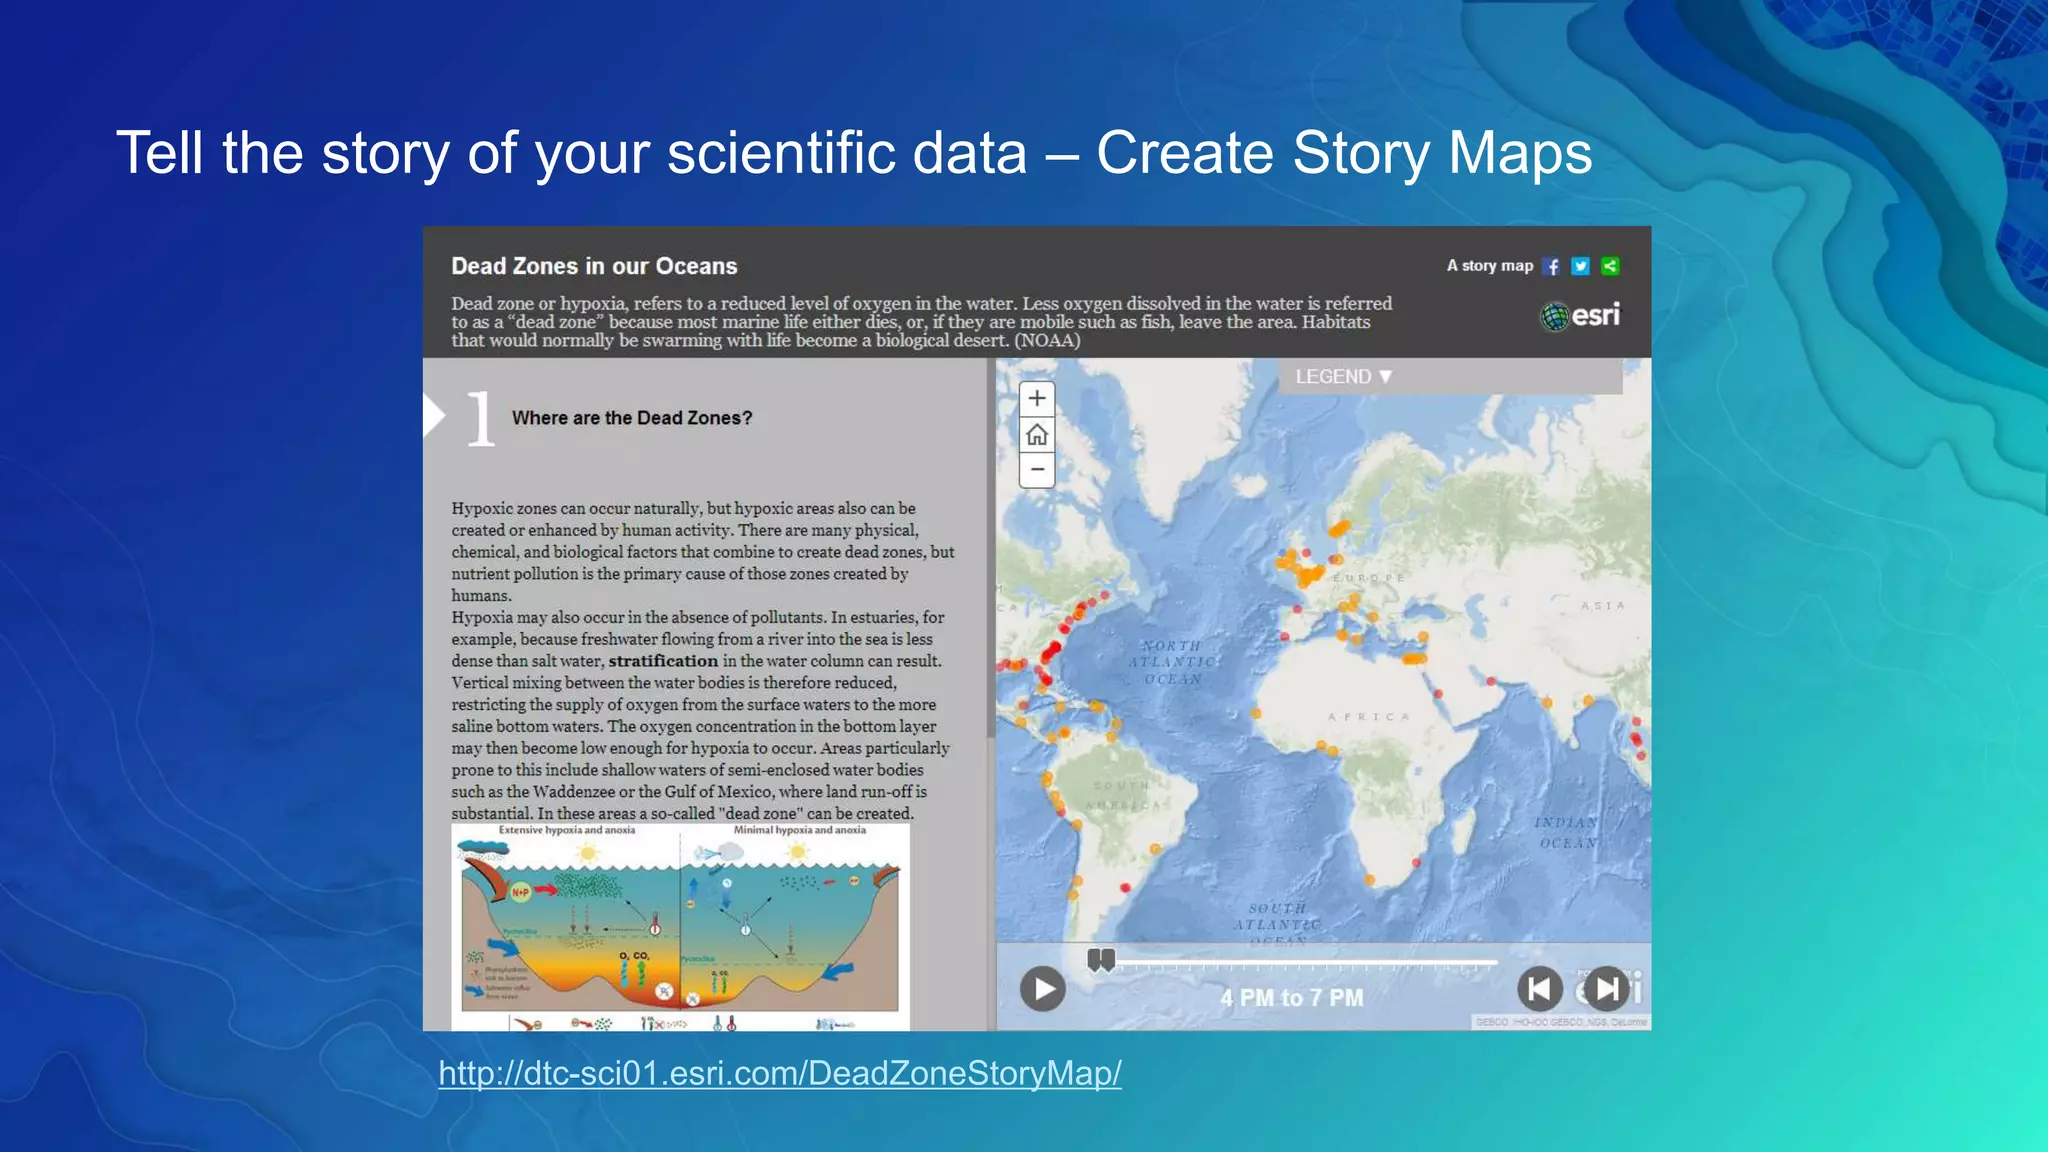
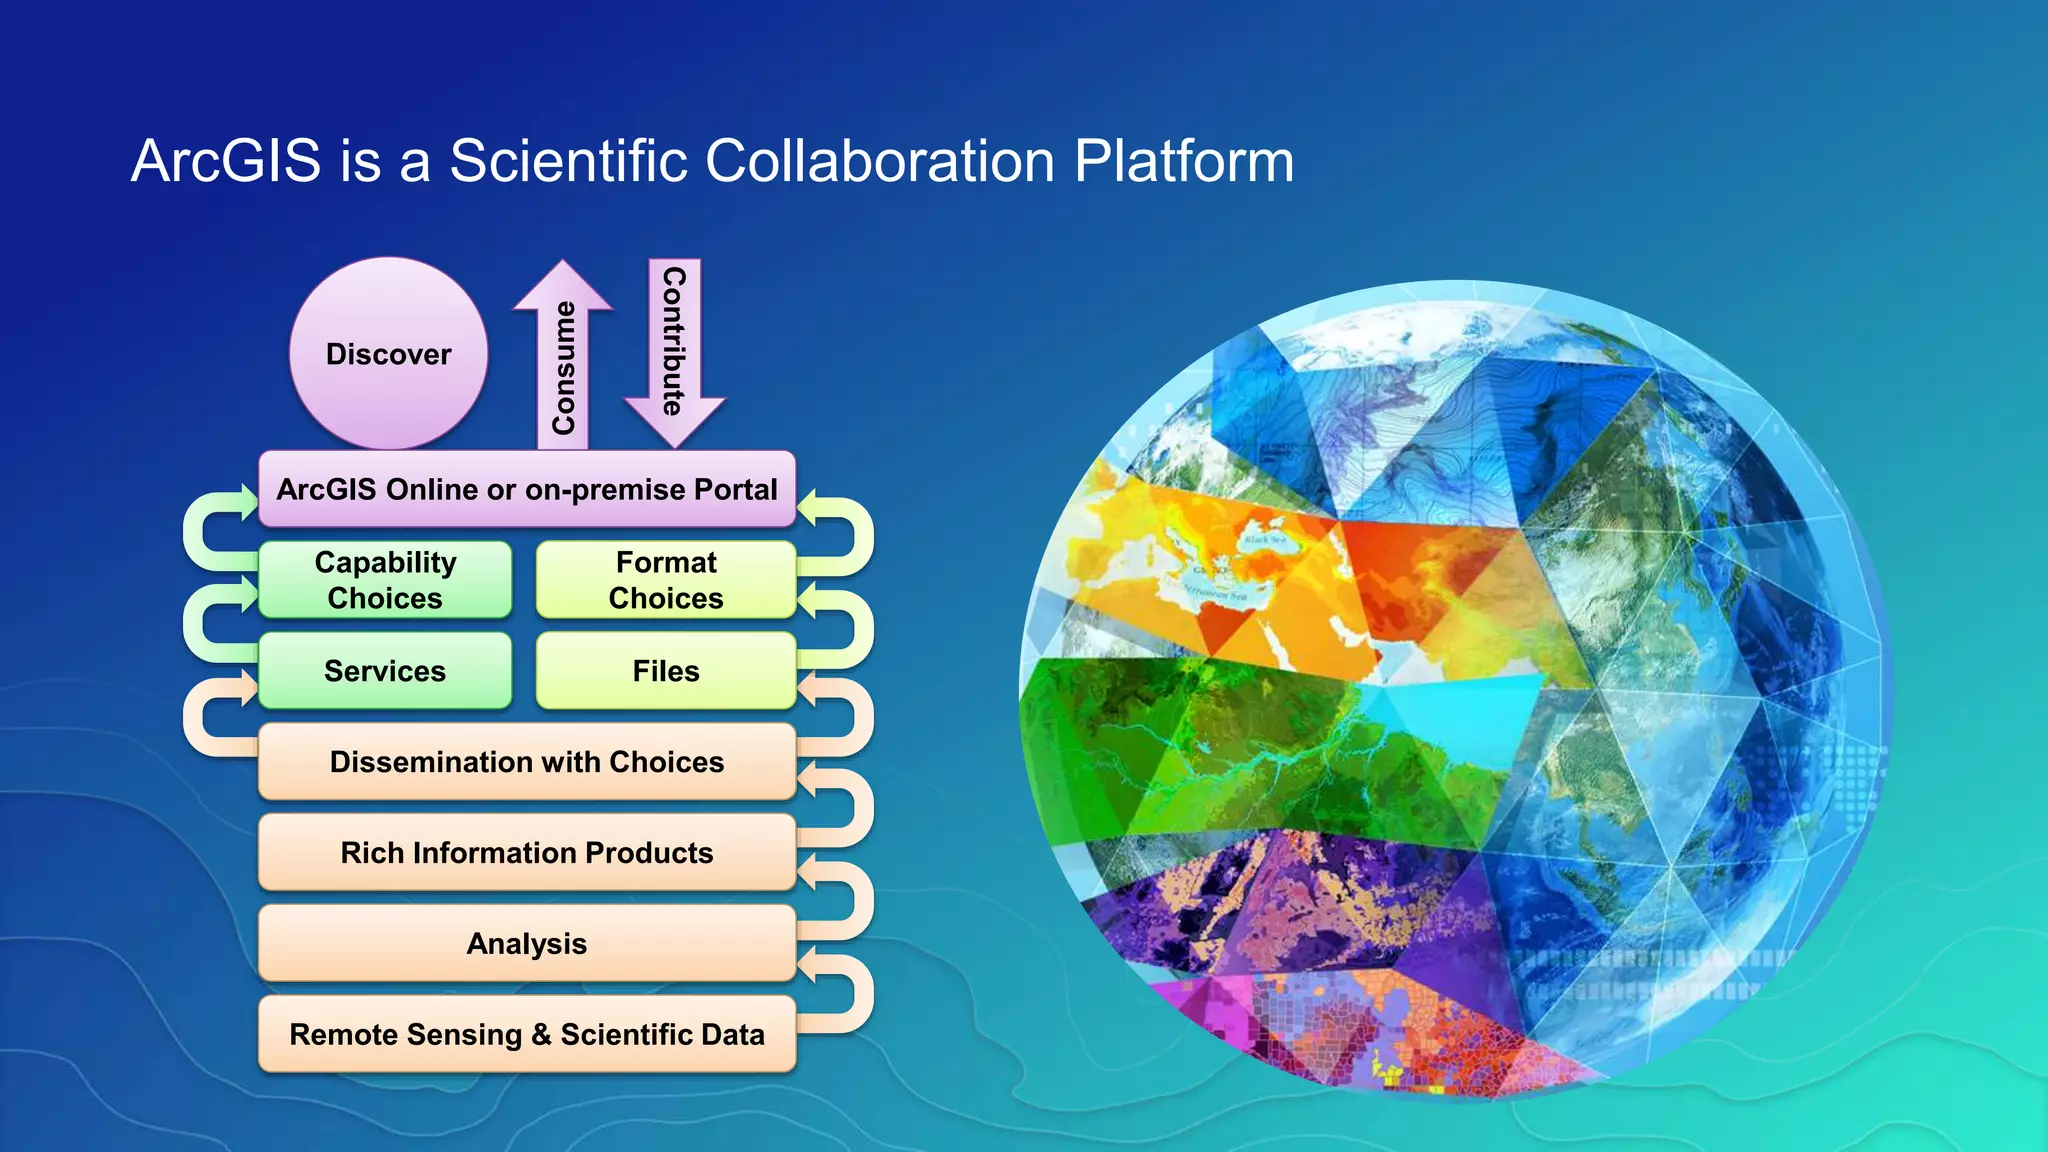
Multidimensional Scientific Data
in ArcGIS
Nawajish Noman, Christine White
ESIP Summer Meeting 2017 | July 25-28, 2017
Outline
• Part I
- ArcGIS Platform
- Scientific Multidimensional Data
- Ingest and Data Management
• Part II
- Data Exploration and Visualization
- Analysis
- Extending Analytical Capabilities using Python
• Part III
- Publishing and Sharing Services
- Consuming Services
ArcGIS Development Trends in Capabilities
ArcGIS is Evolving as a Remote
Sensing Software Platform
 Sensor Support
EO, RADAR, LiDAR, FMV,…
 > 80 Formats
HDF, NetCDF, GRIB, NITF
 Image Processing
 Distributed Data & Analytics
 Management and Dissemination
 Web Services and Standards
WMS, WCS, KML,…
ArcGIS 9.2 ArcGIS 9.3 ArcGIS 10 ArcGIS 10.2 ArcGIS 10.3 ArcGIS 10.4 ArcGIS 10.5 Future
CAPABILITIES
Imagery Scientific Data Real-Time Sensors (Streaming and Events)
R&DStaff
Scientific Multidimensional Data
• Stored in netCDF, GRIB, and HDF formats
• Multidimensional
• Ocean data
Sea temperature, salinity, ocean current
• Weather data
Temperature, humidity, wind
• Land
Soil moisture, NDVI, land cover
ArcGIS
direct ingest
data
management
visualizationanalysis
share
Scientific Data in ArcGIS - Vision
Challenges
variety of formats
volume & velocity
redundancy
portability
scalability
reproducibility
integration
standards
accessibility
Analyze ShareManage
• Data is represented as
• Raster
• Feature
• Table
• Direct read
• Exports GIS data to netCDF
Representing Scientific Data in ArcGIS
• Directly reads netCDF file using
- Make NetCDF Raster Layer
- Make NetCDF Feature Layer
- Make NetCDF Table View
• Ingest OPeNDAP Service
- Output dynamic multidimensional raster
- Support Sub-setting
• Scientific data formats are supported in mosaic dataset
- netCDF
- HDF
- GRIB
Ingesting Scientific data in ArcGIS
Climate and Forecast (CF) Convention
http://cf-pcmdi.llnl.gov/
Initially developed for
• Climate and forecast data
• Atmosphere, surface and ocean model-generated data
• Also for observational datasets
• CF is now the most widely used conventions for geospatial netCDF data. It
has the best coordinate system handling.
• Current version 1.6
• You can use Compliance checker utility to check a netCDF file.
http://cf-pcmdi.llnl.gov/conformance/compliance-checker/
CF Convention
What about Aggregation?
• Create a seamless multi-dimensional cube from
- files representing different regions
- files representing different time steps/slices
• Mosaic dataset supports multiple files and variables, normalize time and depth
Tabular View
Tabular view of items in a multivariate multidimensional mosaic dataset
Raste
r
Shape Variable StdTime StdZ
… … Temperature 3/22/2016 -10
… … Temperature 3/23/2016 -10
… … Temperature 3/24/2016 -10
… … Salinity 3/22/2016 -10
… … Salinity 3/23/2016 -10
… … Salinity 3/24/2016 -10
… … Temperature 3/22/2016 -20
… … Temperature 3/23/2016 -20
… … … … …
• Supports netCDF, HDF and GRIB
- Spatial Aggregation
- Temporal Aggregation
- On-the-fly analysis
• Serve as Multidimensional
- Image Service
- Map Service
- WMS
• Supports direct ingest
• Eliminates data conversion
• Eliminates data processing
• Improves workflow performance
• Integrates with service oriented architecture
Scientific data support in Mosaic Dataset
MODIS: Land Surface Temperature
Behaves the same as any layer or table
• Display
- Same display tools for raster and feature layers will work on multi-
dimensional raster and feature layers.
• Graphing
- Driven by the table just like any other chart.
• Animation
- Multi-dimensional data can be animated through time dimension.
• Analysis Tools
- Will work just like any other raster layer, feature layer, or table. (e.g.
create buffers around points, reproject rasters, query tables, etc.)
Using Scientific Data in ArcGIS
• Slicing
• Temporal animation using Time Slider
• Dimensional animation using Range Slider
• Predefined renderer
Visualization of Scientific Data
Time = 1
141 241 341
131 231 331
121 221 321
111 211 311
441
431
421
411
142 242 342
132 232 332
122 222 322
112 212 312
442
432
422
412
143 243 343
133 233 333
123 223 323
113 213 313
443
433
423
413
Y
X
Time
Changing Time Slice
Animating through Time using Time Slider
Animating through Depth using Range Slider
• New Vector Field renderer for raster
- Supports U-V and Magnitude-direction
- Dynamic thinning
- On-the-fly vector calculation
• Eliminates raster to feature conversion
• Eliminates data processing
• Improves workflow performance
Visualization of Raster as Vectors
• Hundreds of analytical tools available for raster, features, and table
• Temporal Modeling
- Looping and iteration in ModelBuilder and Python
Spatial and Temporal Analysis
• Several analytical functions are available out of the box
• Functions are chained together to create complex model
• Used to perform on-the-fly analysis
• Extend analytical capability using Python Raster Function
On-the-Fly Processing using Raster Functions
• netCDF4-python is included in 10.3/Pro
• Read and write netCDF file
• Conversion time values to date
• Multi-file aggregasion
• Compression
• SciPy
• Python Raster Function
https://www.unidata.ucar.edu/software/netcdf/workshops/2012/netcdf_python/netcdf4python.pdf
Python Package: netCDF4-Python, SciPy
Desktop Web Device
Online
Content and
Services
Server
multivariate
multidimensional mosaic
dataset
Disseminating
professional
geospatial analysts
• Map Service (supports WMS)
- Makes maps available to the web.
• Image Service (supports WMS)
- Provides access to raster data through a web service.
• Geoprocessing Service
- Exposes the analytic capability of ArcGIS to the web.
Sharing / WMS Support (for multi-dimensions)
ArcGIS Online: The Living Atlas
www.arcgis.com
Services of Scientific Data
• MODIS data
- MODIS land cover 2000-2011
- MODIS Vegetation Analysis
- MODIS Greenland Sea Ice
• Live NOAA wind service
• NASA Global Land Data Assimilation (GLDS)
- Soil moisture
- Evapotranspiration
- Snow pack
• More
Online Imagery content that can be directly used:
NASA Global Imagery Browse Services (GIBS)
Consuming Scientific Data Services
• ArcGIS Desktop/Pro/Server
• Web Map Viewer
• Web Applications
• Story maps
• Operational Dashboard
Corrected Reflectance – Consumed in ArcGIS Desktop
Corrected Reflectance in Map Viewer
WMS in Dapple Earth Explorer
Tell the story of your scientific data – Create Story Maps
http://dtc-sci01.esri.com/DeadZoneStoryMap/
ArcGIS is a Scientific Collaboration Platform
Consume
Contribute
Discover
Remote Sensing & Scientific Data
Analysis
Rich Information Products
Dissemination with Choices
FilesServices
Capability
Choices
Format
Choices
ArcGIS Online or on-premise Portal
Multidimensional Scientific Data in ArcGIS

Multidimensional Scientific Data in ArcGIS

  • 1.
    Multidimensional Scientific Data inArcGIS Nawajish Noman, Christine White ESIP Summer Meeting 2017 | July 25-28, 2017
  • 2.
    Outline • Part I -ArcGIS Platform - Scientific Multidimensional Data - Ingest and Data Management • Part II - Data Exploration and Visualization - Analysis - Extending Analytical Capabilities using Python • Part III - Publishing and Sharing Services - Consuming Services
  • 3.
    ArcGIS Development Trendsin Capabilities ArcGIS is Evolving as a Remote Sensing Software Platform  Sensor Support EO, RADAR, LiDAR, FMV,…  > 80 Formats HDF, NetCDF, GRIB, NITF  Image Processing  Distributed Data & Analytics  Management and Dissemination  Web Services and Standards WMS, WCS, KML,… ArcGIS 9.2 ArcGIS 9.3 ArcGIS 10 ArcGIS 10.2 ArcGIS 10.3 ArcGIS 10.4 ArcGIS 10.5 Future CAPABILITIES Imagery Scientific Data Real-Time Sensors (Streaming and Events) R&DStaff
  • 4.
    Scientific Multidimensional Data •Stored in netCDF, GRIB, and HDF formats • Multidimensional • Ocean data Sea temperature, salinity, ocean current • Weather data Temperature, humidity, wind • Land Soil moisture, NDVI, land cover
  • 5.
  • 6.
    Challenges variety of formats volume& velocity redundancy portability scalability reproducibility integration standards accessibility Analyze ShareManage
  • 7.
    • Data isrepresented as • Raster • Feature • Table • Direct read • Exports GIS data to netCDF Representing Scientific Data in ArcGIS
  • 8.
    • Directly readsnetCDF file using - Make NetCDF Raster Layer - Make NetCDF Feature Layer - Make NetCDF Table View • Ingest OPeNDAP Service - Output dynamic multidimensional raster - Support Sub-setting • Scientific data formats are supported in mosaic dataset - netCDF - HDF - GRIB Ingesting Scientific data in ArcGIS
  • 9.
    Climate and Forecast(CF) Convention http://cf-pcmdi.llnl.gov/ Initially developed for • Climate and forecast data • Atmosphere, surface and ocean model-generated data • Also for observational datasets • CF is now the most widely used conventions for geospatial netCDF data. It has the best coordinate system handling. • Current version 1.6 • You can use Compliance checker utility to check a netCDF file. http://cf-pcmdi.llnl.gov/conformance/compliance-checker/ CF Convention
  • 10.
    What about Aggregation? •Create a seamless multi-dimensional cube from - files representing different regions - files representing different time steps/slices • Mosaic dataset supports multiple files and variables, normalize time and depth
  • 11.
    Tabular View Tabular viewof items in a multivariate multidimensional mosaic dataset Raste r Shape Variable StdTime StdZ … … Temperature 3/22/2016 -10 … … Temperature 3/23/2016 -10 … … Temperature 3/24/2016 -10 … … Salinity 3/22/2016 -10 … … Salinity 3/23/2016 -10 … … Salinity 3/24/2016 -10 … … Temperature 3/22/2016 -20 … … Temperature 3/23/2016 -20 … … … … …
  • 12.
    • Supports netCDF,HDF and GRIB - Spatial Aggregation - Temporal Aggregation - On-the-fly analysis • Serve as Multidimensional - Image Service - Map Service - WMS • Supports direct ingest • Eliminates data conversion • Eliminates data processing • Improves workflow performance • Integrates with service oriented architecture Scientific data support in Mosaic Dataset
  • 13.
  • 14.
    Behaves the sameas any layer or table • Display - Same display tools for raster and feature layers will work on multi- dimensional raster and feature layers. • Graphing - Driven by the table just like any other chart. • Animation - Multi-dimensional data can be animated through time dimension. • Analysis Tools - Will work just like any other raster layer, feature layer, or table. (e.g. create buffers around points, reproject rasters, query tables, etc.) Using Scientific Data in ArcGIS
  • 15.
    • Slicing • Temporalanimation using Time Slider • Dimensional animation using Range Slider • Predefined renderer Visualization of Scientific Data
  • 16.
    Time = 1 141241 341 131 231 331 121 221 321 111 211 311 441 431 421 411 142 242 342 132 232 332 122 222 322 112 212 312 442 432 422 412 143 243 343 133 233 333 123 223 323 113 213 313 443 433 423 413 Y X Time Changing Time Slice
  • 17.
    Animating through Timeusing Time Slider
  • 18.
    Animating through Depthusing Range Slider
  • 19.
    • New VectorField renderer for raster - Supports U-V and Magnitude-direction - Dynamic thinning - On-the-fly vector calculation • Eliminates raster to feature conversion • Eliminates data processing • Improves workflow performance Visualization of Raster as Vectors
  • 20.
    • Hundreds ofanalytical tools available for raster, features, and table • Temporal Modeling - Looping and iteration in ModelBuilder and Python Spatial and Temporal Analysis
  • 21.
    • Several analyticalfunctions are available out of the box • Functions are chained together to create complex model • Used to perform on-the-fly analysis • Extend analytical capability using Python Raster Function On-the-Fly Processing using Raster Functions
  • 22.
    • netCDF4-python isincluded in 10.3/Pro • Read and write netCDF file • Conversion time values to date • Multi-file aggregasion • Compression • SciPy • Python Raster Function https://www.unidata.ucar.edu/software/netcdf/workshops/2012/netcdf_python/netcdf4python.pdf Python Package: netCDF4-Python, SciPy
  • 23.
    Desktop Web Device Online Contentand Services Server multivariate multidimensional mosaic dataset Disseminating professional geospatial analysts
  • 24.
    • Map Service(supports WMS) - Makes maps available to the web. • Image Service (supports WMS) - Provides access to raster data through a web service. • Geoprocessing Service - Exposes the analytic capability of ArcGIS to the web. Sharing / WMS Support (for multi-dimensions)
  • 25.
    ArcGIS Online: TheLiving Atlas www.arcgis.com
  • 26.
    Services of ScientificData • MODIS data - MODIS land cover 2000-2011 - MODIS Vegetation Analysis - MODIS Greenland Sea Ice • Live NOAA wind service • NASA Global Land Data Assimilation (GLDS) - Soil moisture - Evapotranspiration - Snow pack • More Online Imagery content that can be directly used:
  • 27.
    NASA Global ImageryBrowse Services (GIBS)
  • 28.
    NASA Global ImageryBrowse Services (GIBS)
  • 29.
    Consuming Scientific DataServices • ArcGIS Desktop/Pro/Server • Web Map Viewer • Web Applications • Story maps • Operational Dashboard
  • 30.
    Corrected Reflectance –Consumed in ArcGIS Desktop
  • 31.
  • 32.
    WMS in DappleEarth Explorer
  • 33.
    Tell the storyof your scientific data – Create Story Maps http://dtc-sci01.esri.com/DeadZoneStoryMap/
  • 34.
    ArcGIS is aScientific Collaboration Platform Consume Contribute Discover Remote Sensing & Scientific Data Analysis Rich Information Products Dissemination with Choices FilesServices Capability Choices Format Choices ArcGIS Online or on-premise Portal