Download to read offline


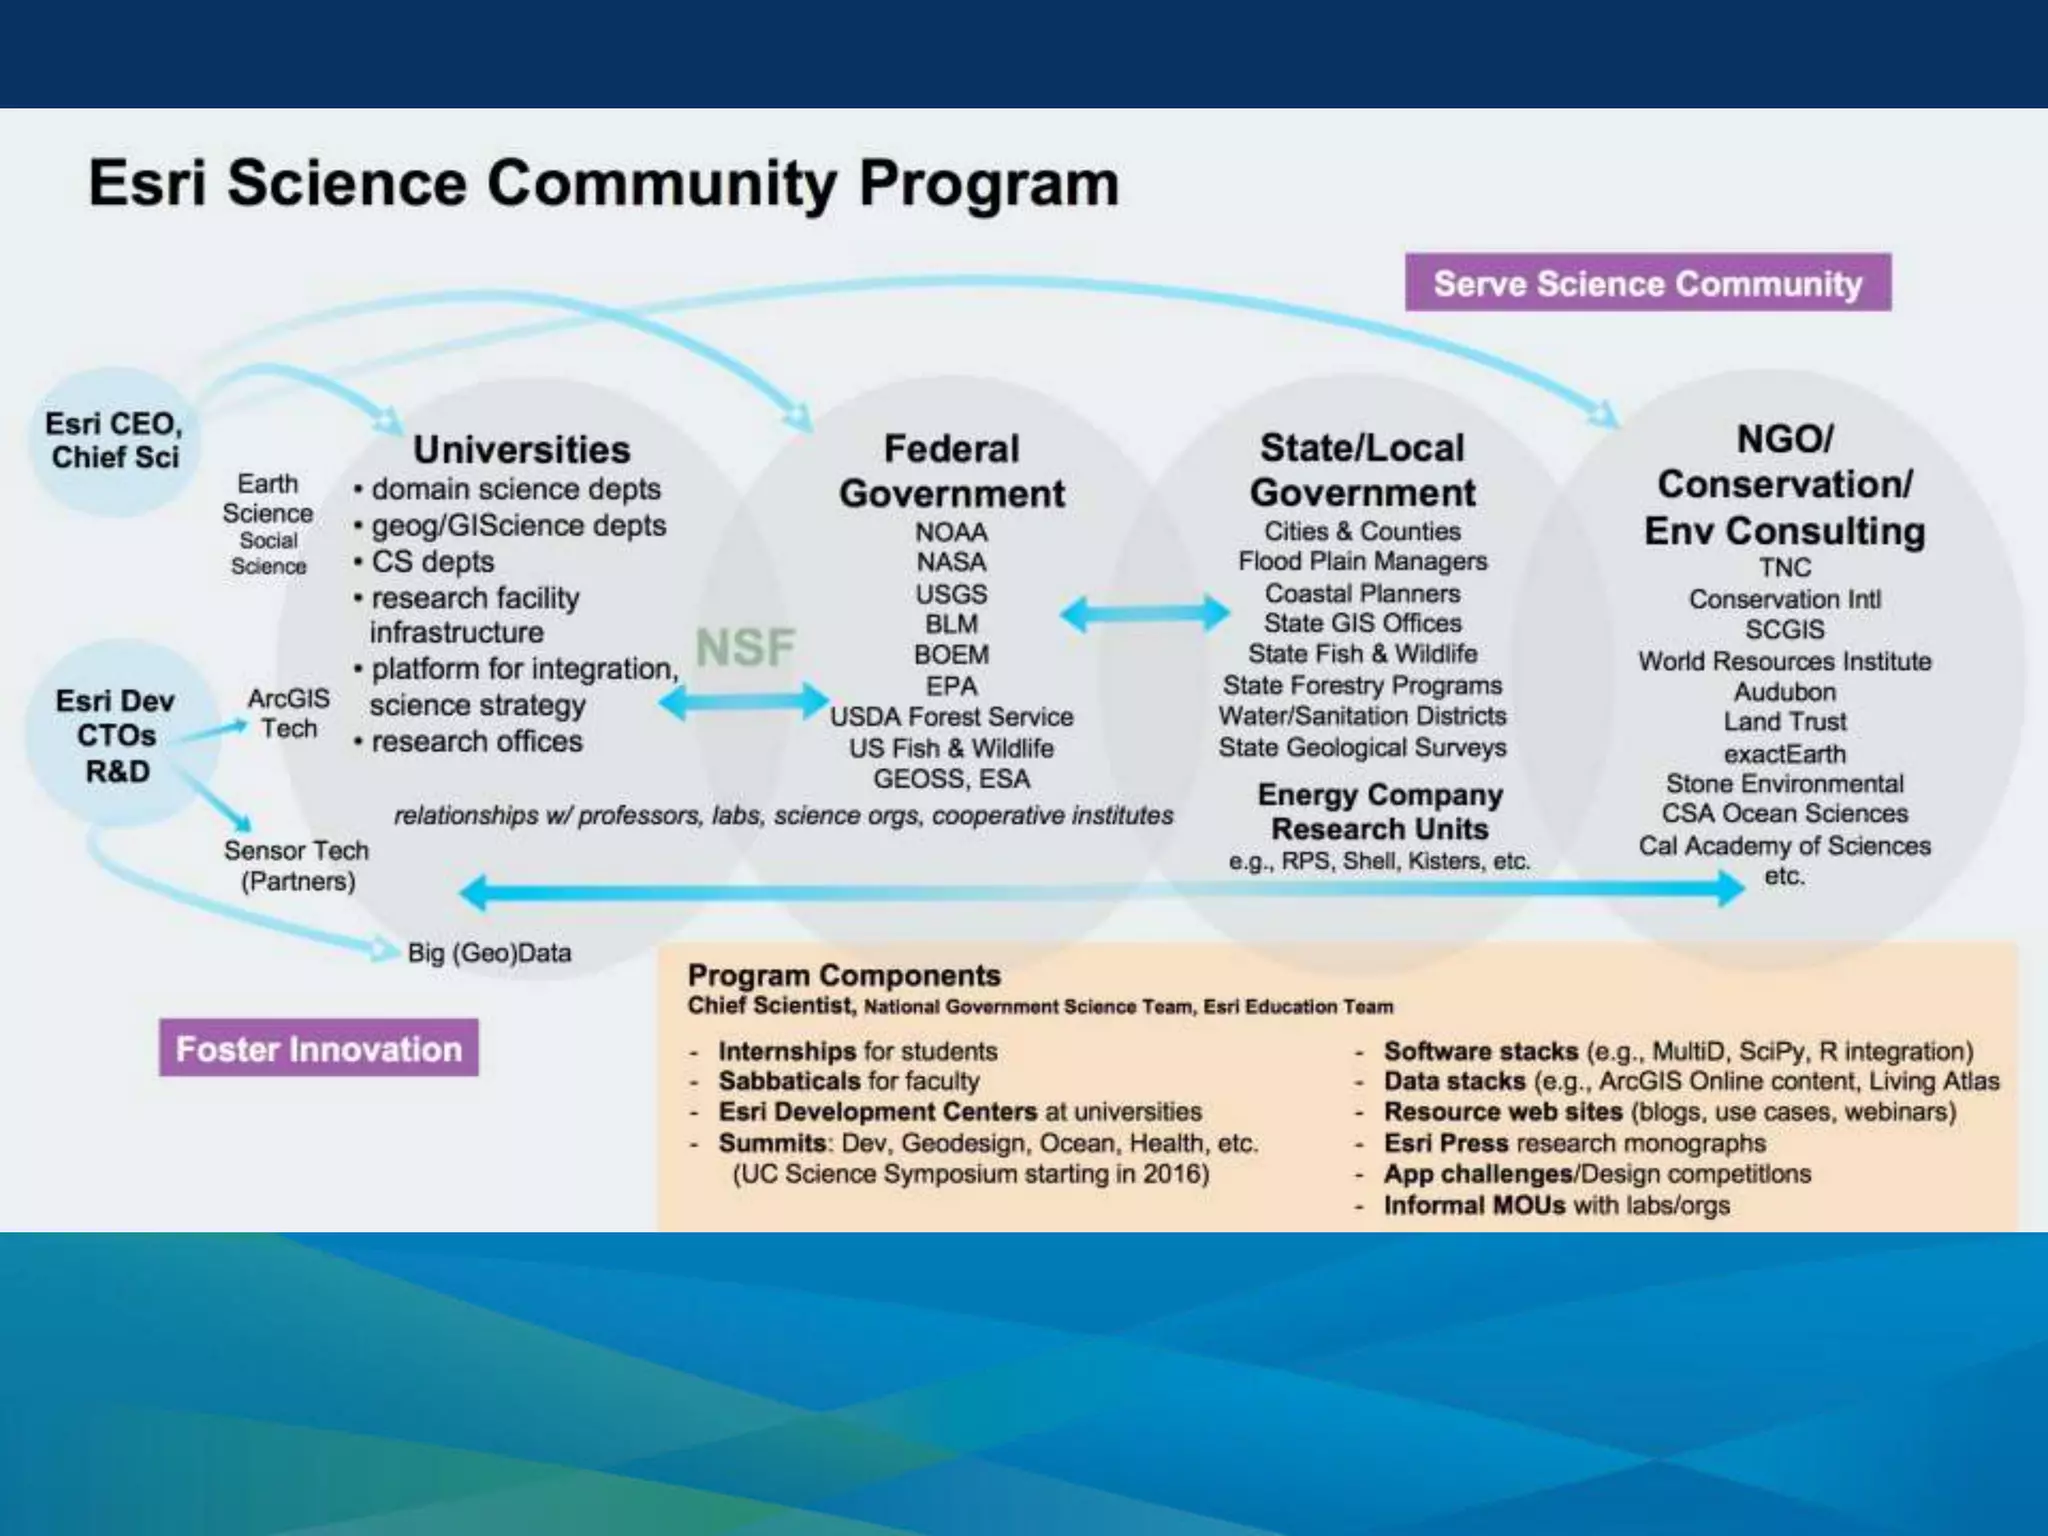
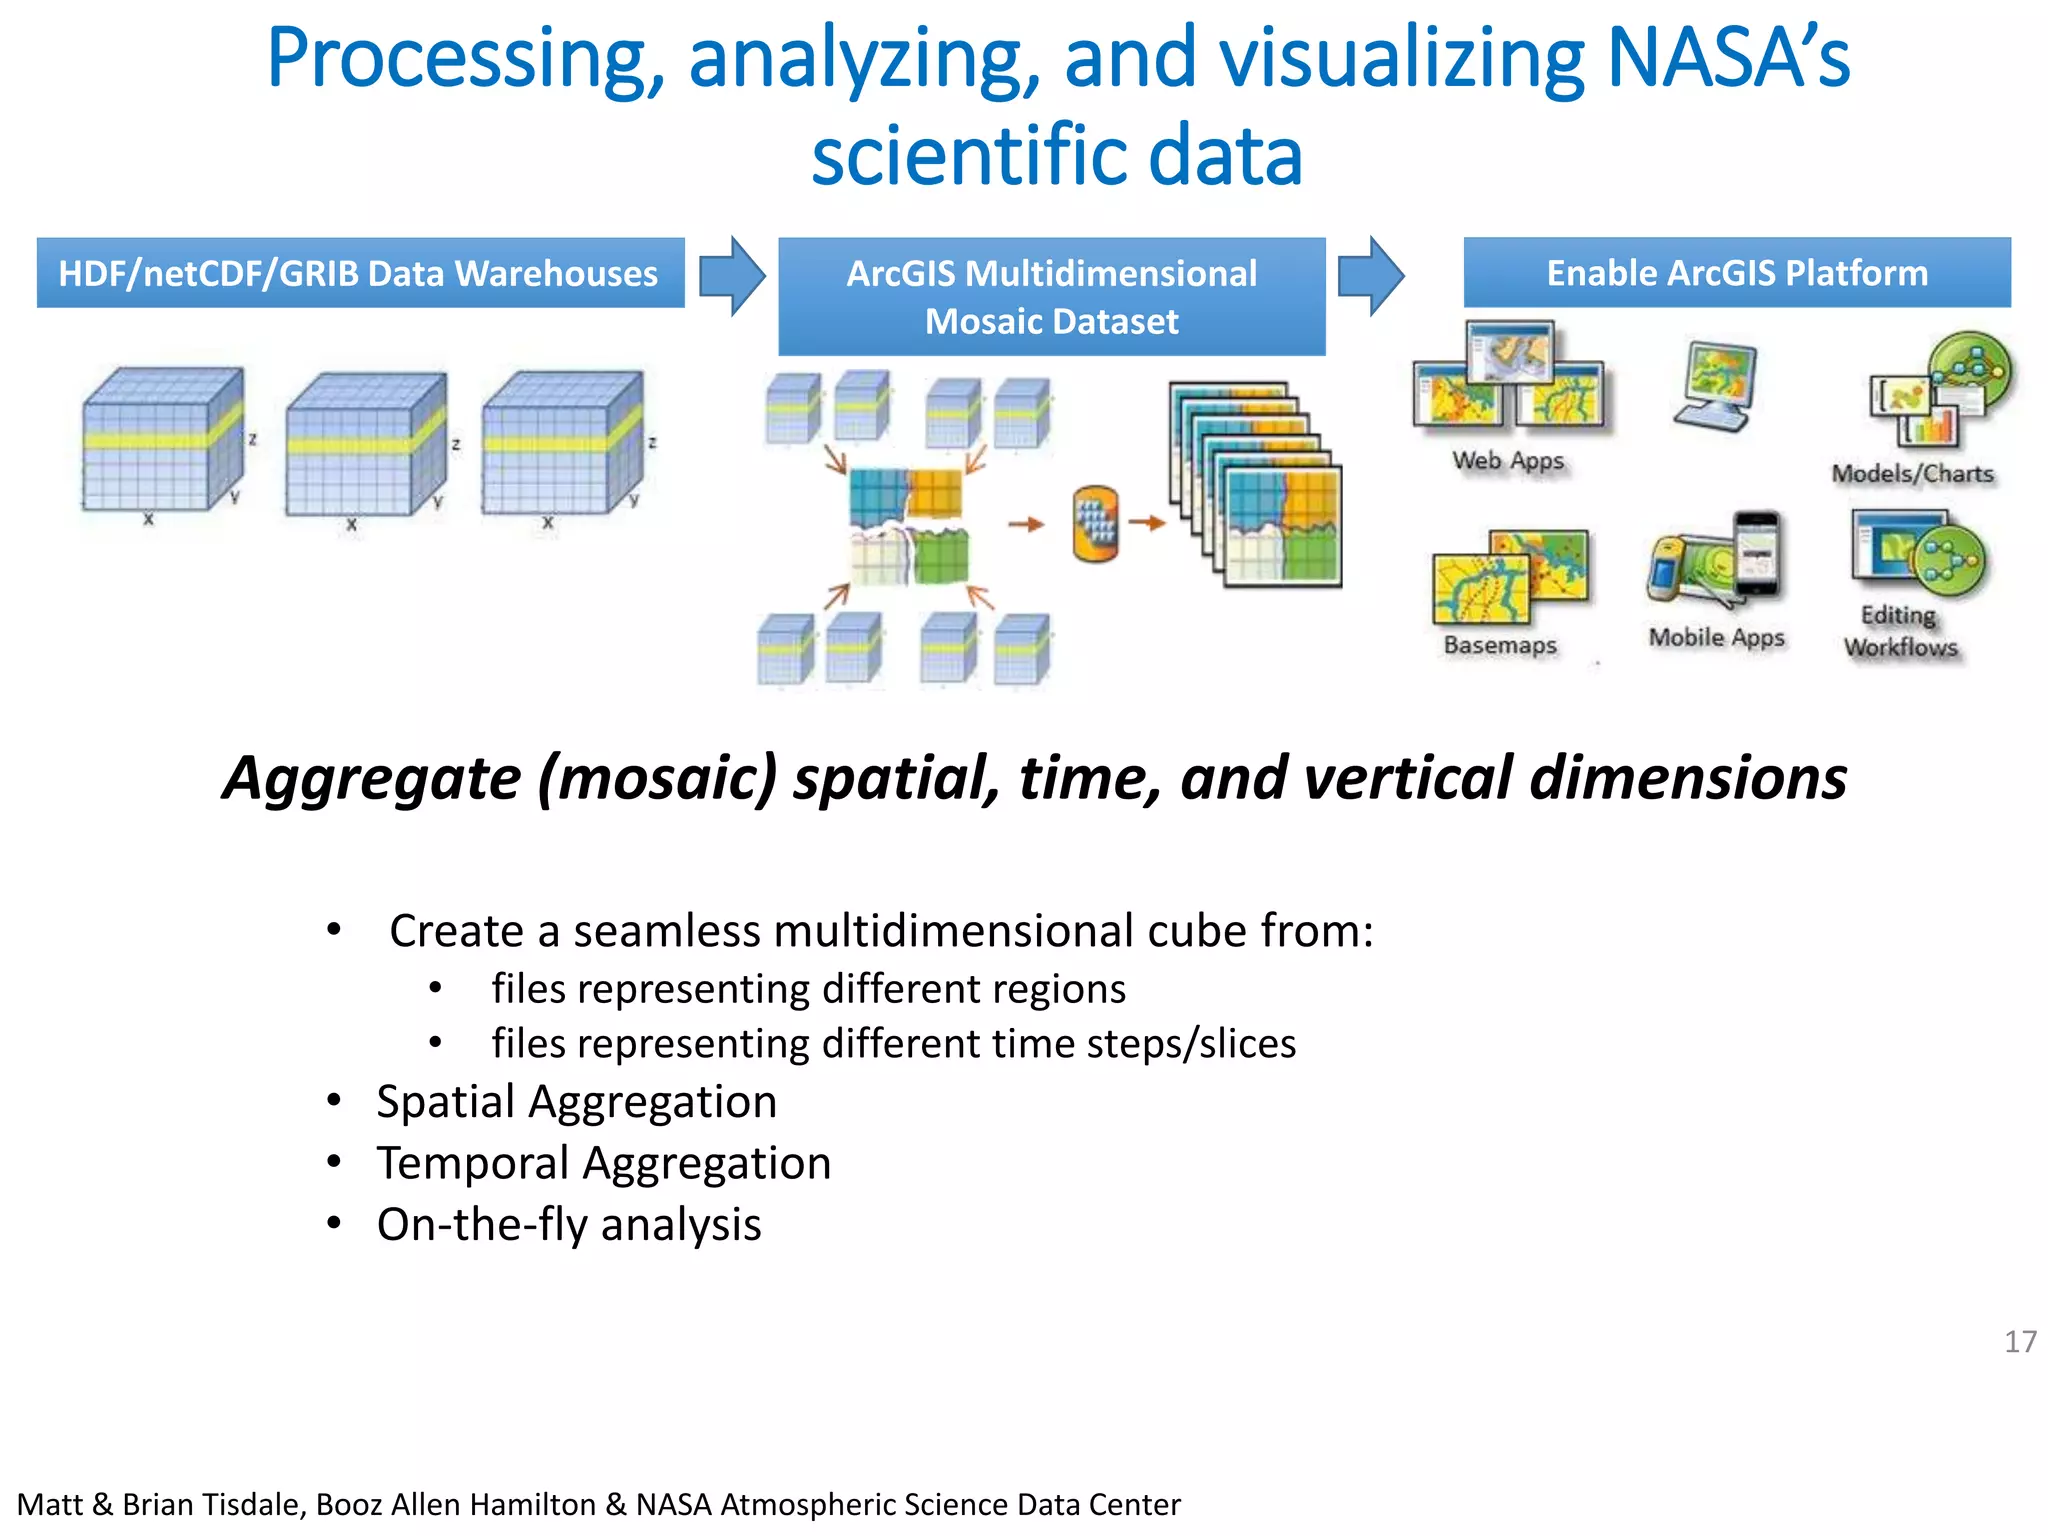


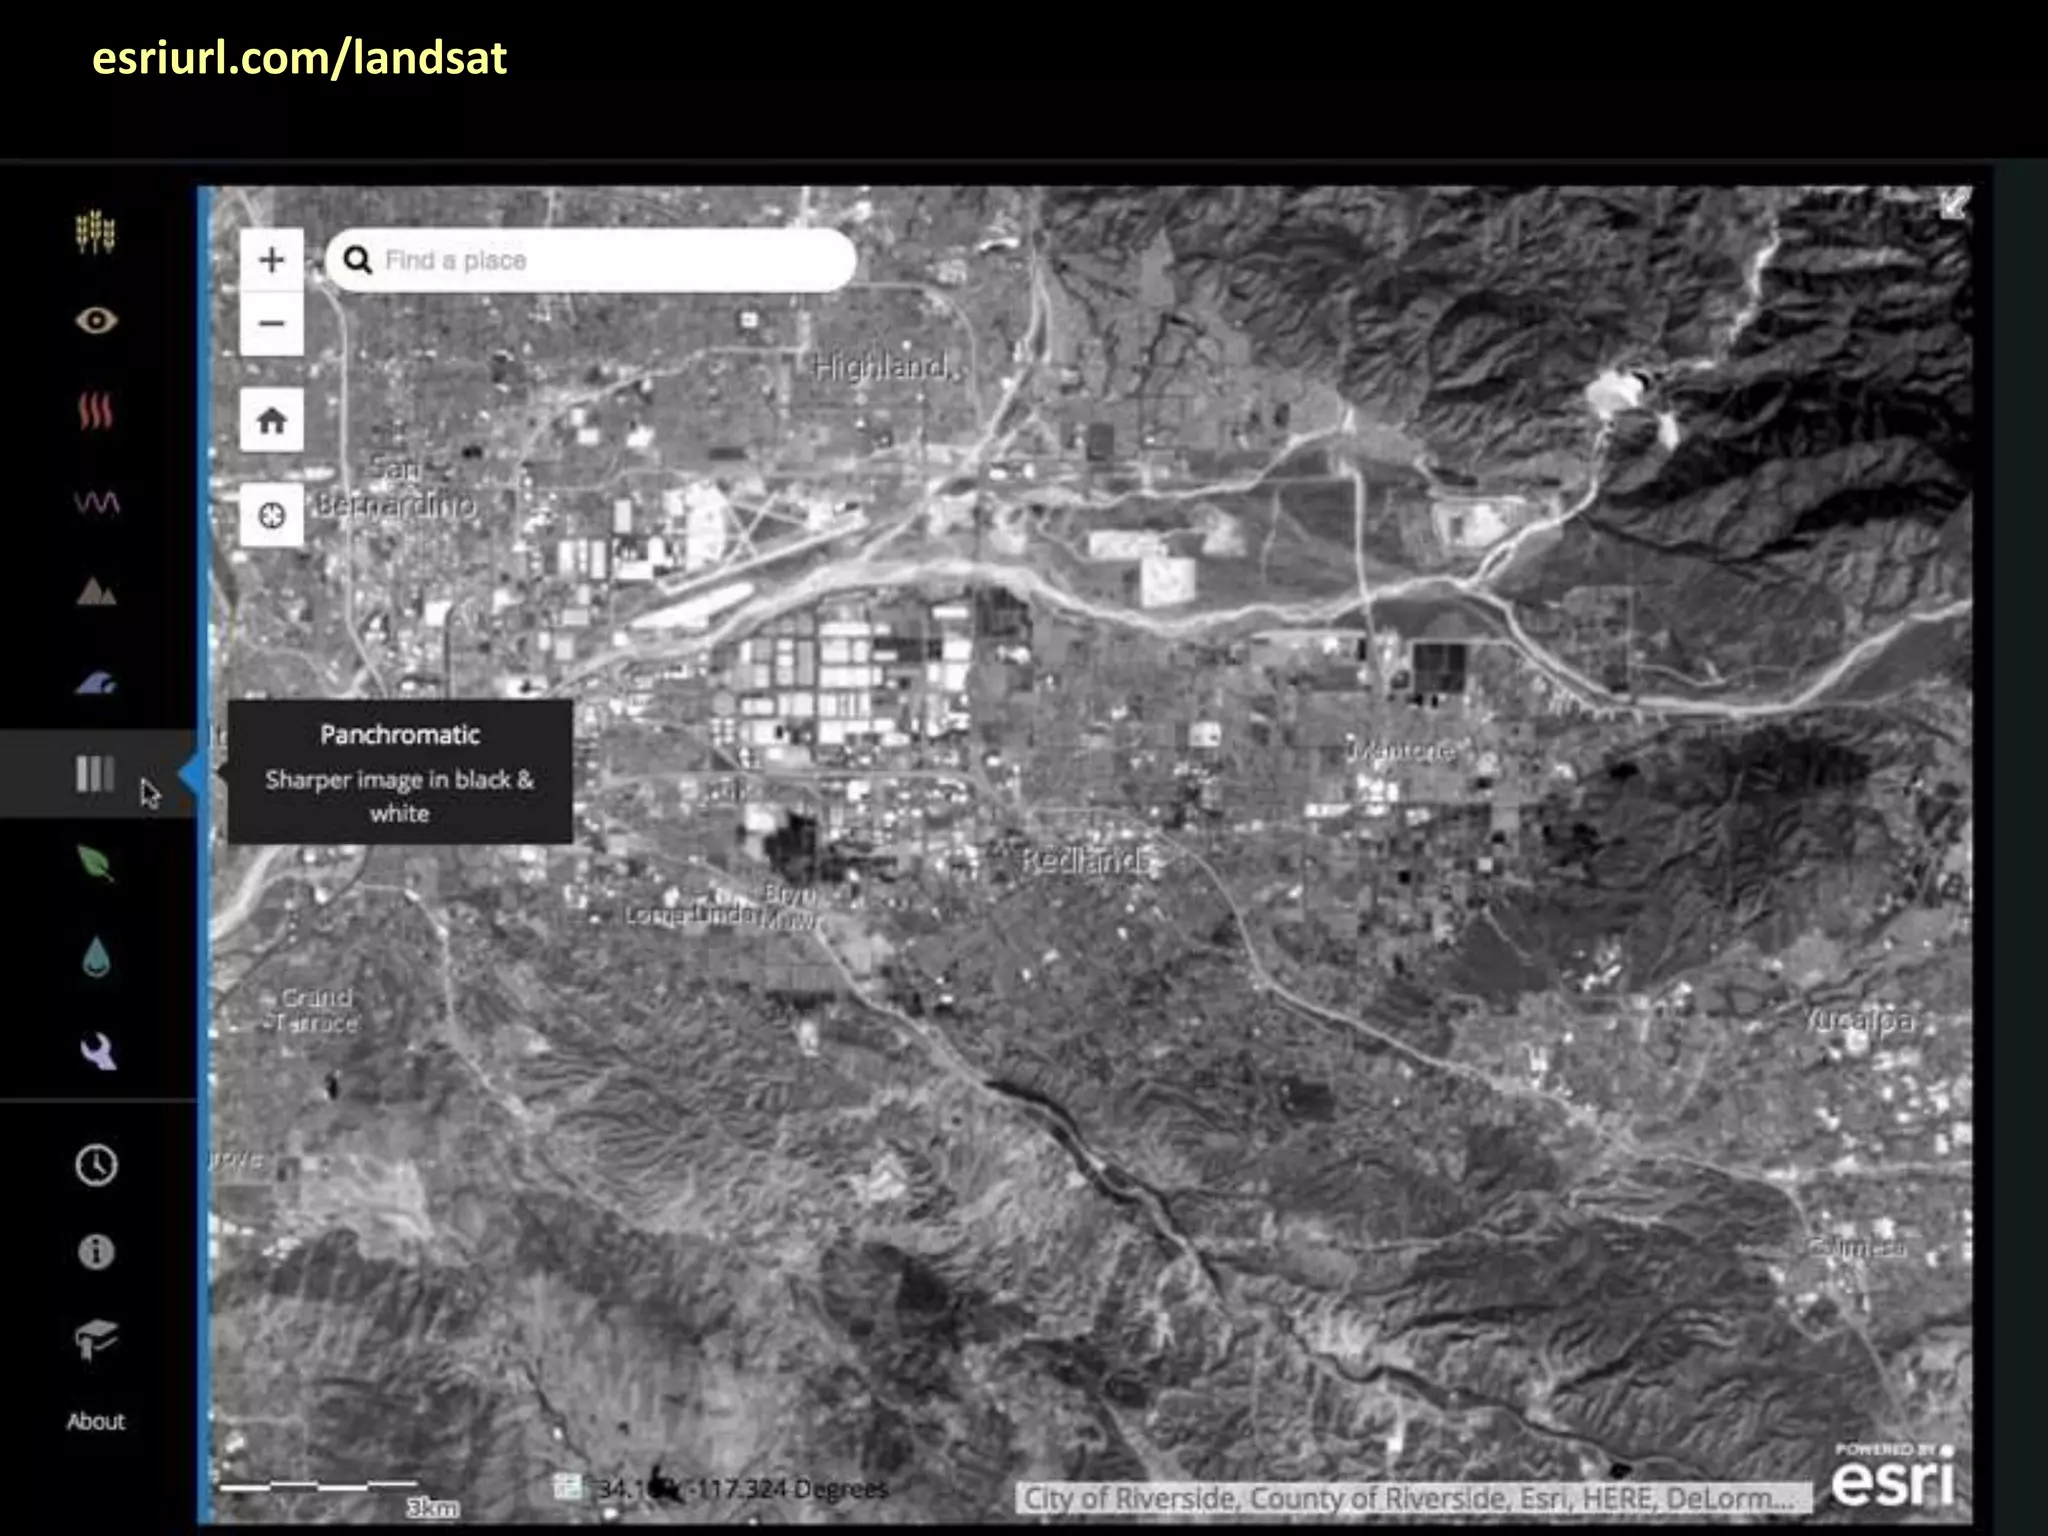


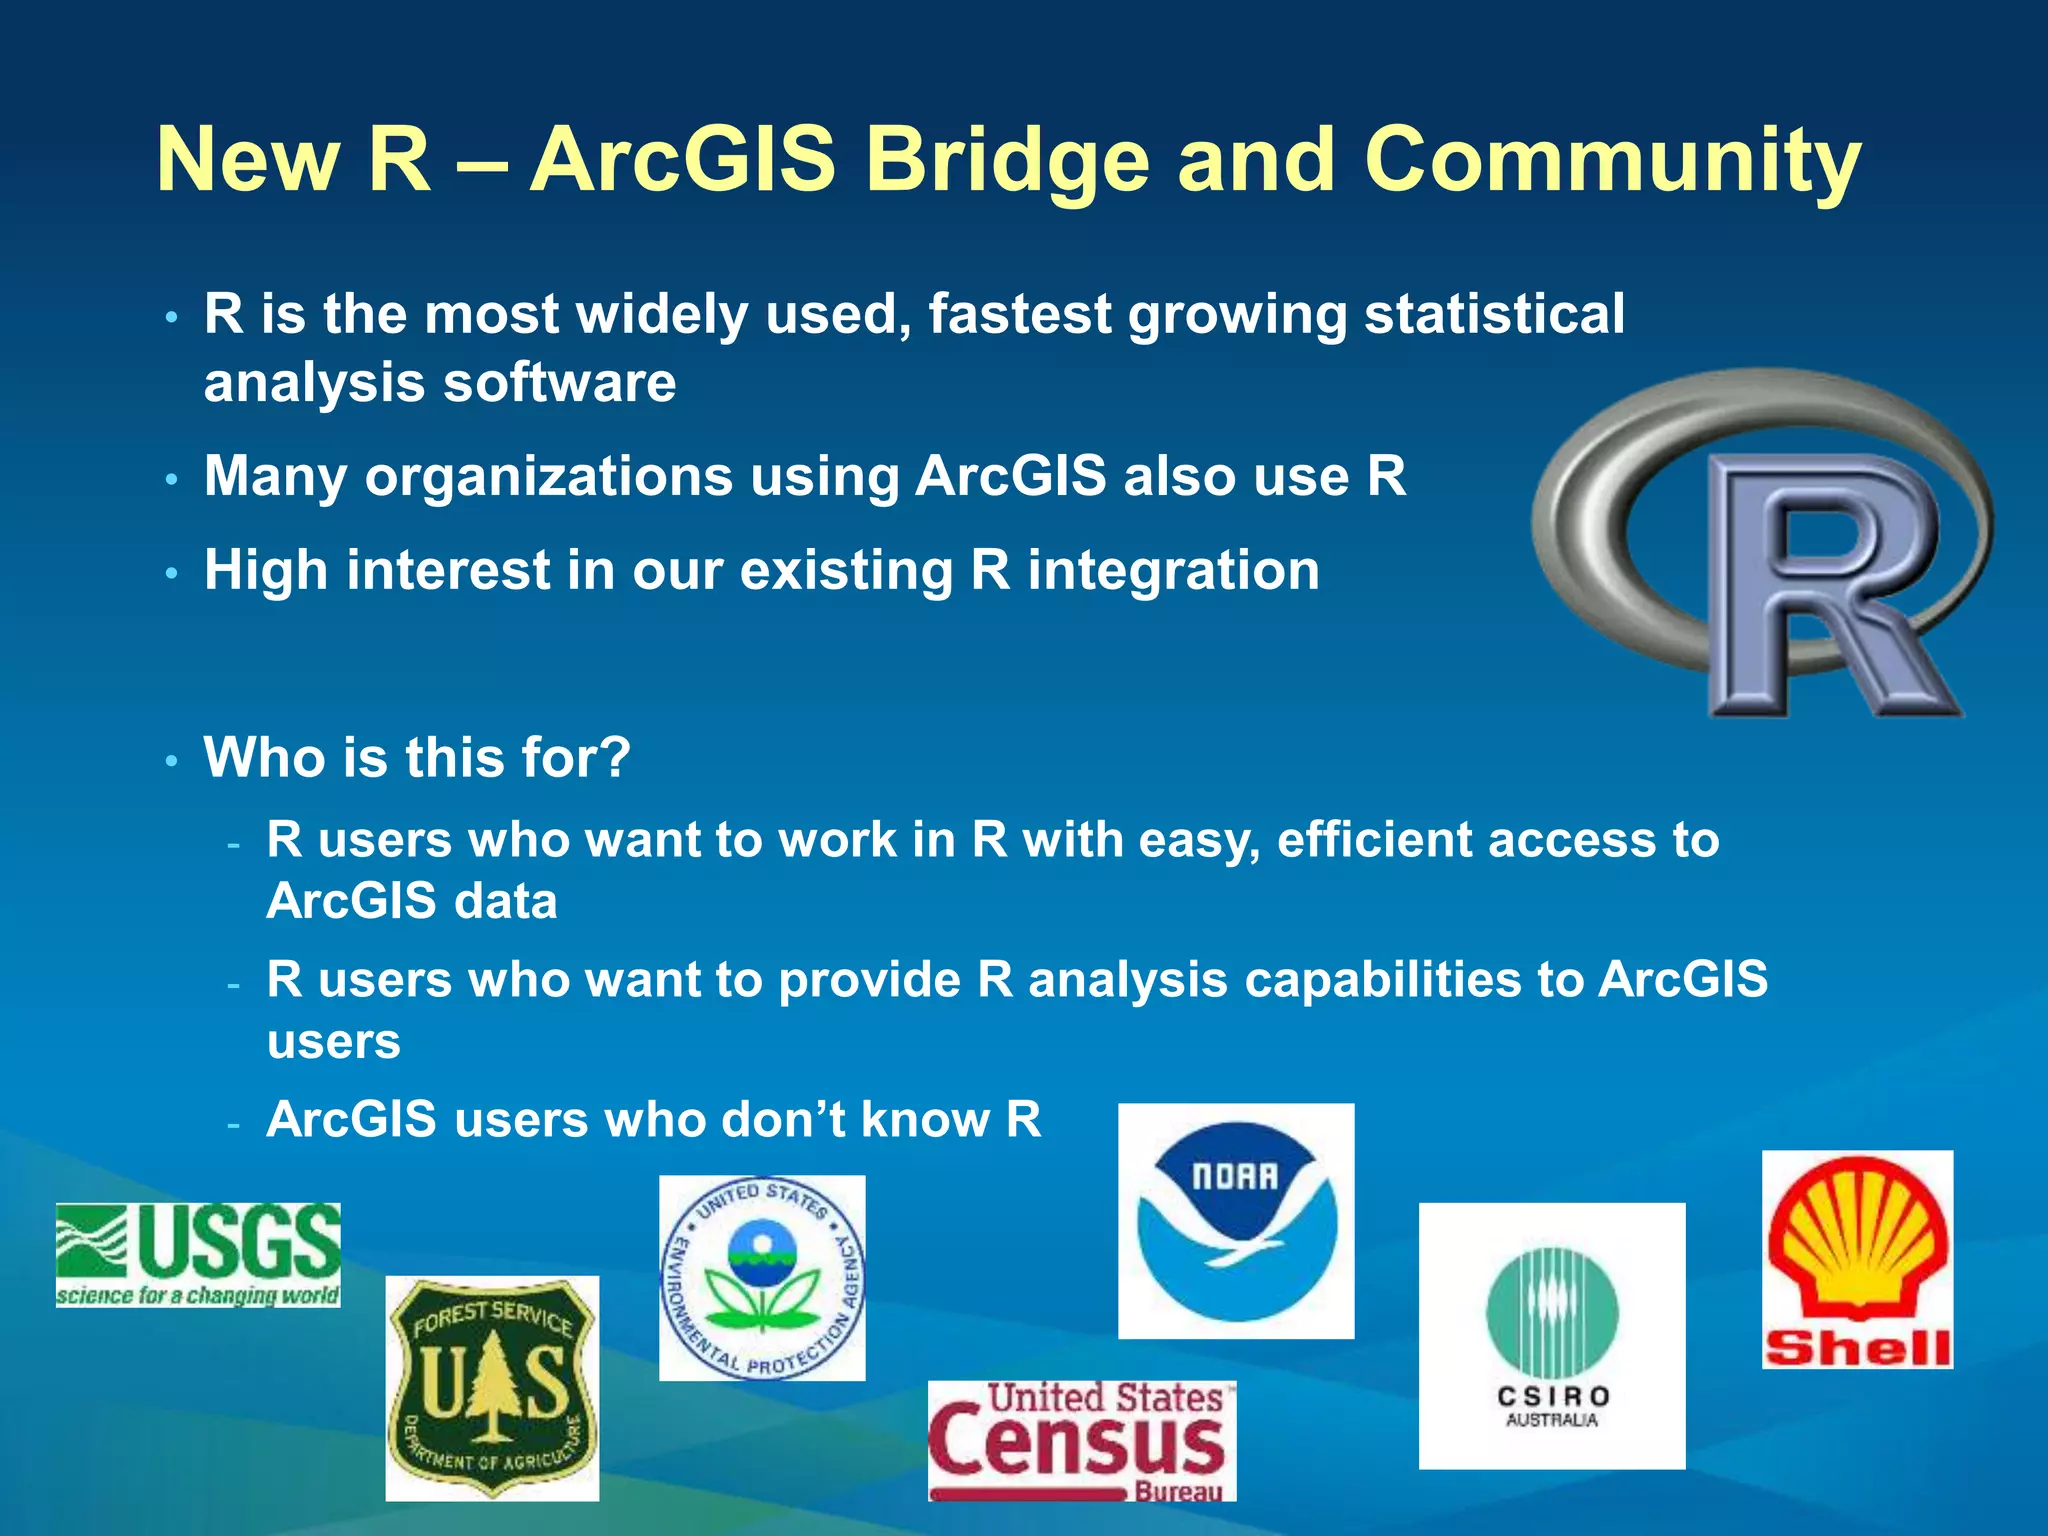


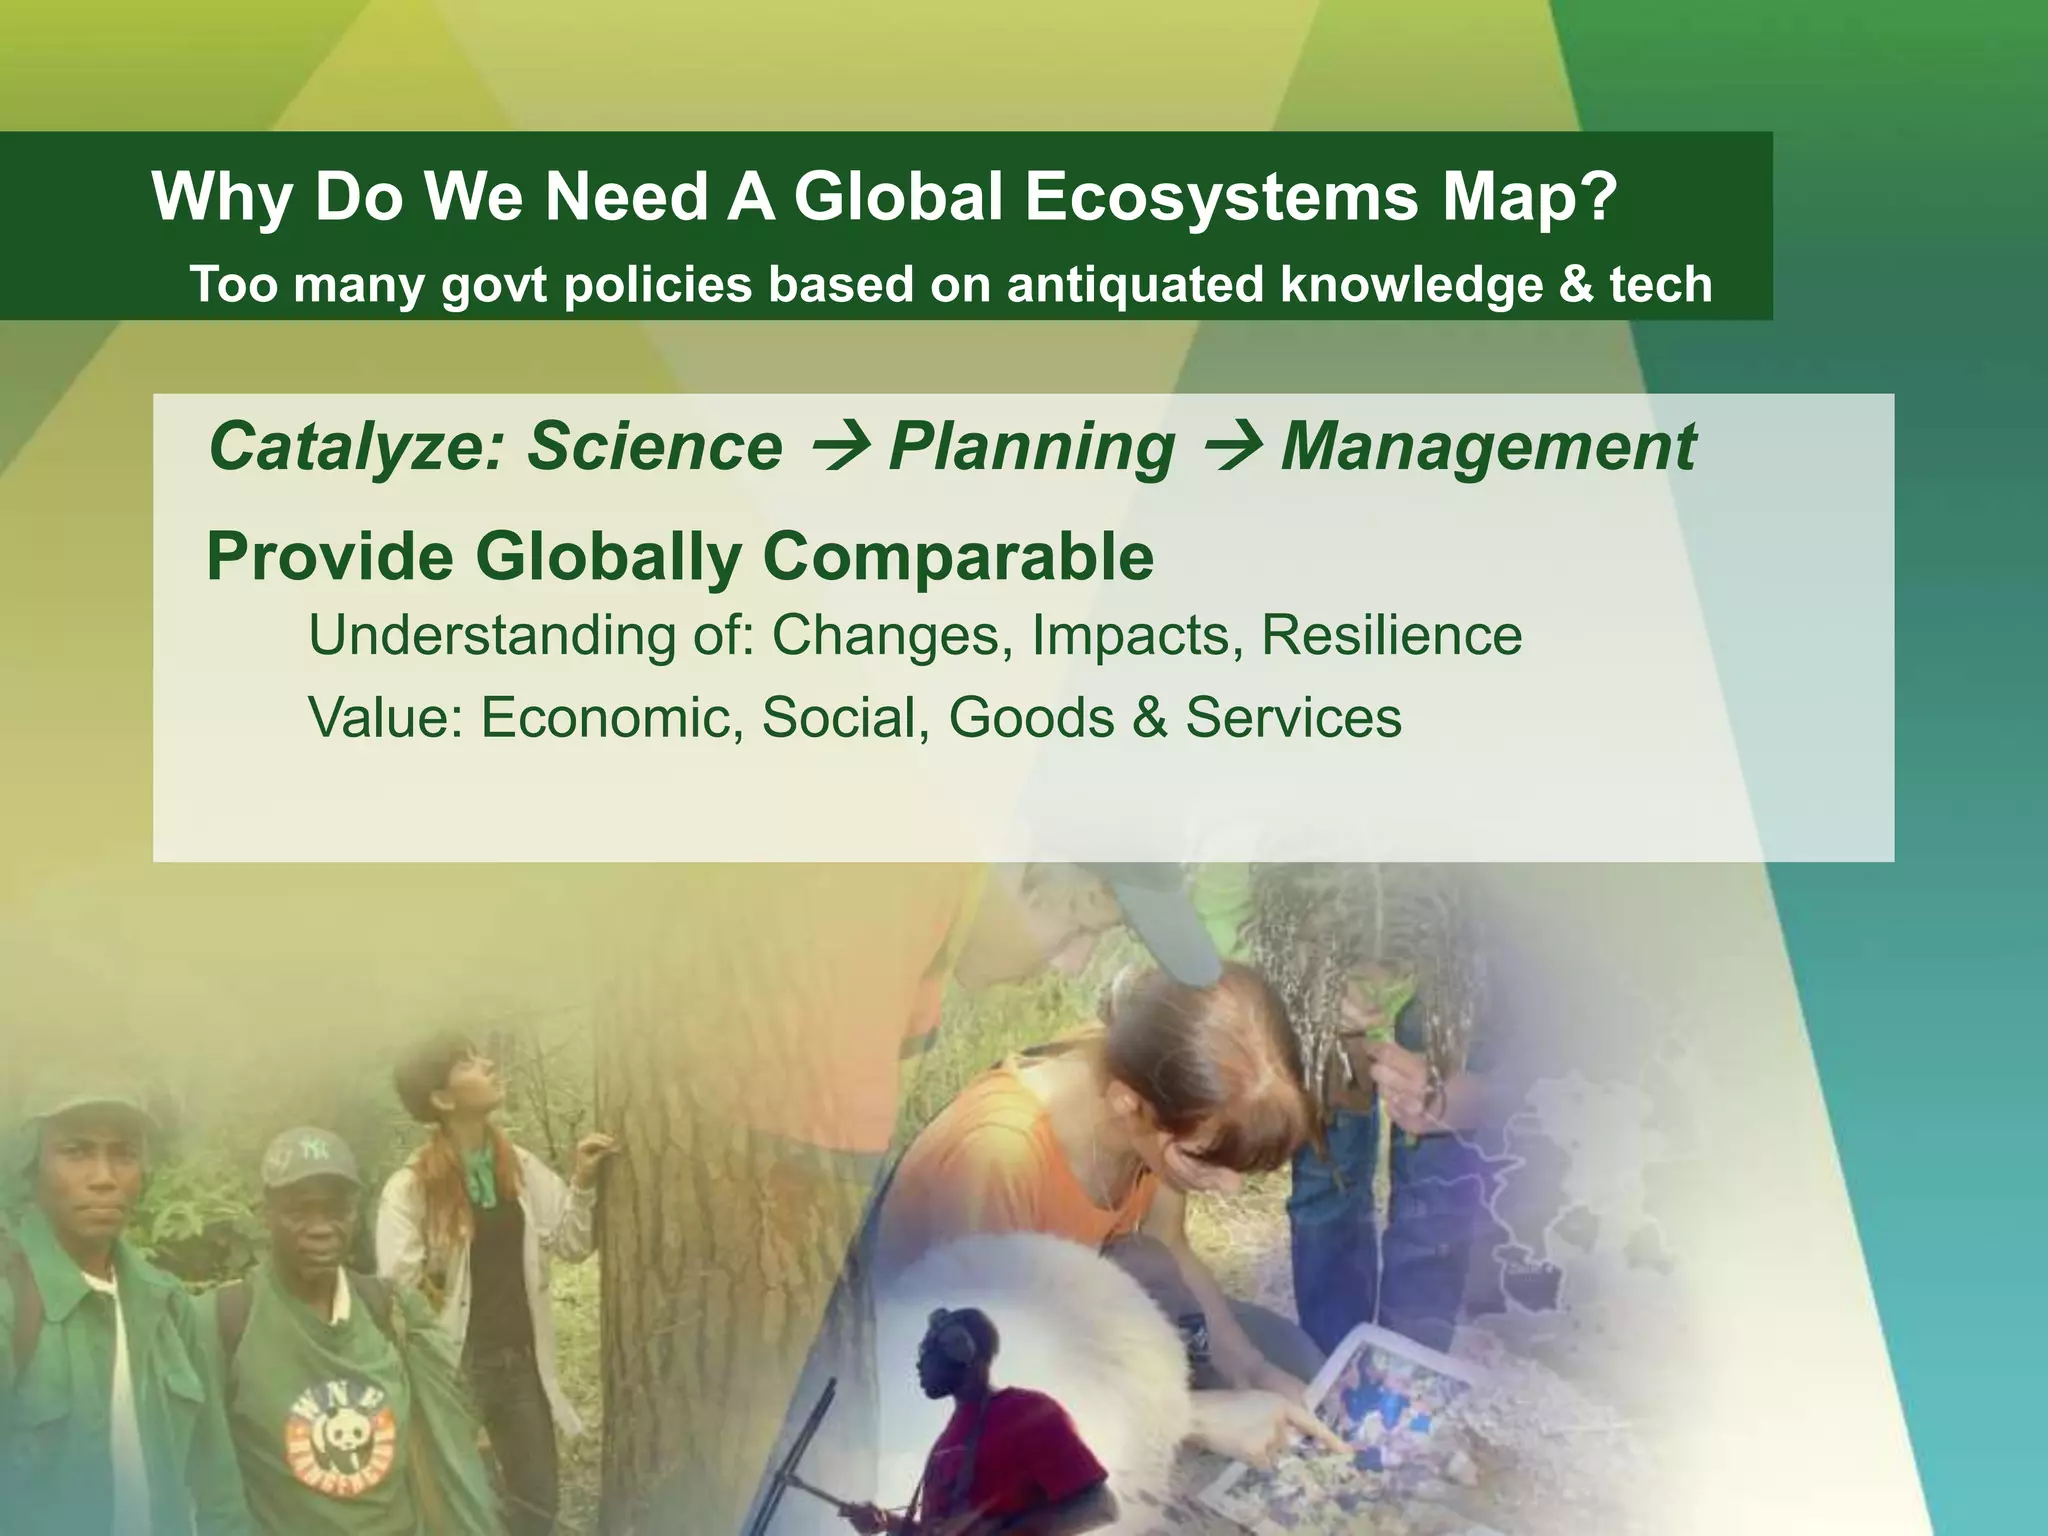


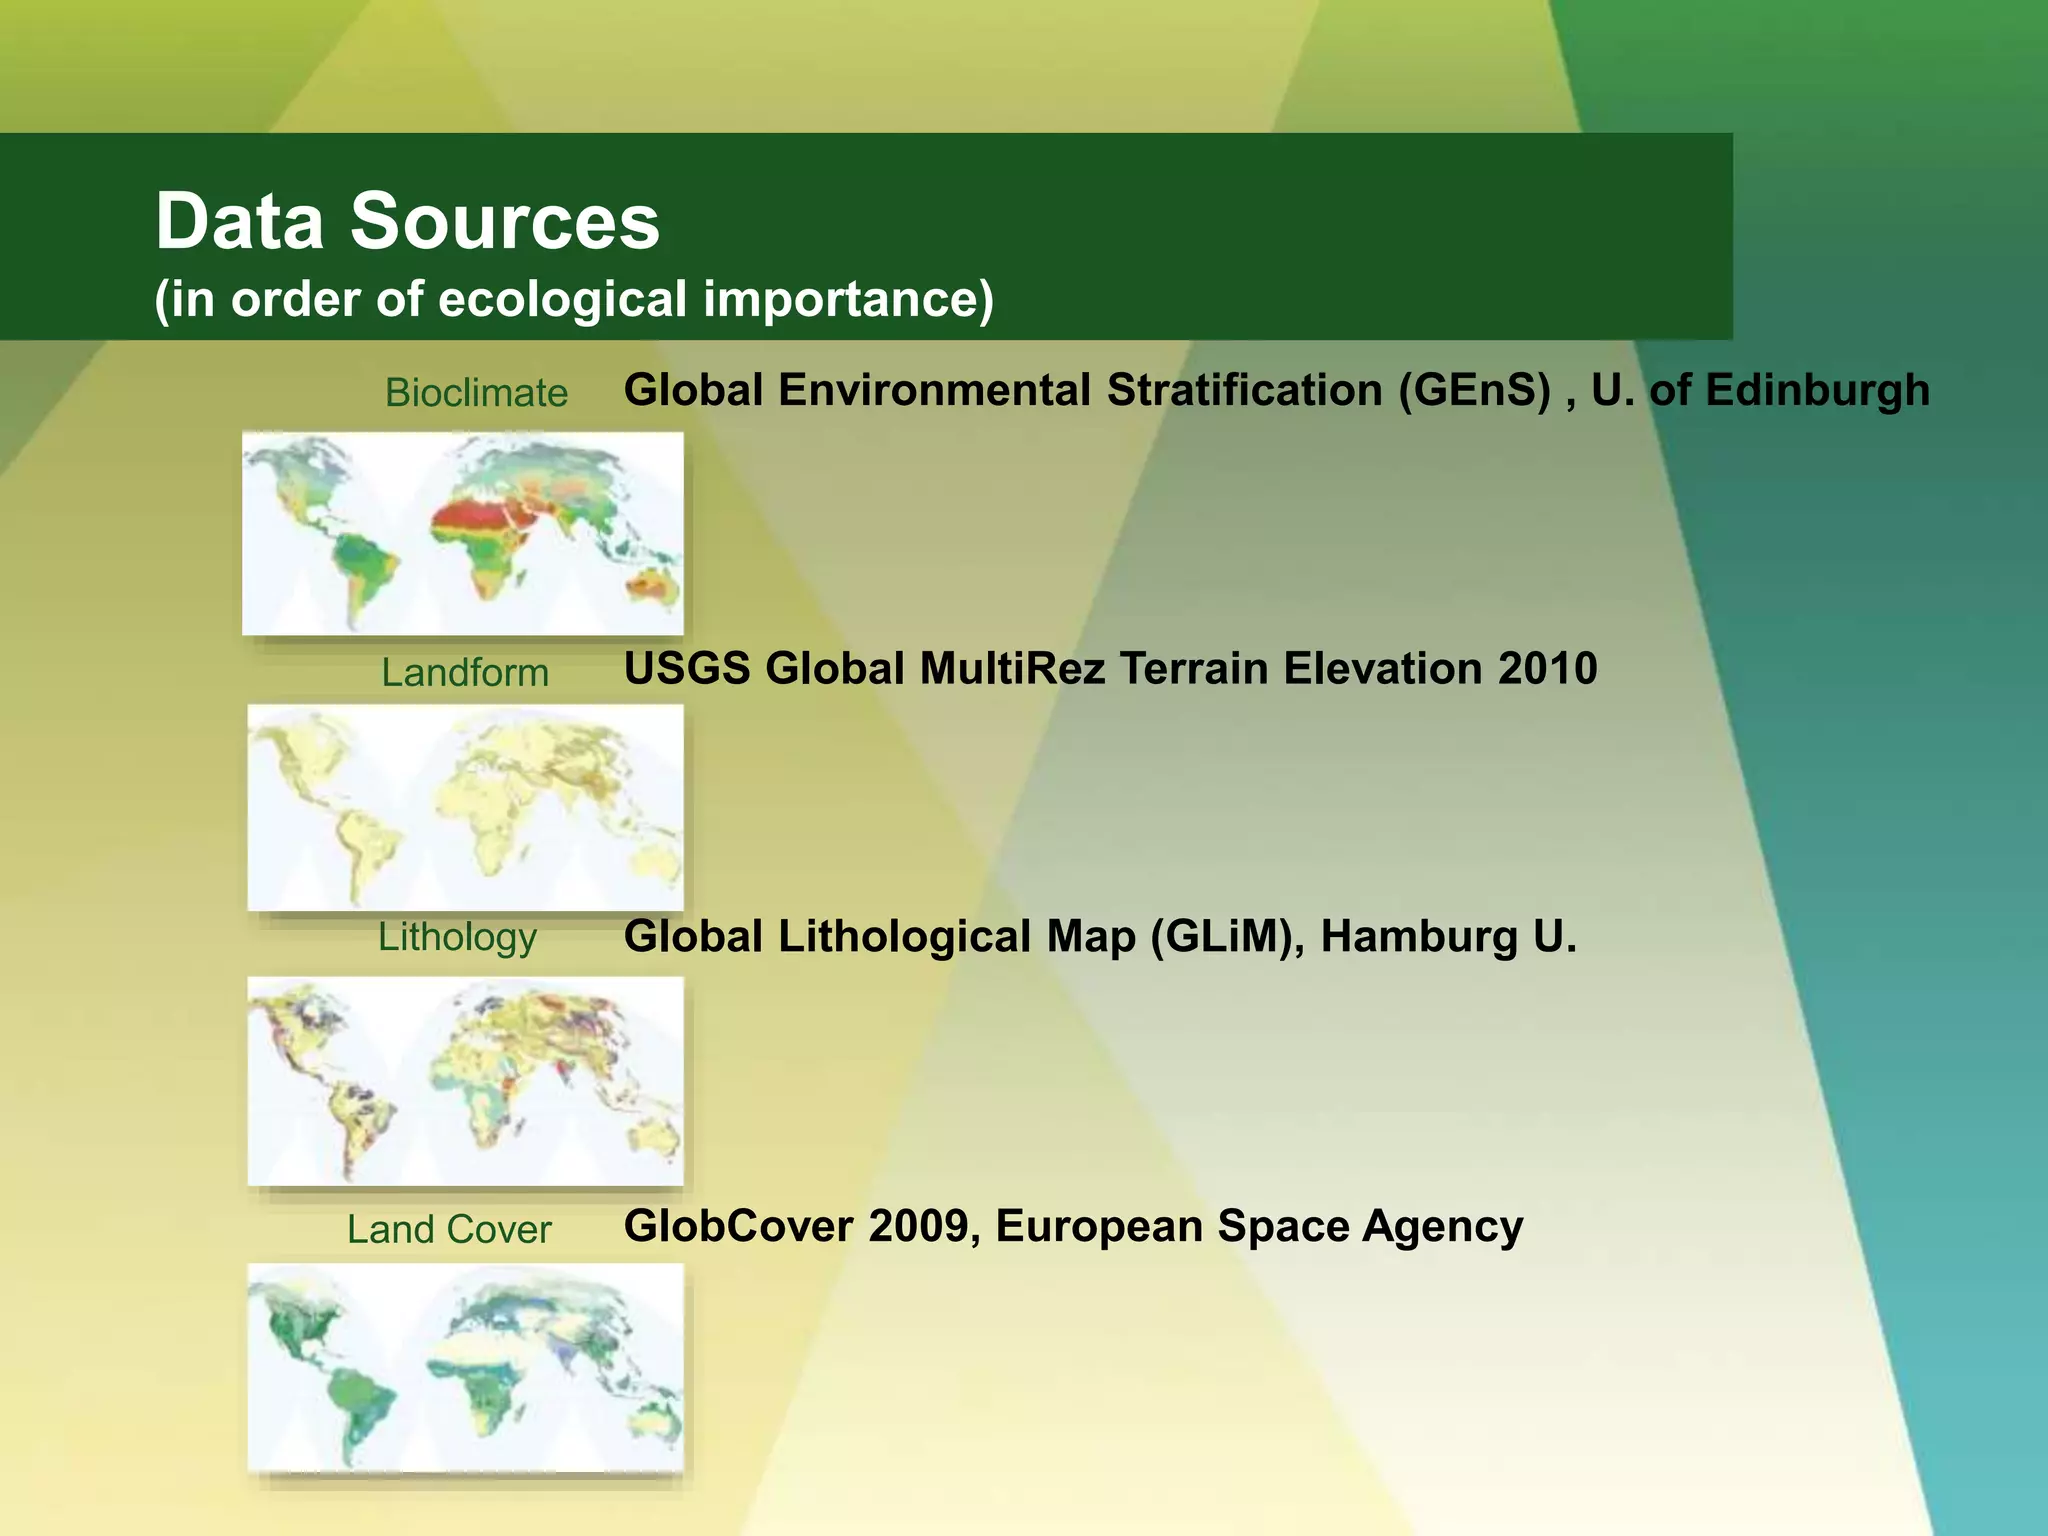

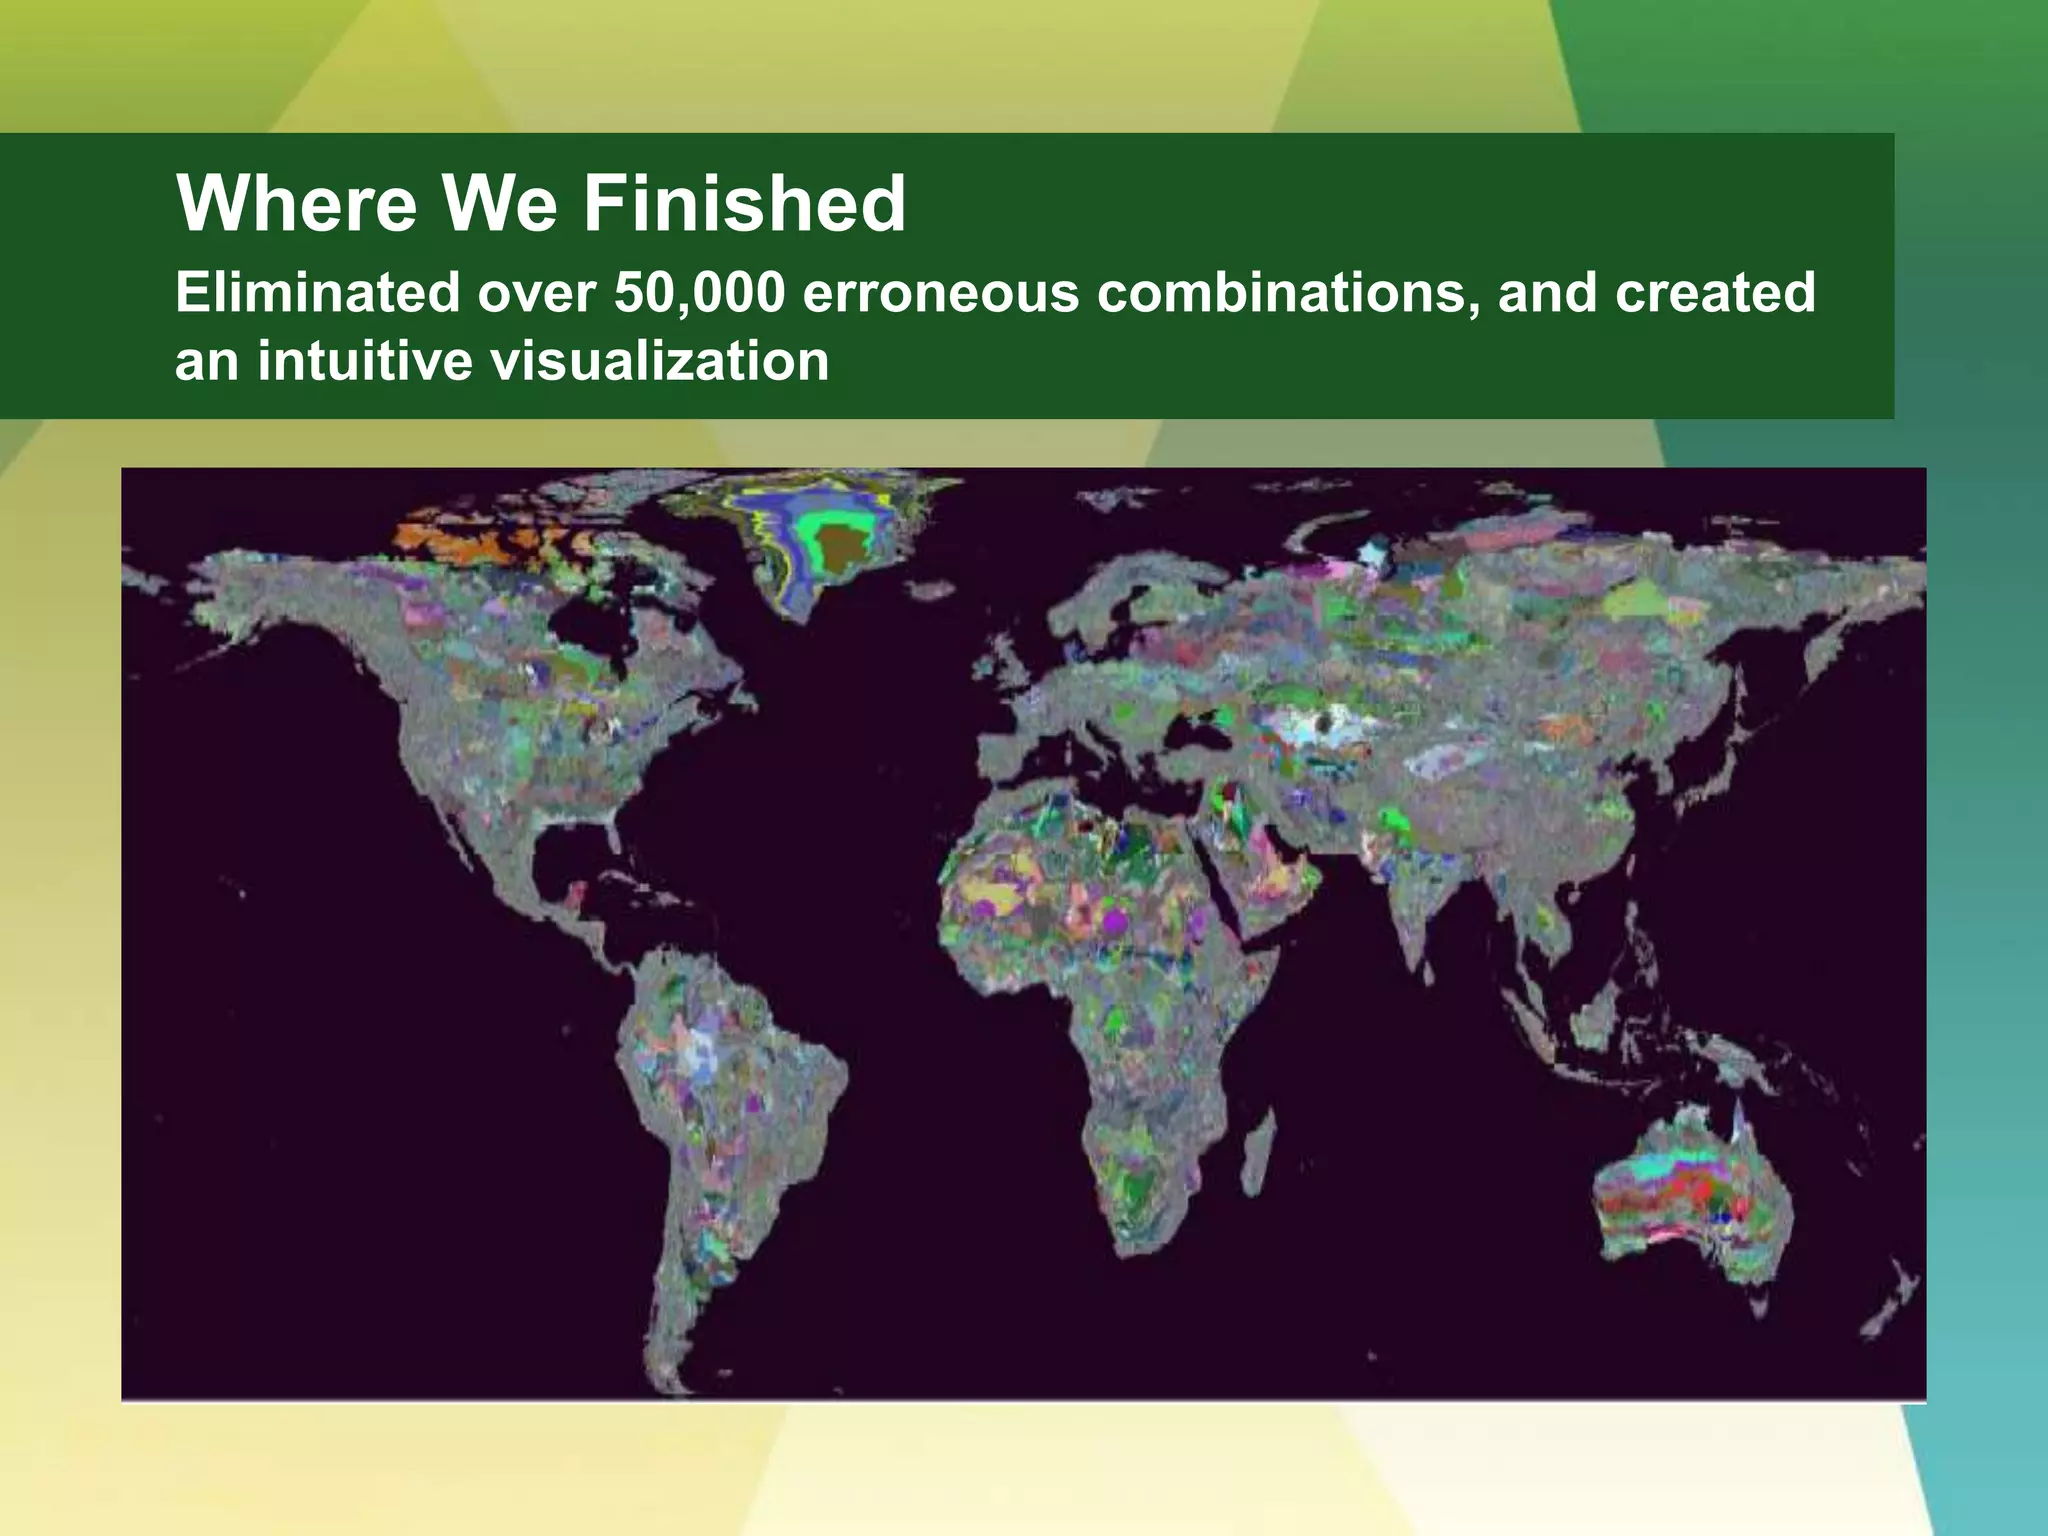
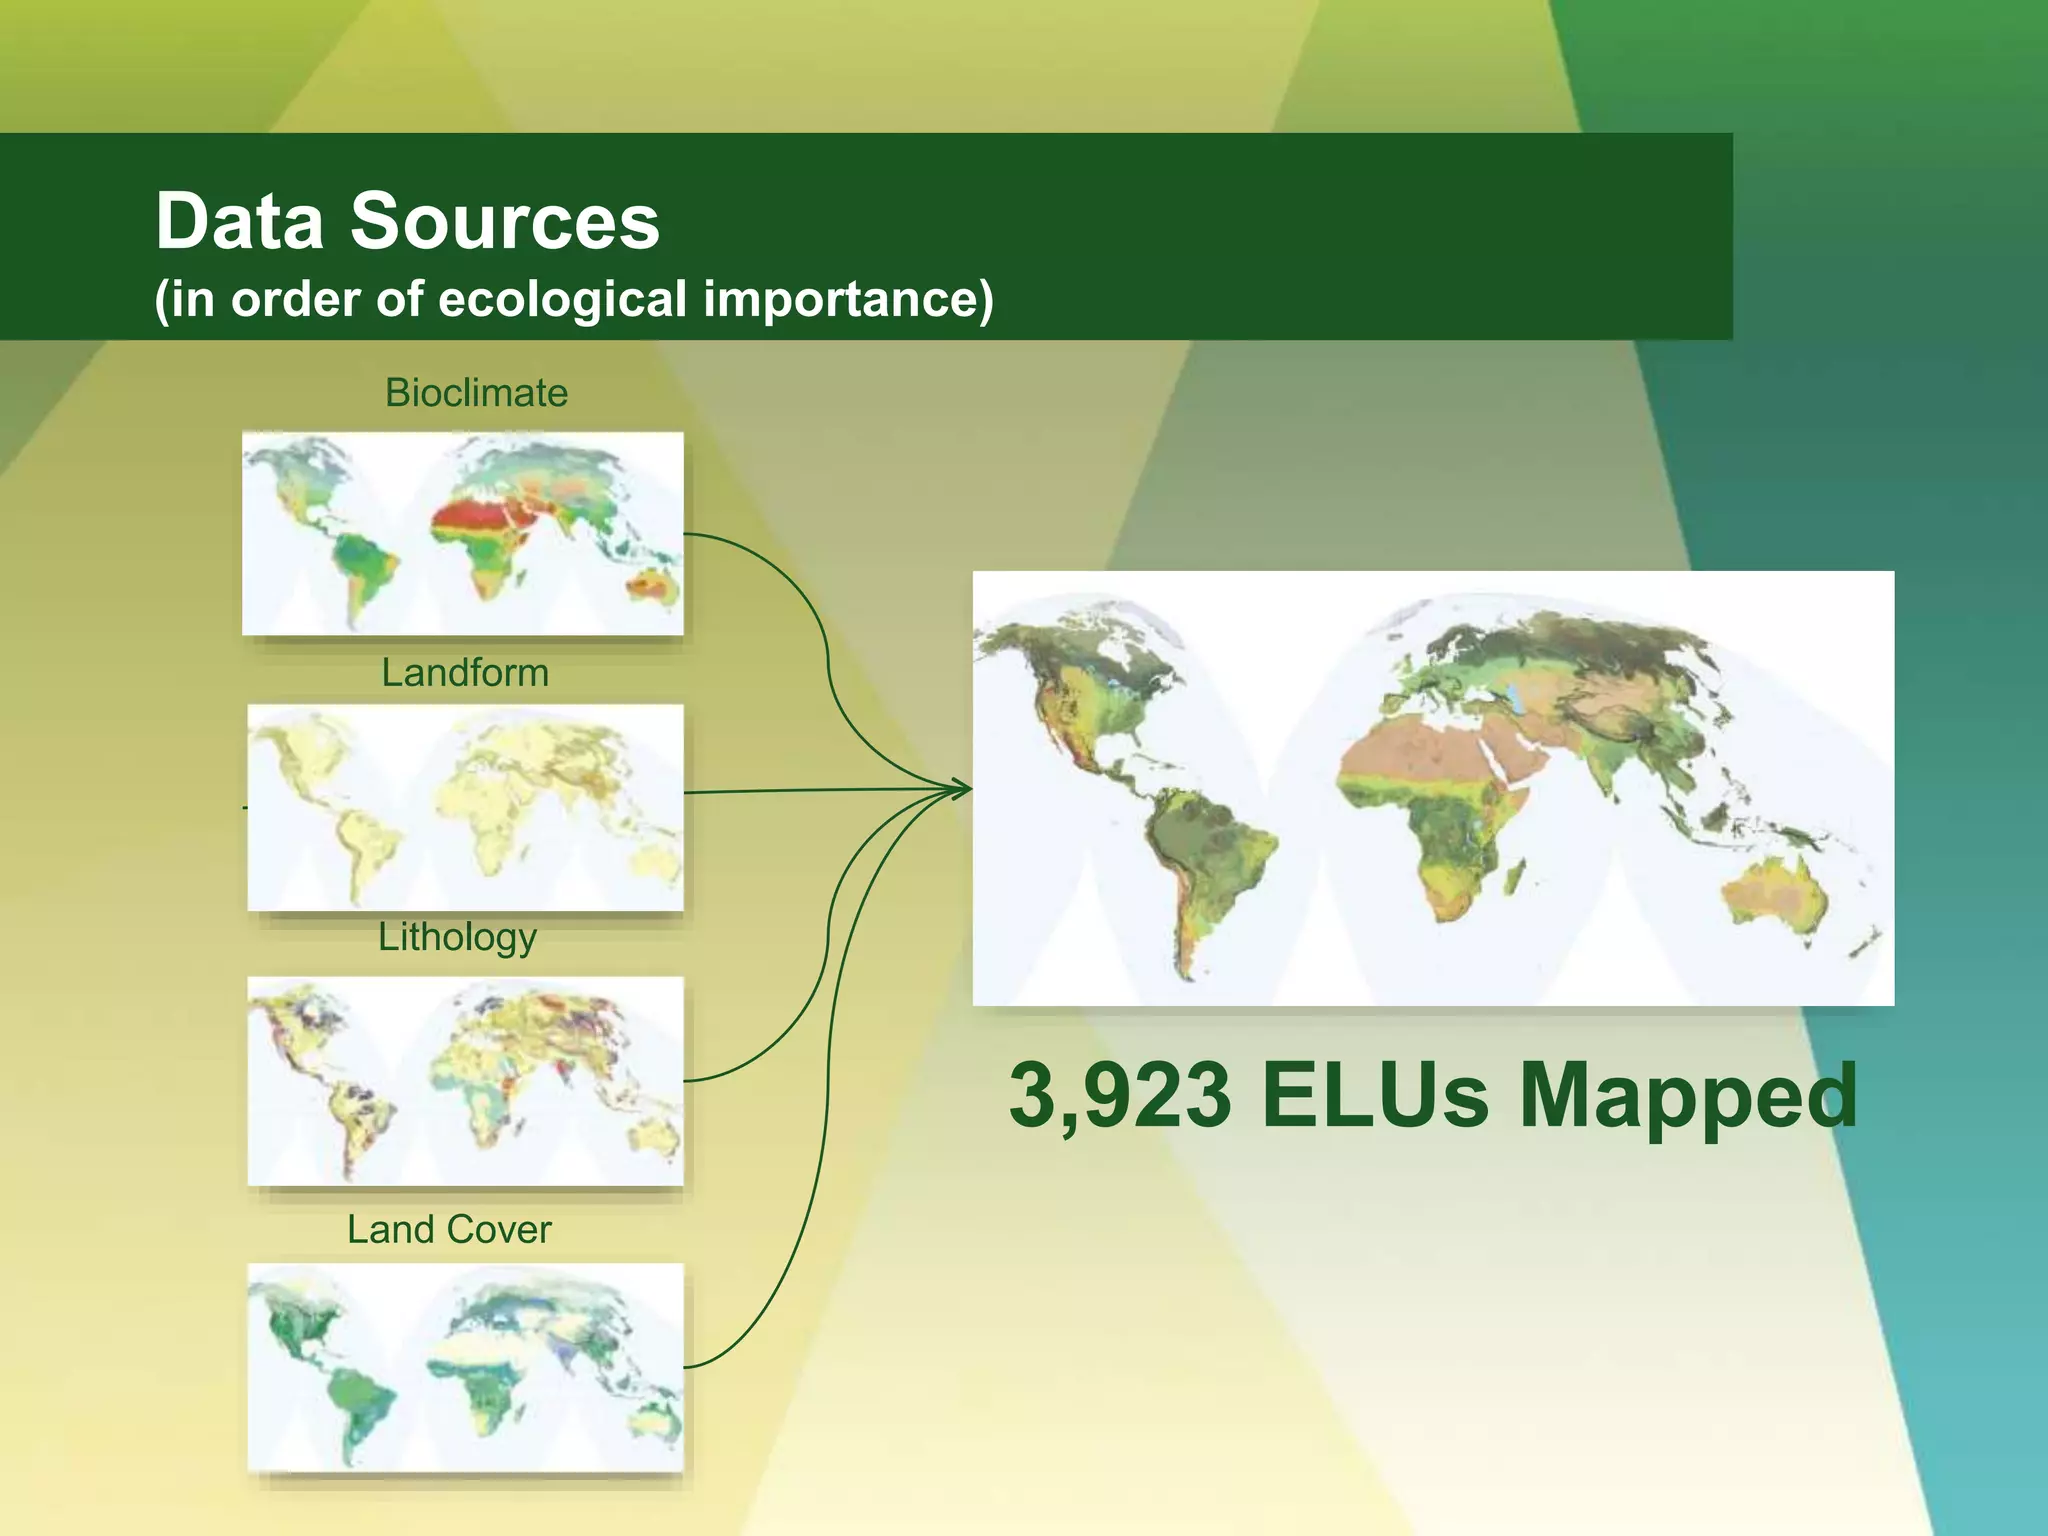


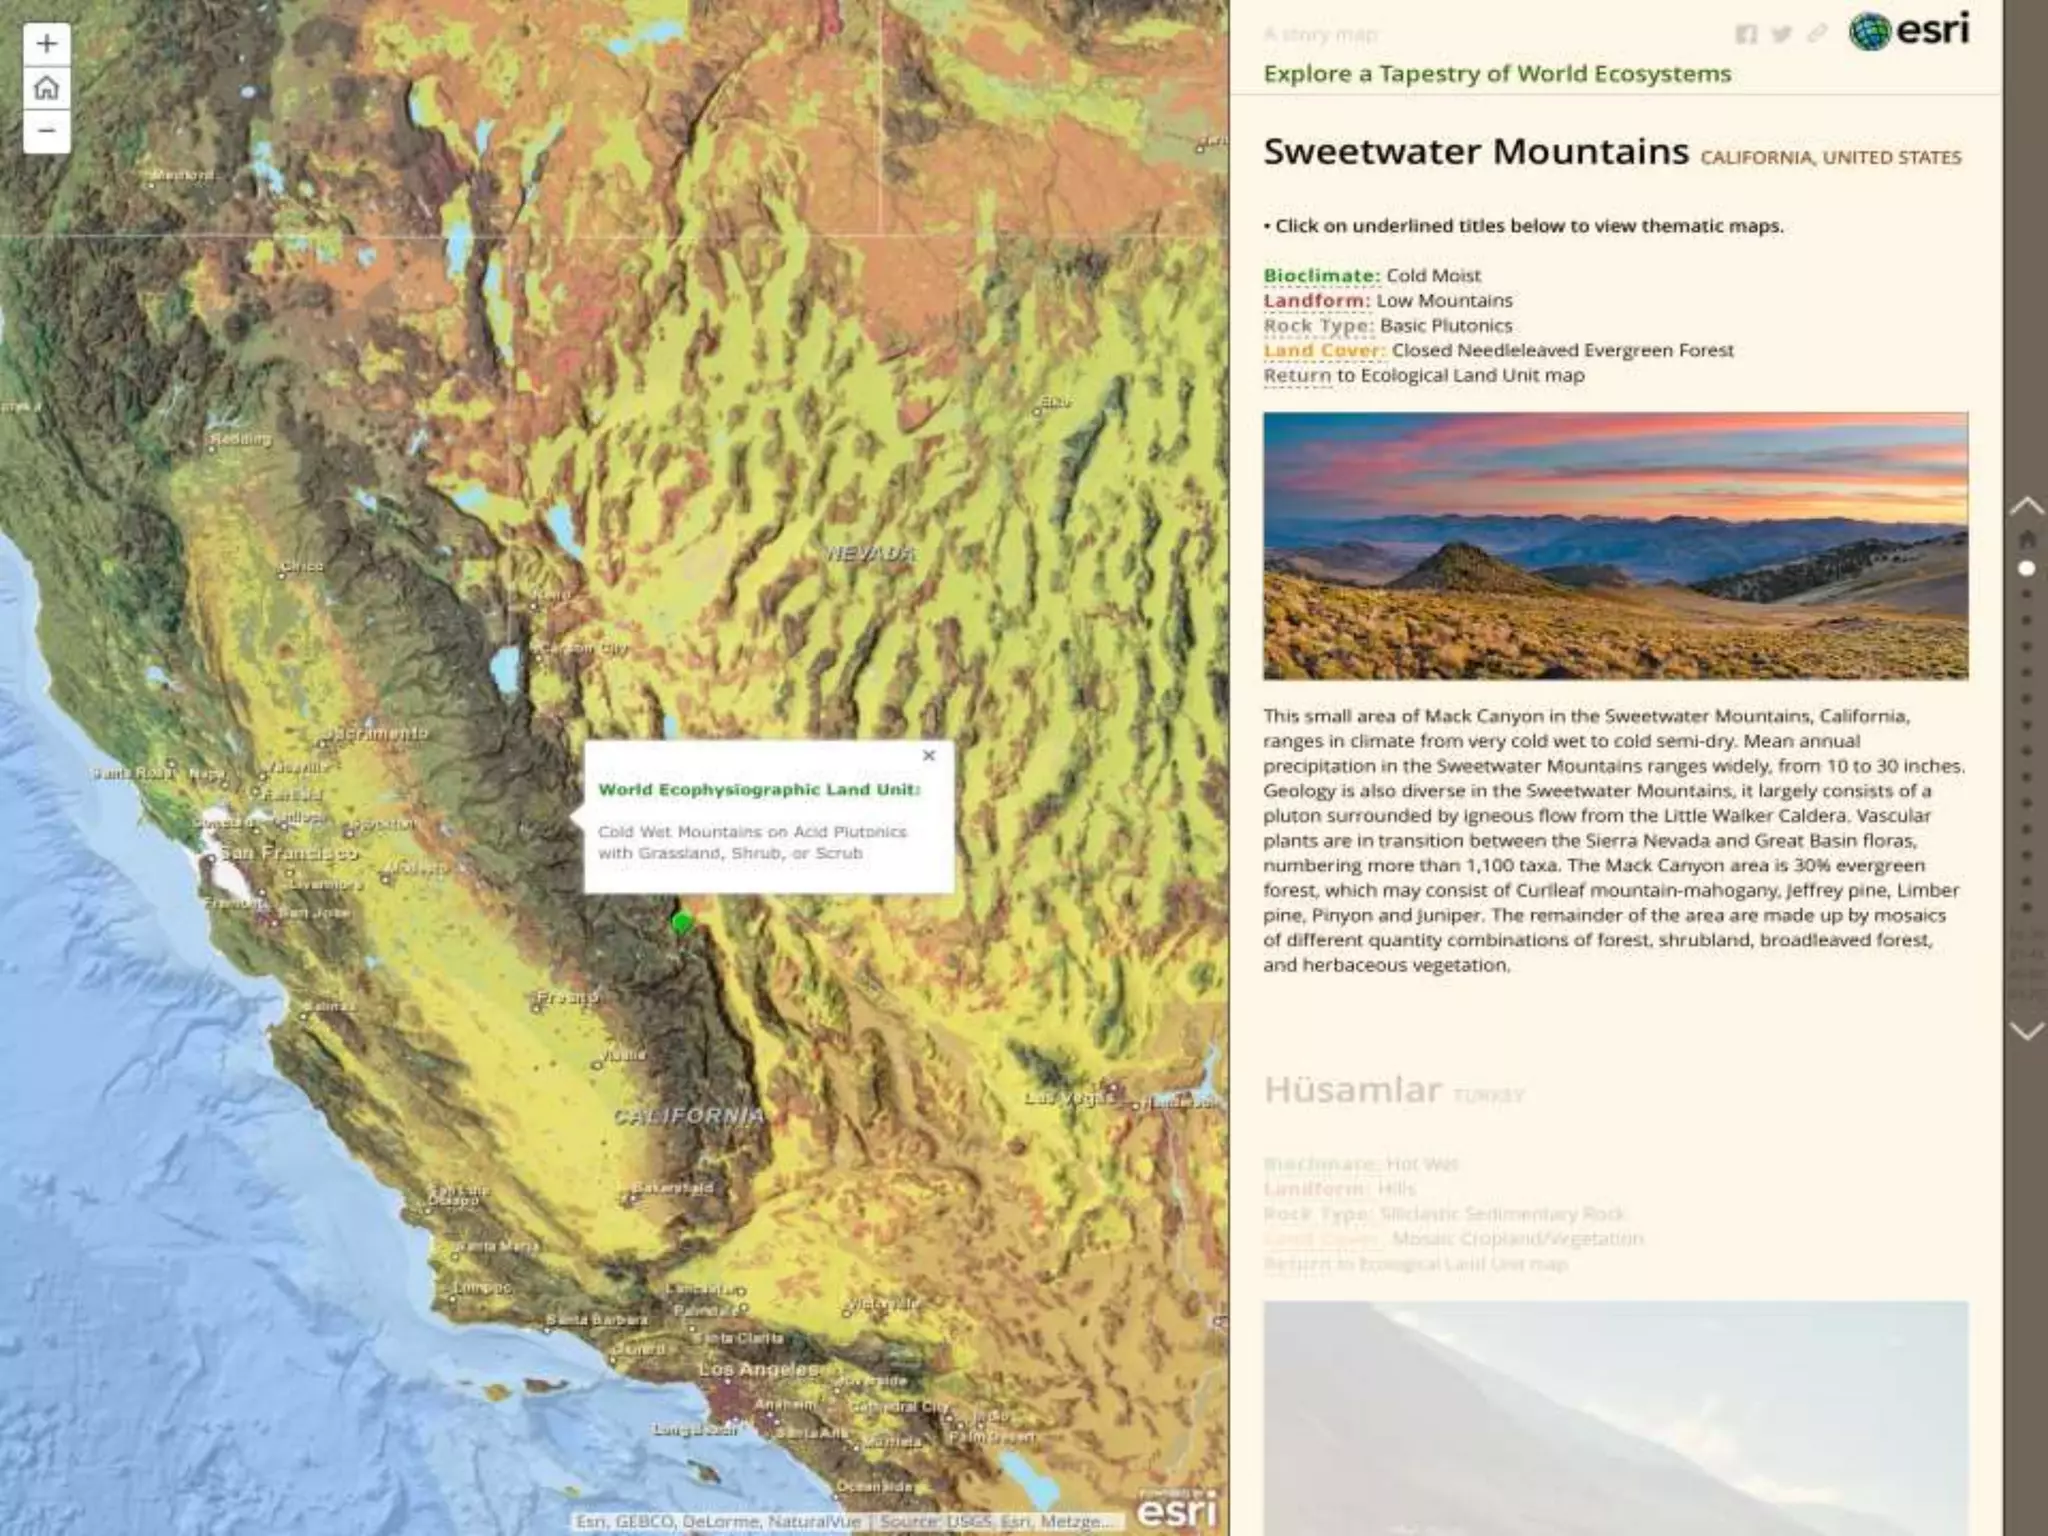

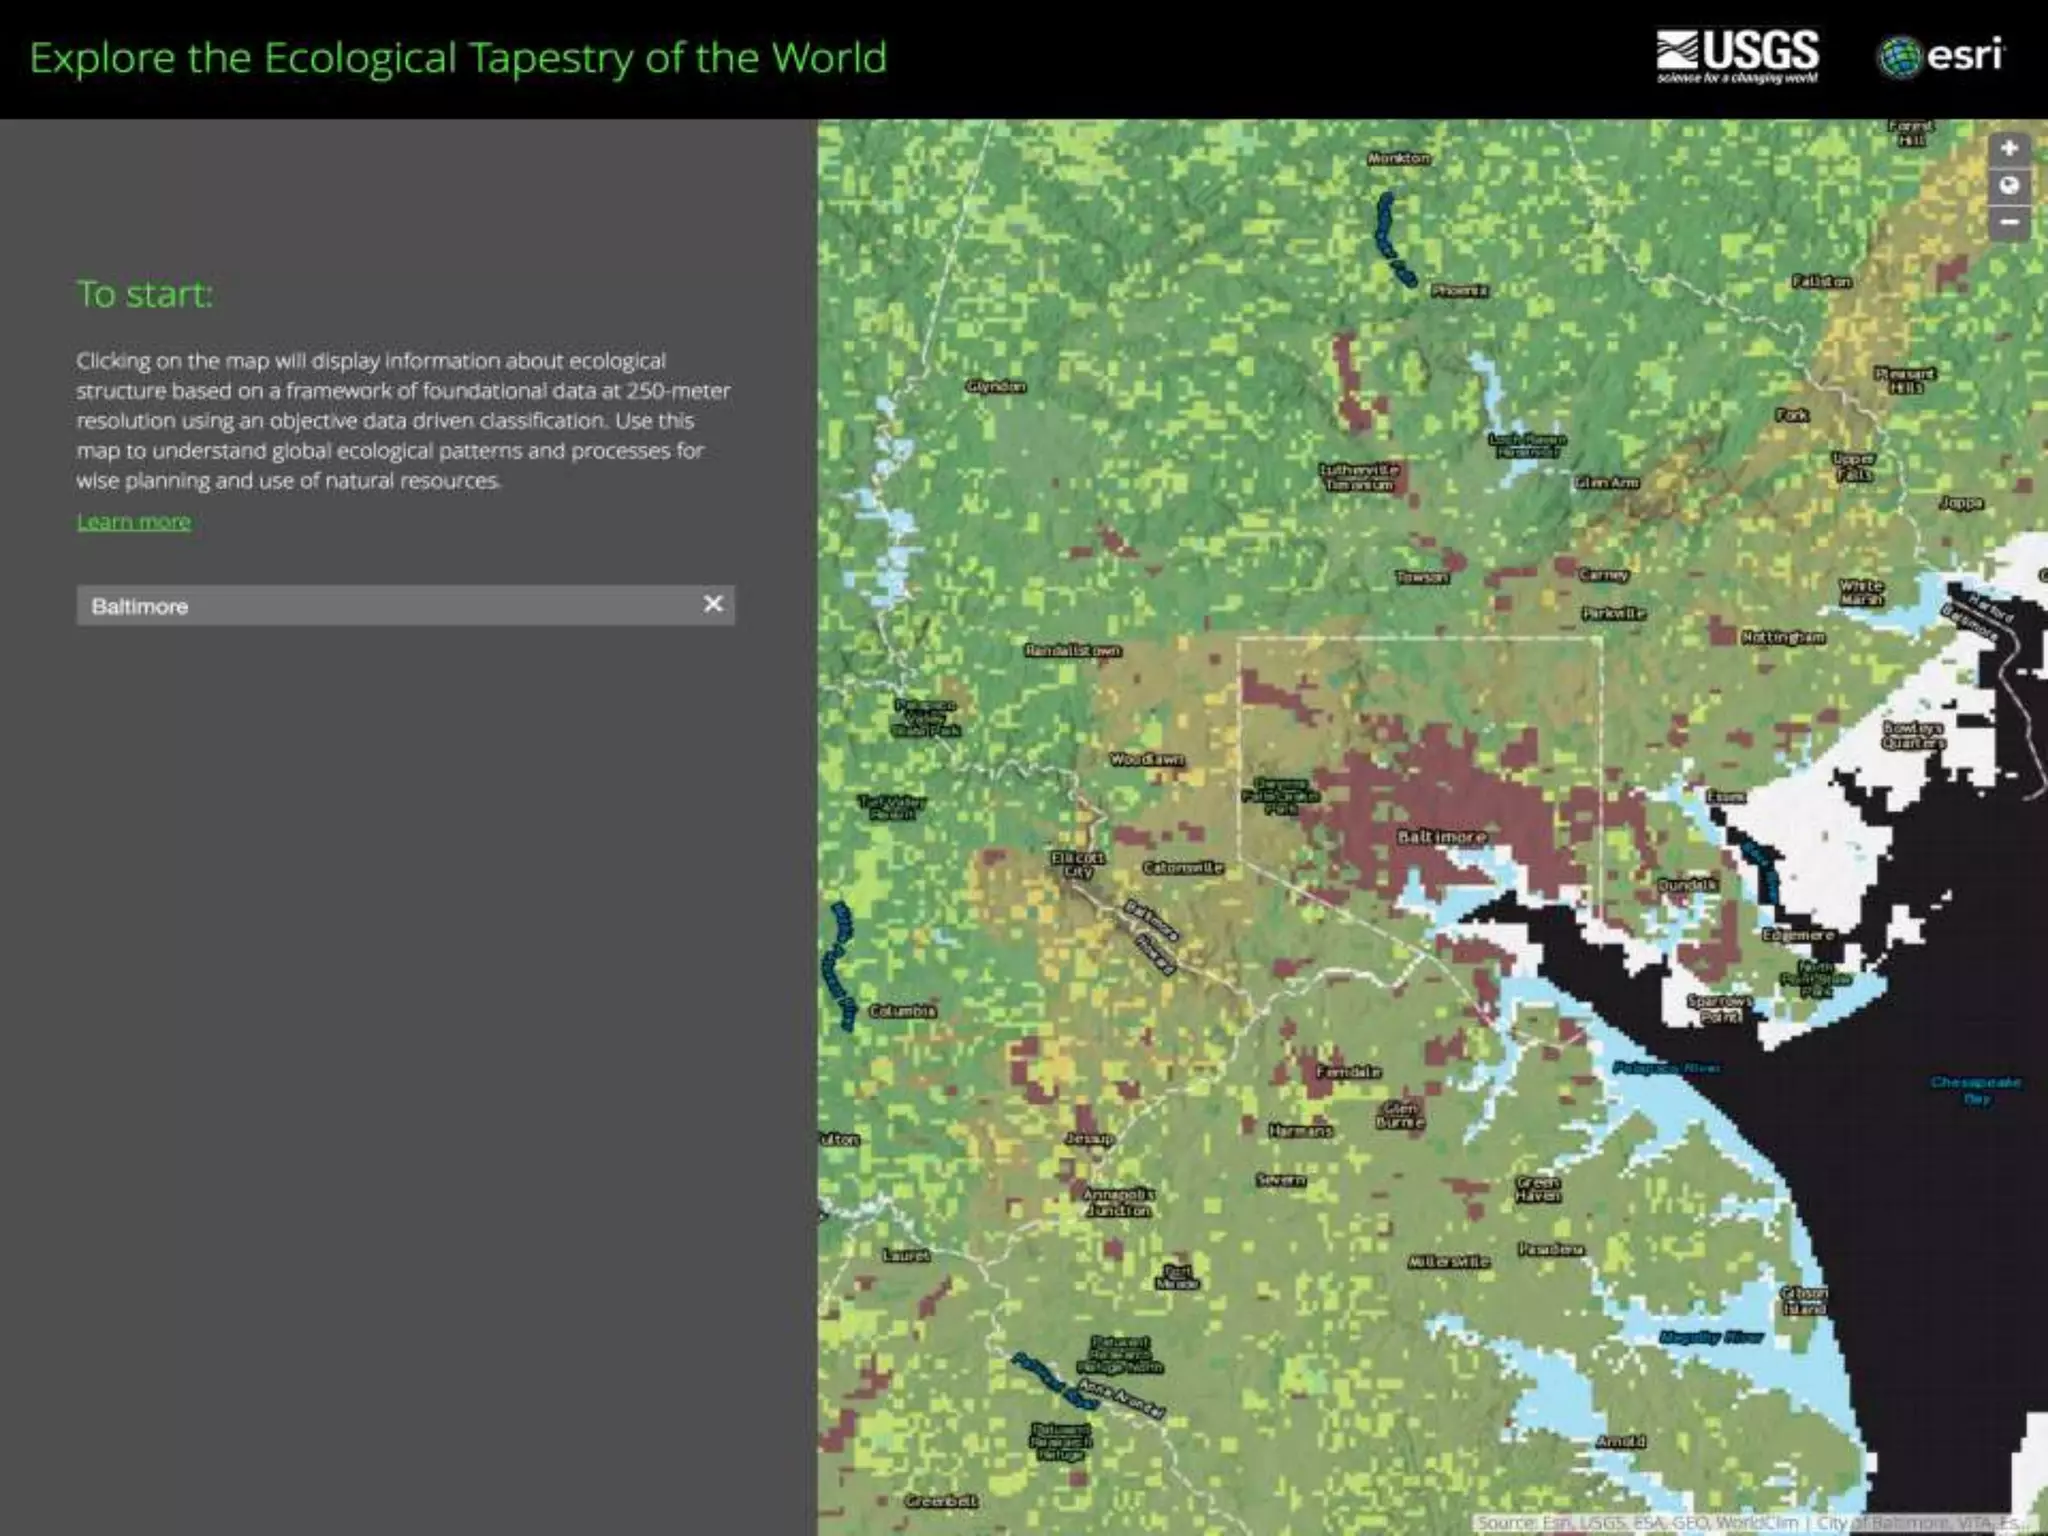


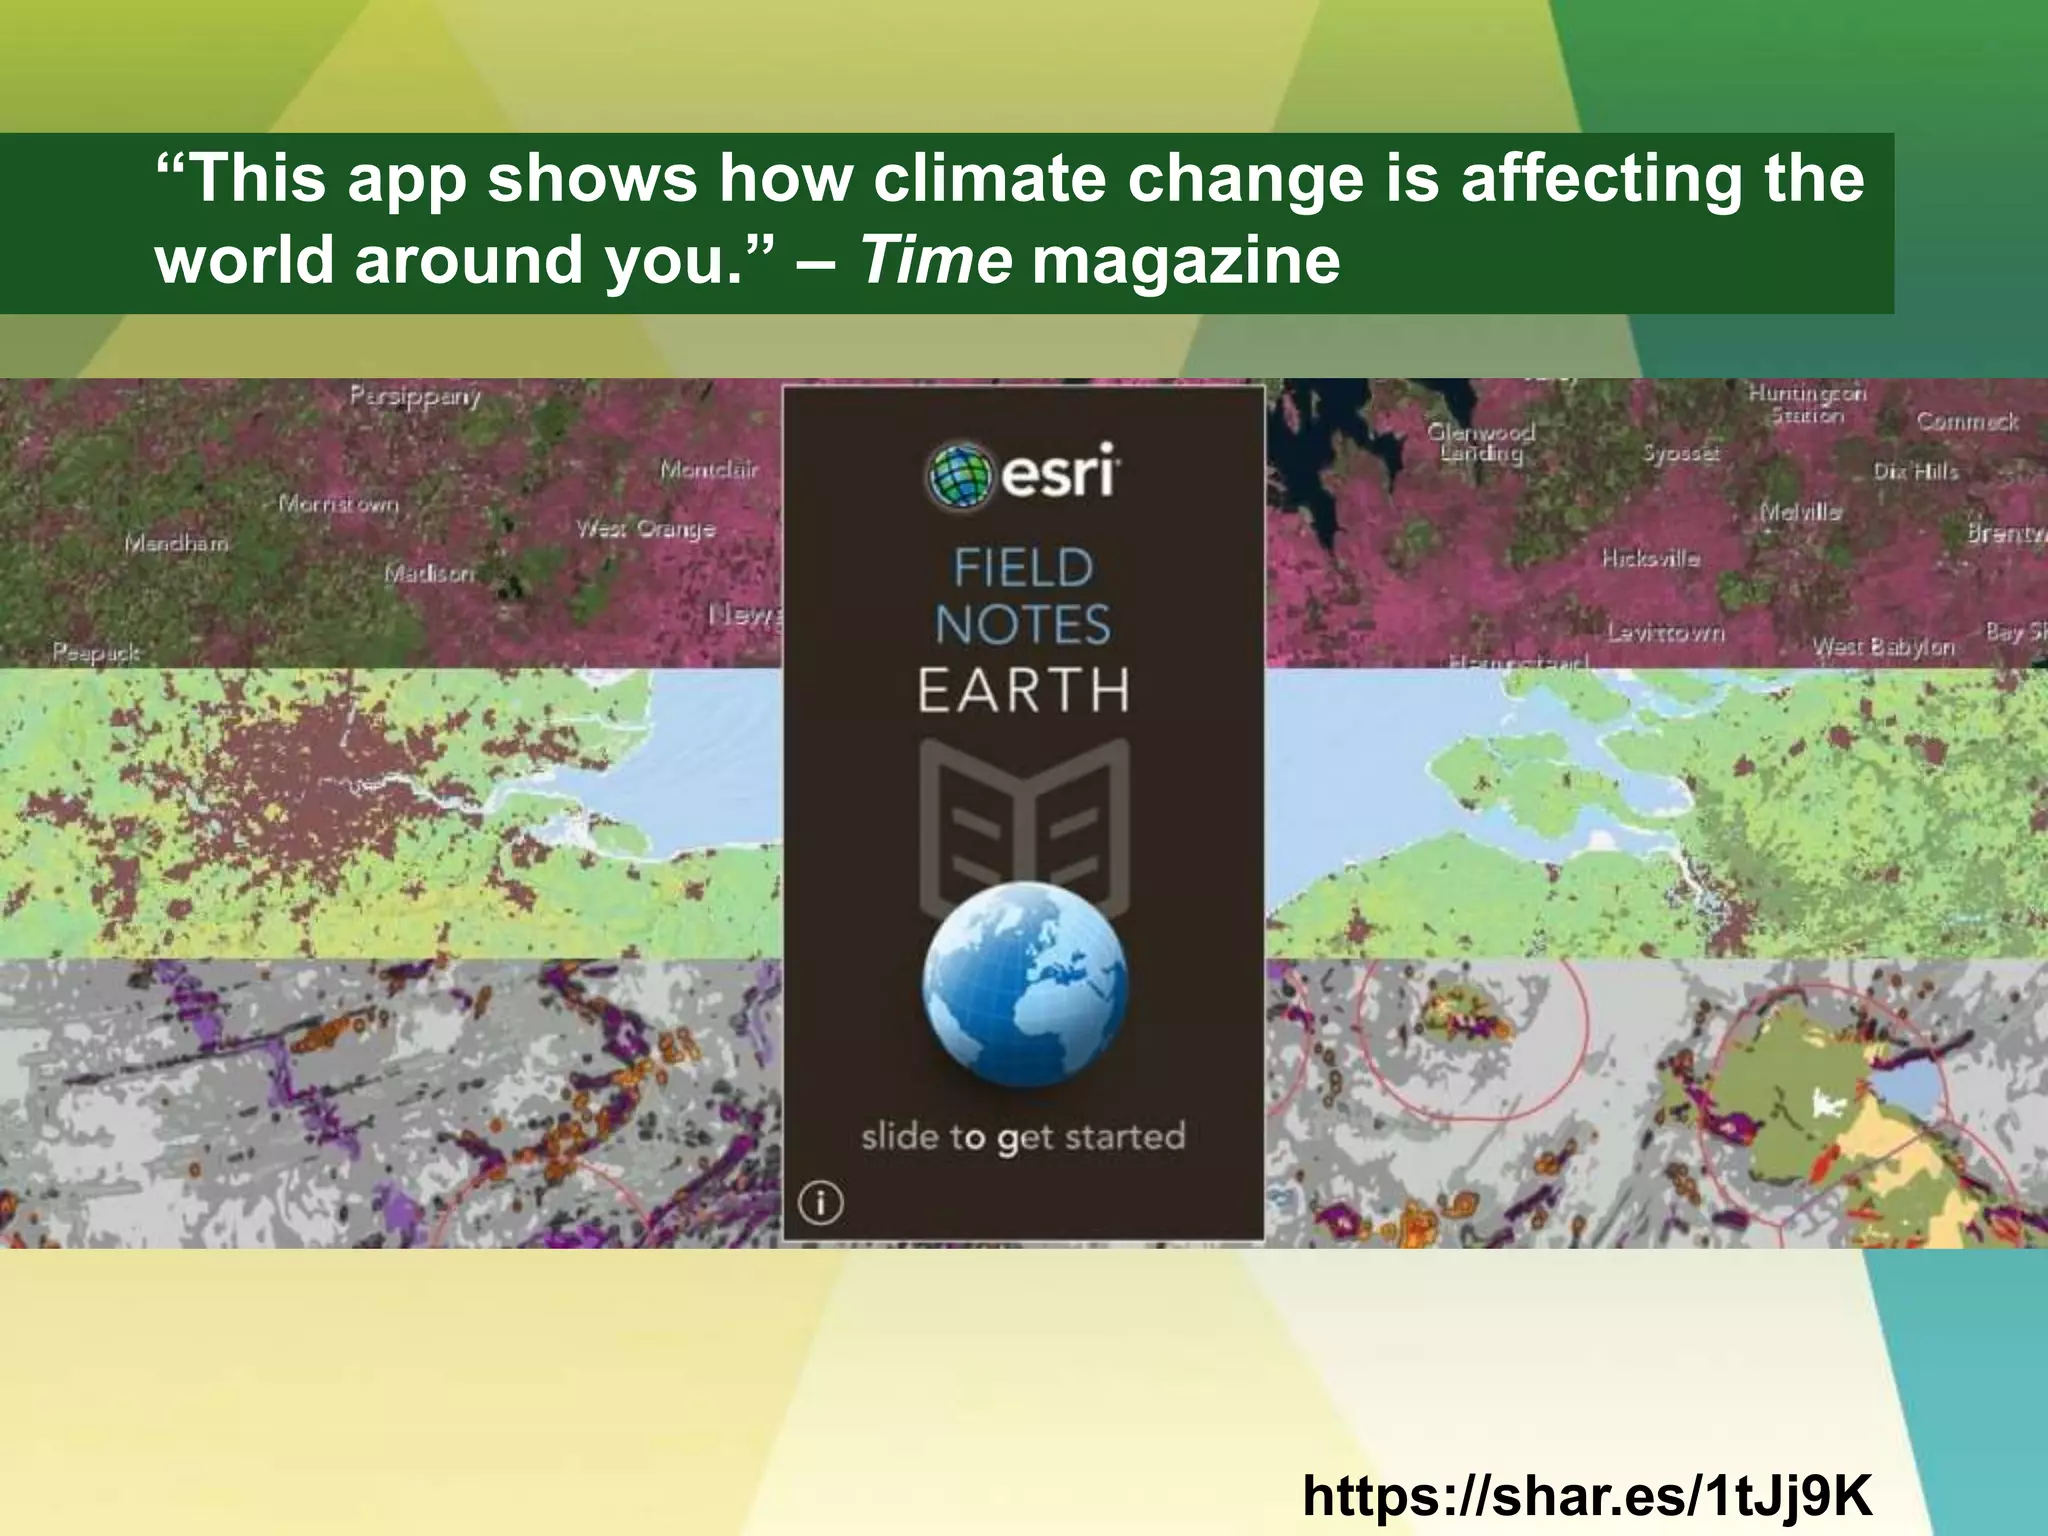


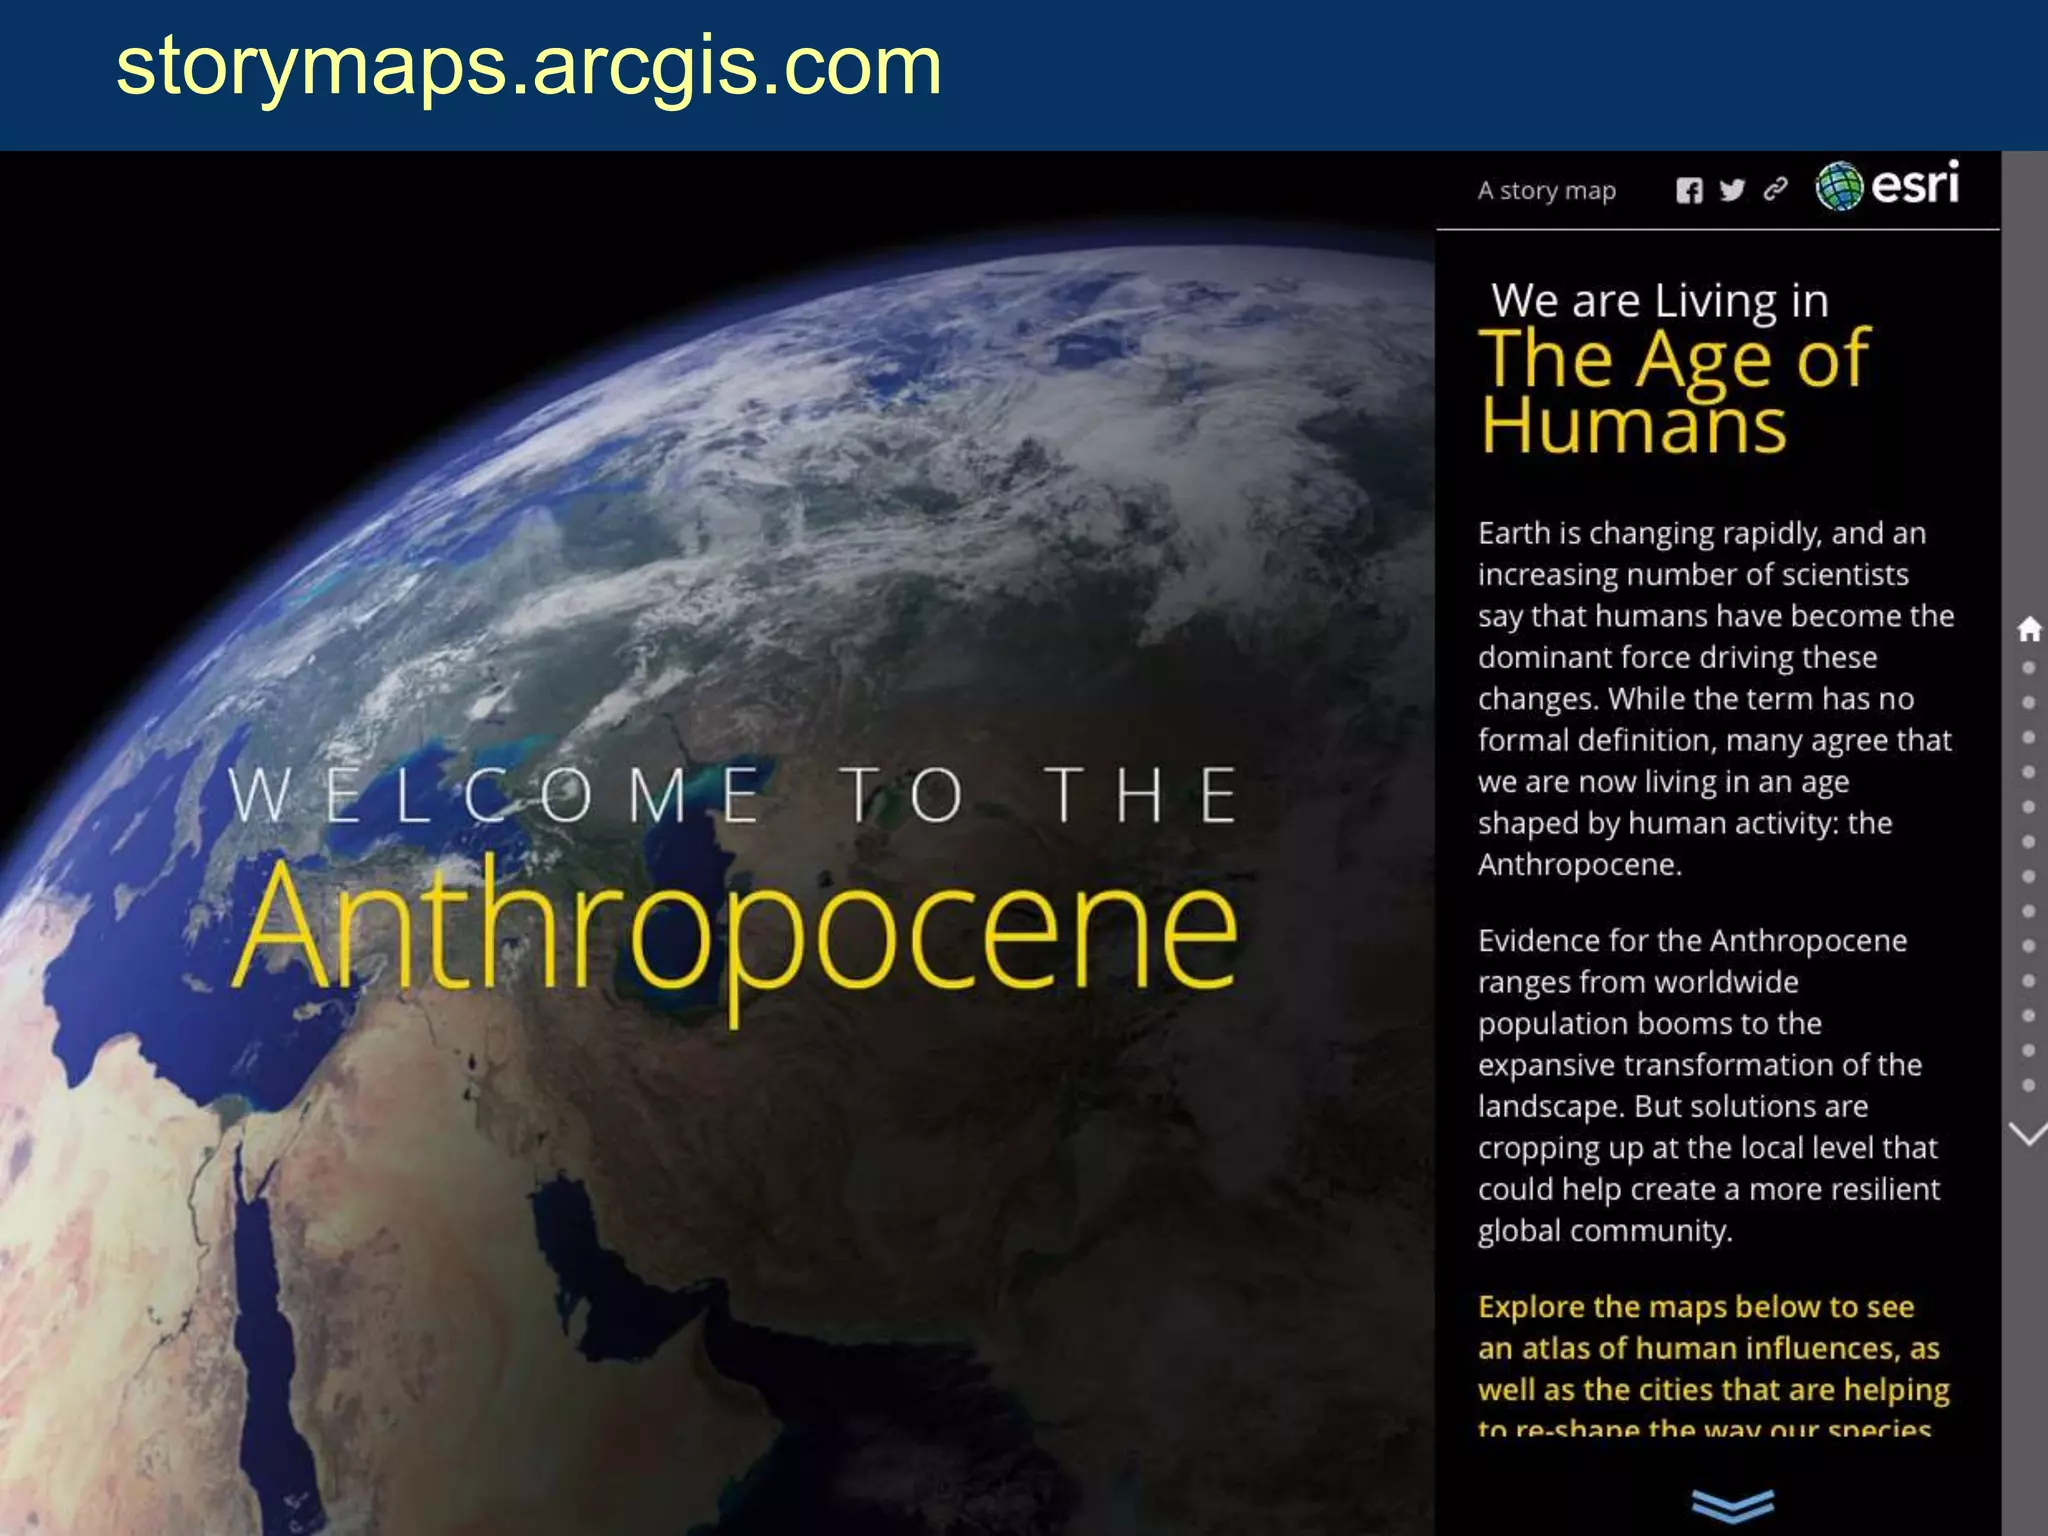
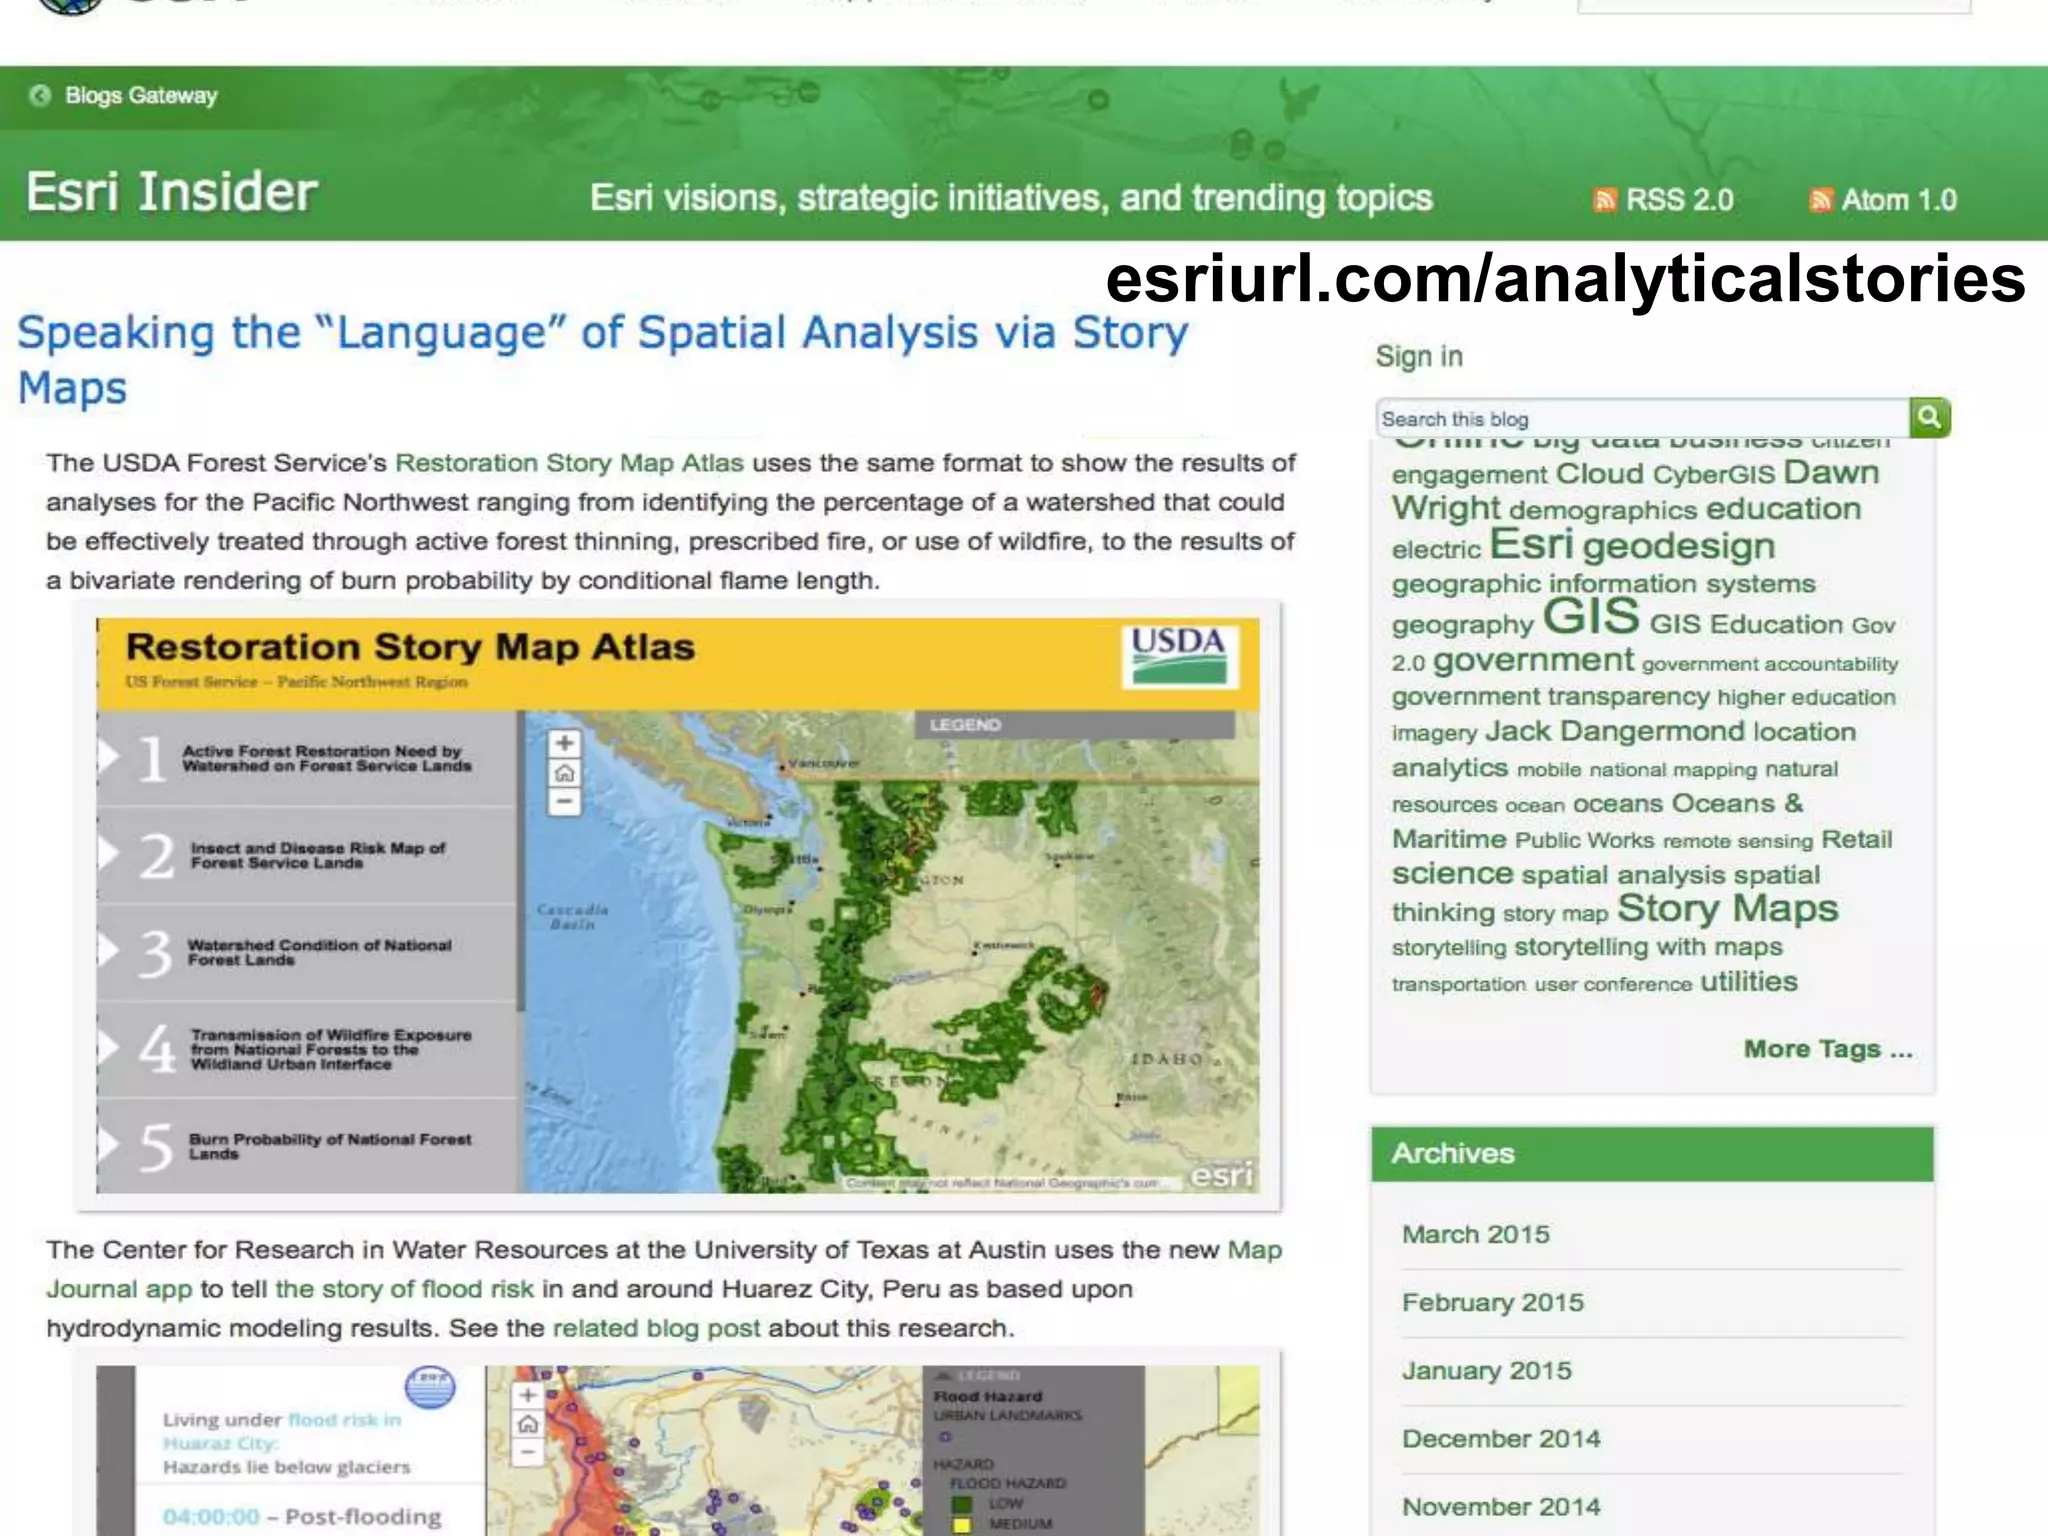


The document discusses ESRI's commitment to advancing scientific understanding through technology integration and collaboration with the scientific community. It emphasizes the importance of addressing fundamental scientific questions related to climate change, ecology, and resource management, while detailing ESRI's initiatives, tools, and partnerships in these areas. Highlights include the development of a global ecological land units map and enhancements in data processing and visualization capabilities for scientists using ESRI technology.


