Downloaded 232 times
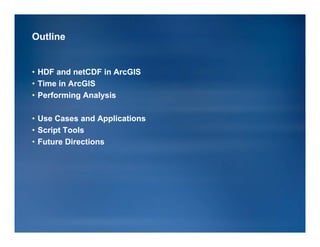
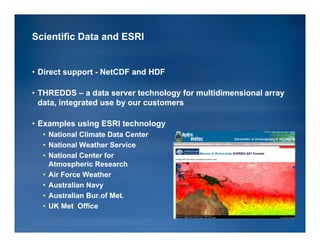
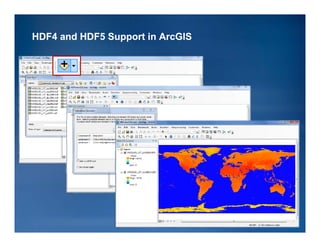
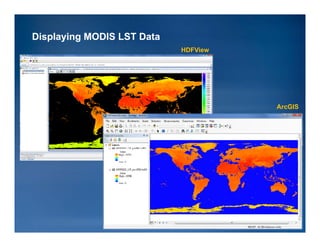
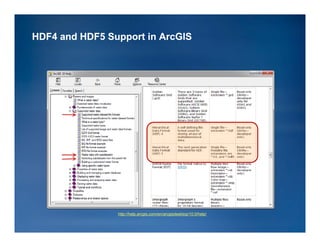
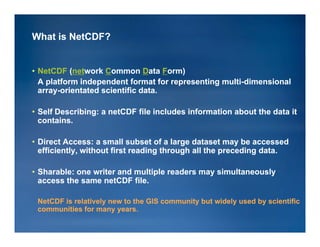
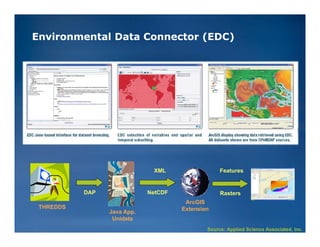


The document discusses the integration of HDF and NetCDF data formats into ArcGIS, focusing on tools, applications, and methods for analyzing scientific data. It outlines features such as multidimensional data support, temporal visualization, and case studies from various organizations and agencies. Future directions include enhancing data management and analysis tools while promoting standards and workflows in utilizing these data formats.