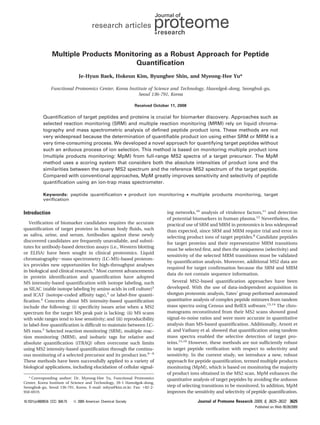
This document describes a new method called multiple products monitoring (MpM) for quantifying target peptides using liquid chromatography-mass spectrometry (LC-MS). MpM monitors multiple product ions from the MS2 spectra of target peptides, rather than selecting a single product ion as in selected/multiple reaction monitoring. It uses a scoring system based on the intensities of matching product ions between the target and reference MS2 spectra. The authors demonstrate that MpM improves sensitivity and selectivity for peptide quantification compared to conventional approaches.
![step. The other type is the targeted LC-MS/MS spectra for the
target precursors (mzXML format). The combined results of the
product ion intensity in the targeted MS2 spectra and spectral
comparisons between the master and targeted MS2 spectra
generate MpM scores. The MpM chromatogram that is recon-
stituted from the MpM scores was used for target peptide
quantification. MpM is a quantitative method that uses the
product ion intensity as the quantitative metric rather than
precursor ion intensity (as is done in both SRM and MRM),
but uses multiple product ions instead of a single product ion.
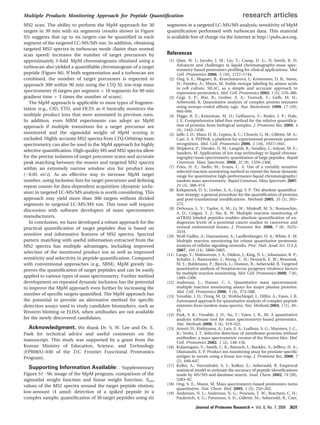
MpM Score Algorithm. The MpM score is the product of
the matched, fragment ion-intensity sum and a scale that
represents the similarity of the query spectrum to the master
spectrum. User-friendly executable software for both MpM
scoring and quantification was implemented in Java language
(Supporting Information, Figure S1).
a. Selecting Product Ions from the Master MS2
Spectrum. During the prescoring step (Figure 2), a mass table
was generated for the product ions which were previously
identified as a-, b-, and y-ions in the master MS2 spectrum.
This table includes a list of m/z values, their intensities, and
their ranks (“Top N”) in terms of intensities of the product ions.
“Top 1” is the most intense ion of all identified product ions
in the master spectrum. The number of top-ranked ions is
determined as (n × 2 - 1), where n is the number of peptide
backbone cleavage sites. The number corresponding to the b1
ion is not included in Top N because, theoretically, it is not
observed after dissociation. Charge states are not considered
because the number of the observed product ions of charges
greater than +2 was not significant. The intensities of the top-
ranked ions in the master spectrum were normalized with
respect to the intensity of “Top 1”.
b. Matching Step. Targeted MS2 spectra within the defined
precursor mass window (default ) (0.1 m/z) were isolated
from the targeted LC-MS/MS run. Full-range targeted MS2
spectra were compared with the master MS2 spectrum one by
one (Figure 2, Matching step). In each comparison, the ions
(m/z) of the master mass table were matched with their
counterparts in the targeted MS2 spectrum. Note that while
the “Top 1” in the master spectrum is generally the base peak,
the “Top 1” in a target MS2 spectrum is not necessarily the
base peak of the target spectrum. After matching, the target
peak intensities of the matched ions are normalized with
respect to the “Top 1” in the target MS2 spectrum. To avoid
useless matching with nonspecific spectra, a target spectrum
is excluded if the intensity of the “Top 1” peak in the target
spectrum is less than 1% of the intensity of the base peak in
the target MS2 spectrum (the default mass window for seeking
the “Top 1” is (0.6 m/z).
c. Scoring Step (Intensity-Based Scoring). Scoring of each
targeted MS2 spectrum is performed using a score function that
considers both the absolute intensity and number of matched
product ions in the target MS2 spectrum (Figure 2). The
equation,
where Ic,t is the absolute intensity of a cross-matched product
ion (c) in a target MS2 spectrum t, ωr is a weight function that
relates the similarities of the normalized intensities of the
matched ions, and ωnmi is a second weight function that relates
the number of matched ions between the query spectrum and
the master spectrum. All weights for MpM scoring range
between 0 and 1. The first weight is defined as ωr ) 1 - |ip,m -
ic,t|, where ip,m is the relative intensity of a product ion (p) in
the master mass table and ic,t is the relative intensity of the
cross-matched ion (c) in the targeted MS2 spectrum. The
second weight function (ωnmi) considers the number of matched
ions between the master and target MS2 spectra and assigns
any unmatched target spectra an extremely low weight factor,
reducing the MpM score substantially. The second weight
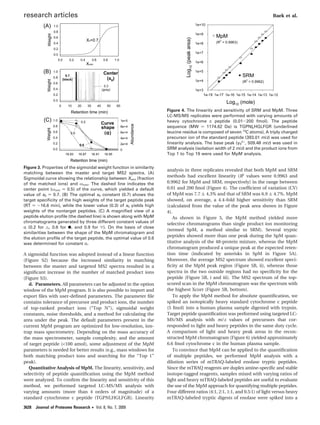
function is defined as a sigmoidal function, ωnmi ) 1/[1 +
exp{-(xnmi - x0)/R}], where xnmi (0-1) is the fraction of matched
ions divided by theoretically maximum number of ions (de-
scribed above as 2n - 1; n is the number of peptide backbone-
cleavage sites), x0 is a constant related to the center point of
the sigmoidal curve, and R is a second constant related to the
curve shape (Figure 3). As shown in Figure 3B and 3C, the
optimal values of the two constants were x0 ) 0.7 and R ) 0.6,
which were used as default values in the MpM algorithm. If
xnmi is greater than 0.7 (i.e., if the cross-matched value is >70%
between the master and target MS2 spectra), the initial MpM
score is almost entirely preserved (ωnmi approaches 1). If the
xnmi is less than 0.7, the MpM score diminishes exponentially.
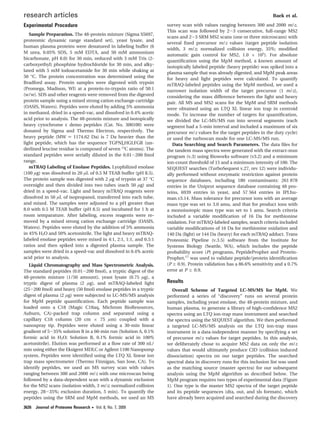
Figure 1. Overall scheme of MpM. Quantification of a target
peptide is performed by comparing a master MS2 spectrum
acquired during the discovery step with targeted MS2 spectra
acquired from an inclusion list for the target precursor. The MpM
chromatogram reconstituted from the MpM scores is used for
quantification of the target peptide.
Figure 2. Scoring process using the MpM approach. Numbers
in the black arrows indicate the normalized intensities of the
product ions in the master MS2 spectrum with respect to the
base peak (i.e., y5
+
). Numbers in the gray arrows indicate
the normalized intensities of the product ions in the targeted MS2
spectra with respect to the “Top 1” in each targeted MS2
spectrum. Lined arrows at the bottom indicate the matched
product ions (marked with asterisks in the targeted MS2 spec-
trum), while dashed arrows with question marks indicate un-
matched ions. Scoring considers both the absolute intensity and
the number of matched product ions in each target MS2
spectrum.
MpM score ) ωnmi ∑(Ic,t × ωr)
Multiple Products Monitoring Approach for Peptide Quantification research articles
Journal of Proteome Research • Vol. 8, No. 7, 2009 3627](https://image.slidesharecdn.com/11f772e1-8f14-4e76-af92-8941eeb244ff-160614054442/85/MpM-3-320.jpg)


![CHROMB17026[1]](https://cdn.slidesharecdn.com/ss_thumbnails/b0d6b51c-4b0a-4d84-b2c7-32fb051a4561-160507012648-thumbnail.jpg?width=640&height=640&fit=bounds)


