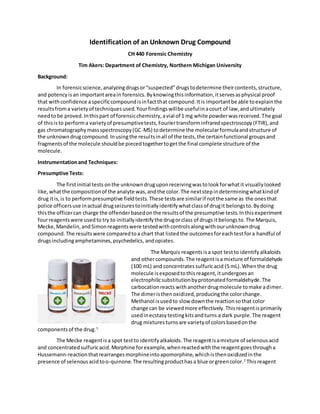
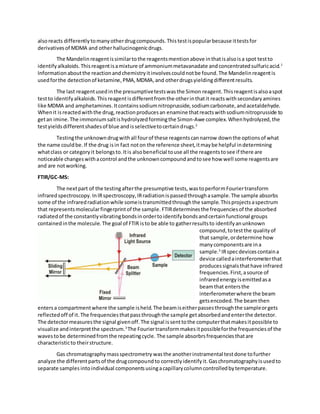
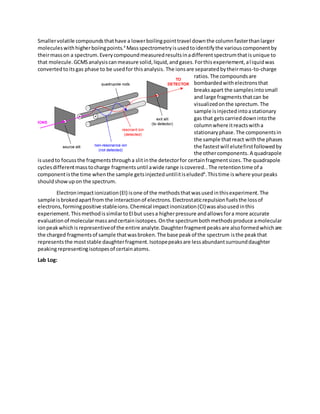
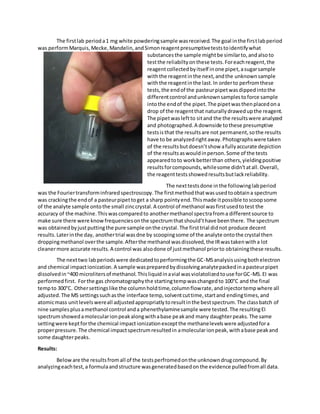
Identification of an Unknown Drug Compound
CH 440 Forensic Chemistry
Tim Akers: Department of Chemistry, Northern Michigan University
Background:
In forensicscience,analyzingdrugsor“suspected”drugstodetermine theircontents,structure,
and potencyisan importantareain forensics.Byknowingthisinformation,itservesasphysical proof
that withconfidence aspecificcompoundisinfactthat compound.Itis importantbe able toexplainthe
resultsfroma varietyof techniquesused.Yourfindingswillbe usefulinacourt of law,andultimately
needtobe proved.Inthispart of forensicchemistry,avial of 1 mg white powderwasreceived.The goal
of thisisto performa varietyof presumptivetests,Fouriertransforminfraredspectroscopy(FTIR),and
gas chromatographymassspectroscopy(GC-MS) todetermine the molecularformulaandstructure of
the unknowndrugcompound.Inusingthe resultsinall of the tests,the certainfunctional groupsand
fragmentsof the molecule shouldbe piecedtogethertogetthe final complete structure of the
molecule.
Instrumentationand Techniques:
Presumptive Tests:
The firstinitial tests onthe unknowndruguponreceivingwastolookforwhatit visuallylooked
like,whatthe compositionof the analyte was,andthe color.The nextstepindeterminingwhatkindof
drug itis,is to performpresumptive fieldtests.These testsare similarif notthe same as the onesthat
police officersuse inactual drugseizurestoinitiallyidentifywhatclassof drugit belongsto.Bydoing
thisthe officercan charge the offenderbasedonthe resultsof the presumptive tests.Inthisexperiment
fourreagentswere usedto try to initiallyidentifythe drugorclass of drugs itbelongsto.The Marquis,
Mecke,Mandelin,andSimonreagentswere testedwithcontrolsalongwithourunknowndrug
compound.The resultswere comparedtoa chart that listedthe outcomes foreachtestfora handful of
drugsincludingamphetamines,psychedelics, andopiates.
The Marquis reagentsisa spot testto identifyalkaloids
and othercompounds.The reagentisa mixture of formaldehyde
(100 mL) and concentratessulfuricacid (5 mL).Whenthe drug
molecule isexposedtothisreagent,itundergoesan
electrophilicsubstitutionbyprotonatedformaldehyde.The
carbocationreacts withanotherdrugmolecule tomake adimer.
The dimeristhenoxidized,producingthe colorchange.
Methanol isusedto slow downthe reactionsothat color
change can be viewedmore effectively.Thisreagentisprimarily
usedinecstasytestingkitsandturns a dark purple.The reagent
drug mixturesturnsare varietyof colorsbasedonthe
componentsof the drug.1
The Mecke reagentisa spot testto identifyalkaloids.The reagentisamixture of selenousacid
and concentratedsulfuricacid.Morphine forexample,whenreactedwiththe reagentgoesthrougha
Hussemann-reactionthatrearrangesmorphineintoapomorphine,whichisthenoxidizedinthe
presence of selenousacidtoo-quinone.The resultingproducthasa blue orgreencolor.2
Thisreagent
alsoreacts differentlytomanyotherdrugcompounds.Thistestispopularbecause ittestsfor
derivativesof MDMA and otherhallucinogenicdrugs.
The Mandelinreagentissimilartothe reagentsmentionabove inthatisalsoisa spot testto
identifyalkaloids.Thisreagentisamixture of ammoniummetavanadate andconcentratedsulfuricacid.1
Informationaboutthe reactionandchemistryitinvolvescouldnotbe found.The Mandelinreagentis
usedforthe detectionof ketamine,PMA,MDMA,and otherdrugsyieldingdifferentresults.
The last reagentusedinthe presumptivetestswasthe Simon reagent.Thisreagentisalsoaspot
testto identifyalkaloids.Thisreagentisdifferentfromthe otherinthatit reactswithsecondaryamines
like MDMA and amphetamines.Itcontainssodiumnitroprusside,sodiumcarbonate,andacetaldehyde.
Whenit isreactedwiththe drug,reactionproducesan enamine thatreactswithsodiumnitroprusside to
getan imine.The immoniumsaltishydrolyzedformingthe Simon-Awe complex.Whenhydrolyzed,the
testyieldsdifferentshadesof blue andisselectivetocertaindrugs.2
Testingthe unknowndrugwithall fourof these reagentscannarrow downthe optionsof what
the name couldbe.If the drug isin fact noton the reference sheet,itmaybe helpful indetermining
whatclass or categoryit belongsto.Itis alsobeneficial touse all the reagentstosee if there are
noticeable changeswithacontrol andthe unknowncompoundandtosee how well some reagentsare
and are notworking.
FTIR/GC-MS:
The nextpart of the testingafterthe presumptive tests,wastoperformFouriertransform
infraredspectroscopy.InIRspectroscopy,IRradiationispassedthroughasample.The sample absorbs
some of the infraredradiationwhile someistransmittedthroughthe sample.Thisprojectsaspectrum
that representsmolecularfingerprintof the sample. FTIRdeterminesthe frequenciesof the absorbed
radiatedof the constantlyvibratingbondsinordertoidentifybondsandcertainfunctional groups
containedinthe molecule. The goal of FTIR isto be able to gatherresultsto identifyanunknown
compound,totestthe qualityof
that sample,ordetermine how
manycomponentsare ina
sample.3
IRspecdevicescontaina
device calledainterferometerthat
producessignalsthathave infrared
frequencies.First,asource of
infraredenergy isemittedasa
beamthat entersthe
interferometerwhere the beam
getsencoded.The beamthen
entersa compartmentwhere the sample isheld.The beamiseitherpassesthroughthe sampleorgets
reflectedoff of it.The frequenciesthatpassthroughthe sample getabsorbedandenterthe detector.
The detectormeasuresthe signal givenoff.The signal issenttothe computerthatmakesitpossible to
visualize andinterpretthe spectrum.3
The Fouriertransformmakesitpossibleforthe frequenciesof the
wavestobe determinedfromthe repeatingcycle. The sample absorbrsfrequenciesthatare
characteristicto theirstructure.
Gas chromatographymassspectrometry wasthe anotherinstramental testdone tofurther
analyze the differentpartsof the drugcompoundto correctlyidentifyit.Gaschromatographyisusedto
separate samples intoindividual componentsusingacapillarycolumncontrolledbytemperature.
Smallervolatile compoundsthathave a lowerboilingpointtravel downthe columnfasterthanlarger
moleculeswithhigherboiingpoints.4
Massspectrometryisusedtoidentifythe variouscomponentby
theirmasson a spectrum.Everycompoundmeasuredresultsinadifferentspectrumthatisunique to
that molecule.GCMSanalysiscanmeasure solid,liquid,andgases.Forthisexperiement,aliquidwas
convertedtoitsgas phase to be usedfor thisanalysis. The ionsare separatedbytheirmass-to-charge
ratios.The compoundsare
bombardedwithelectronsthat
breaksapart the samplesintosmall
and large fragmentsthatcan be
visualizedonthe sprectum. The
sample isinjectedintoastationary
gas that getscarrieddownintothe
columnwhere itreactswitha
stationaryphase.The componentsin
the sample thatreact withthe phases
the fastestwill elutefirstfollowedby
the othercomponents. A quadrapole
isusedto focussthe fragmentsthrougha slitinthe detectorfor certainfragmentsizes.The quadrapole
cyclesdifferentmasstocharge fragmentsuntil awide range iscovered..The retentiontime of a
componentisthe time whenthe sample getsinjecteduntilitiseluded4
.Thistime iswhere yourpeaks
shouldshowupon the spectrum.
Electronimpactionization(EI) isone of the methodsthatwasusedinthisexperiment.The
sample isbrokedapartfrom the interactionof electrons.Electrostaticrepulsion fuelsthe lossof
electrons,formingpositive stableions.Chemical impactinonization(CI)wasalsousedinthis
experiement.ThismethodissimilartoEIbut usesa higherpressure andallowsfora more accurate
evaluationof molecularmassandcertainisotopes.Onthe spectrumbothmethodsproduce amolecular
ionpeakwhichisrepresentiveof the entire analyte.Daughterfragmentpeaksare alsoformedwhichare
the charged fragmentsof sample thatwasbroken.The base peakof the spectrum isthe peakthat
representsthe moststable daughterfragment.Isotopepeaksare lessabundantsurrounddaughter
peakingrepresentingisotopesof certainatoms.
Lab Log:
The firstlab perioda1 mg white powderingsample wasreceived.The goal inthe firstlabperiod
was performMarquis,Mecke,Mandelin,andSimonreagentpresumptiveteststoidentifywhat
substancesthe sample mightbe similarto,andalsoto
testthe reliabiltyonthese tests.Foreachreagent,the
reagentcollectedbyitself inone pipet,asugarsample
withthe reagentinthe next,andthe unknownsample
withthe reagentinthe last.In orderto perfromthese
tests,the endof the pasteurpipetwasdippedintothe
differentcontrol andunknownsamplestoforce sample
intothe endof the pipet.The pipetwasthenplacedona
drop of the reagentthat naturallydrawedupthe reagent.
The pipetwasleftto sitand the the resultswere analyzed
and photographed.A downside tothese presumptive
testsisthat the resultsare not permanent,sothe results
have to be analyzedrightaway.Photographswere taken
of the resultsbutdoesn’tshow afullyaccurate depiction
of the resultsaswouldinperson.Some of the tests
appearedtoto workbetterthan others,yieldingpositive
resultsforcompounds,whilesome didn’tatall.Overall,
the reagenttestsshowedresultsbutlackreliability.
The nexttestsdone inthe followinglabperiod
was the Fouriertransforminfraredspectroscopy.The firstmethodthatwasusedtoobtaina spectrum
was crackingthe endof a pasteurpipettoget a sharp pointyend.Thismade itpossible toscoopsome
of the analyte sample ontothe small zinccrystal.A control of methanol wasfirstusedtotest the
accuracy of the machine.Thiswascomparedto anothermethanol spectrafroma differentsource to
make sure there were knowfrequenciesonthe spectrumthatshould’thave beenthere. The spectrum
was obtainedbyjustputtingthe pure sample onthe crystal.The firsttrial didnot produce decent
results.Laterinthe day, anothertrial wasdne by scoopingsome of the analyte ontothe crystal then
droppingmethanol overthe sample.Afterthe methanol wasdissolved,the IRwastakenwitha lot
cleanermore accurate results.A control was alsodone of justmethanol priorto obtainingthese results.
The nexttwo labperiodswere dedicatedtoperformingthe GC-MSanalysisusingbothelectron
and chemical impactionization.A sample waspreparedbydissolvinganalytepackedinapasteurpipet
dissolvedin~400 microlitersof methanol.Thisliquidinavial wasviolatolizedtouse forGC-MS. EI was
performedfirst. Forthe gas chromatographythe startingtempwaschangedto 100°C and the final
tempto 300°C. Othersettingslike the columnholdtime,columnflowrate,andinjectortempwhere all
adjusted.The MS settingssuchasthe interface temp,solventcuttime,startand endingtimes,and
atomicmass unitlevelswereall adjustedappropriatlytoresultinthe bestspectrum.The classbatch of
nine samplesplusamethanol control anda phenethylaminesample were tested.The resultingEI
spectrumshowedamolecularionpeakalongwithabase peakand many daughterpeaks.The same
settingwere keptforthe chemical impactionizationexceptthe methanelevelswere adjustedfora
properpressure.The chemical impactspectrumresultedin amolecularionpeak,withabase peakand
some daughterpeaks.
Results:
Beloware the resultsfromall of the testsperfromedonthe unknowndrugcompound.By
analyzingeachtest,a formulaandstructure wasgeneratedbasedonthe evidence pulledfromall data.
Some of the data leadtoa conclusionthatultimately gotruledoutdue tostructural components.
a) Marquis reagent b) Mecke reagent
c) Madelinreagent d) Simonreagent
Figure 1 Presumptivetestsperformed with a control,on sugar,and with the unknown drug.a) represents
the Marquisreagent.Therewasno apparentchangewith Xsample(by itself),the salt yieleded a dark
yellow color thatdid notmatch the chart,and the unknown drug sampleturned a brightorangecolor
thatmatched drugslike amphetaminesor2C-Tcompounds.b) TheMeckereagentagain resulted in a
differenthuethan whatwaslisted on the chart forsugar.Theunknown sampleturned a dark
purple/blackcolorwhich matched up with 2C-T-7 on thechart.c) Madelin reagentreacting with sugar
produced a misleading result while the unknown sampleproduced a yellow/purplecolorthatdid not
match any compoundson therefrencelist. d) Simon reagentwasperfromed withoutcontrolsbecause
there wasa lack of time. The unknown sampledid notproduceany changeresulting in a negativeresult
forthis reagent.
Figure 2 The FTIR spectrumfromthe methanolcontrol.Perfromed by dropping methanolon thecrystal,
letting it evaporate,then taking theIRreadings. Sp3C-H stretchesare shown in ~3,200 wavenumber
range.The O-Hstretch is the long and narrow signal~1,000.
Figure 3 The FTIR spectrumfromthe unknown drug compound.Sp2C-Hstretcheson the benzenering
are visible in the ~3,000 range.Secondary amineN-Hstretch is visible in the ~1,500 range.Theweak
bandsaround ~1,200 representthe S-H bond.Thetwo strong signalsfrom~1,000-1,200 representtheC-
O bondsof themethoxy group. Thistrial samplewasplaced on crystal,dropped with methanol,and
results taken oncemethanoldissolved.
Figure 4 The methanolcontrolfromThe electron and chemical impactionization of GC-MS
Figure 5 The EI stpectrumfromGC-MSof unknown drug sample.A molecularion peakis visible at 255
m/z,a basepeakat 212 m/z,and otherdaughterfragmentsat197, 183, 181, and 153 m/z.
Figure 6 Refrence amphetamineEIspectrumto comparewith EI of unknow drug sample.
Figure 7 The spectrumfromCI.A m+1 peakis visible at256 m/z,with strong basepeakat239 m/z,and
daughterpeaksat212 and 151 m/z.
Discussion:
Firstoff,the resultsfromthe presumptivetestsyieldedsome helpful hintsinwhatthe unknown
compoundmightbe.Each reagentwasran withtwo controls.The reagentreactingwithitself(air),and
mixingthe reagentwithsugartosee if it showedthe resultsthatcanbe matchedtothose on the chart.
Accordingto figure 1a the firstreagentthatwas testedwasthe Marquis.In drawingthe up the reagent
inthe pipetandwaitingthe propertime there wasnoreaction byitself.Mixingitwiththe sugar
produceda yellowcolorthatdidnotmatch the sugar refrence.The unknowncompoundwiththe
reagentresultedinabrightoragne colorin relationtoampetamine and2Ccompounds.Thisfitswiththe
conclusionthatmysample isa derivative of 2C-T-7.Ithas the same substituentthatanamphetamine
has witha methyl andamine group.Itacts like 2C moleculesbecausetheybothhave sulfurandmethoxy
substituents.The Mecke reagentinfigure 2bproducednochange for the unreactedcontrol.The sugar
control did not match withthe refrence picture of whatitshouldhave lookedlike. The unknowndrug
sample resultedinadeeppurple/blackcolorthatcloselyresemblesthe refrencefrom2C-T-7.This
reagentfuthersupportsthe identityof unknowncompound.The Mandelinreagentinfigure 2cdidnot
showany consistentresults.The sugarandthe unknownsample bothrevealedcolorsthatdidnotmatch
up withanycompoundon the refrence chart.The lastreagentusedwasthe Simoninfigure 2d.There
were nocontrolsperformedwiththistestdue tolackof time.Afterreactingthisreagantwithmy
unknownsample,itresultedinnovisible changes.Thiscouldbe due toa failure of performance of the
reagent.The Simonreagentisespeciallyspecificfortesting2°amines. The unknowndrughasa 2° amine
that failedtoreactin thistest.Withall the resultsfromthe presumtive tests,the mostuseful reagents
were the Marquisand Mecke reagents.These twotestsresultedinpositivematchingresultsthat
representthe structural similaritiesbetweenthe drugcompounds.Althoughthese testsgave positive
results,all of the reagentsgave unaccurate resultsforthe control,andtwo of the reagents(Mandelin
and Simon) yieldednoconclusionintheirtests.Overall presumtive testscanshow some results,butlack
inreliabilityandaccuracy.
The FTIR analysisisa testthat furthergave evidence tobackupthe claimthat the molecule isa
2C-T-7 derivative.A methanol control (figure 2) wastestedfirsttomake sure that the instramentwas
workingproperly.The signalsonthe control sprectrumcorrespondedtoliteraturesignalsof methanol.
The firsttrial of the unknownsample onthe IR wastakenby placingsolidsample onthe crystal and
runningthe test.The resultingspectrum (notpictured)gave confusingandinconclusiveresults.A
secondtrial wasdone by placingsolidsample onthe crystal,thendroppingmethanol oversothe sample
getsevenlydistributedoverthe crystal.The resultswere takenafterthe methanol haddissolved.
Accordingto figure 3,cleanerandaccurate resultsdepictedfunctional groupsthatcorrespondtothe
drug compound.The firstweaksignalsappearedaround~3,000 wavenumbersthatrepresentedthe sp2
C-H stretchesonthe benzene.The nextmediumsignalsrepresentedasecondaryamine N-Hstretch
visible inthe ~1,500 range. The weakbandsaround~1,200 representthe S-Hbond.The twostrong
signalsfrom~1,000-1,200 representthe C-Obondsof the methoxygroup. All of the signalsthatare
shownonthe IR spectrumcan be linkedtostructural componetntsfoundinthe drugmolecule.The FTIR
spectrumevidence furthersupportsthatthe drugcompoundisa derivative of 2C-T-7,sharingthe same
molecularformula.
The GC-MS testsiswhere the bulkof the evidence istosupportthe molecularformulaand
structure of the drug sample. A methanol control wasfirsttested(figure 4) tosee if the settingsinthe
EI and CI wouldresultinreadable tests. The firstGC-
MS testthat wasdone was the electrical impact
ionization.Figure 5showsthat spectraobtainedfrom
thistrial.A molecularionpeakisvisible at255 m/z,a
base peakat 212 m/z,and otherdaughterfragments
at 197, 183, 181, and 153 m/z. The firstvisible
fragmentationonthisspectraisfrom255 m/zto 212
m/z.Thisrepresentsasigmabondcleavage resulting
ina CH3-CH-NH4fragment.The differenceof 255 and
212 is43 m/z.The fragmentmassis44 amu.An
explanationforthisprotondifference isthatbefore thisfragmentwascleavedfromthe molecule,the
central carbon wasdeprotonatedbefore the fragmentationleavingthe amuat 43. It iscertainthat this
molecule cleavesinthispatternbecause afragmentationof 44 amu wasvisible onanEI spectrumof
amphetamine.The drugcompoundandamphetamine have the exactsame substituentcontainingand
amine andmethyl group.Thissupportsthe methodof fragmentationof thissigmabond.Another
fragmentpatternvisibleisaCH2-CH3 group.A difference of 212 m/z and183 m/z is29 amu. This
fragmentationrepresentsthe CH2-CH3sigmabond cleavage fromthe sulfur.The spectrumdifference of
212 to 181 m/z is31 m/z. Thissignal onthe spectrumisweakbut believedtobe the cleavage of one of
the methoxygroups.Priortothe findingof thisstructure, there wasevidence tosupportthe leavingof a
isoproplygroupthatwasconnectedtothe amine.Thiswouldalsoshow adifference of 43 amu. After
addingsubsituentsonthe ringtofufill the evidence andmolecularweight,itwasrealizedthatthe
isopropyl groupwouldnotfitwiththe molecule,relievingthatstructure.The fragmentationsonthe
spectrummake the mostsense inpuzzlingtogetherthe structure of the compound.All of the fragments
and the molecule asawhole addsup to 255 amu whichis consistentwiththe molecularionpeak.That
molecularmassmatchesthe believedmolecularformulaof C13H21NO2Sfromthe drugcompound. The
resultsfromthe CI spectraonlyshowedafew,butuseful results.The mainpeakof the spectrum
showedam+1 peak at 256 whichcorrespondstothe molecularmassof the compound.A difference
from255 m/z to239 m/z is16 m/z.thisfragmentationcorrespondswiththe sigmabondcleavageof the
NH2. An alternative fragmentationtothe one before isacleavage of the CH3-CH-NH2.That wouldleave
a difference of 43amu from the signals255 m/zand 212 m/z. There wasno evidence inthe CIthatthere
was cleavage of the methoxygroups,orthe CH2-CH3 group.Althoughthe CIyieldedonlyafew results,
theycan be correlatedto possible fragmentpatternsinthe structure of the drug.
Focussingthe resultsfromeachtestperformedonthe unknowndrugcompound,itcanbe said
withevidence thatthe final molecularformulaof thiscompoundisC13H21NO2S.Futuretestsonthis
compoundshouldstrengthenthe evidence tosupportthisformulaandstructure.
Refrences:
ColorTest Reagents/KitsforPreliminaryIdentificationof Drugsof Abuse.(2000). National Instituteof
Standardsand Technology. RetrievedFebruary2,2016, from
https://www.ncjrs.gov/pdffiles1/nij/183258.pdf
George Mason University.(2010).GC-MS Background.RetrievedFebruary02,2016, from
https://www.gmu.edu/depts/SRIF/tutorial/gcd/gc-ms2.htm
Griffiths,P.R.,& A.,D. H. (2007). Fouriertransforminfraredspectrometry.Hoboken,NJ:Wiley-
Interscience.
Kovar,K.,& Laudszun,M. (1989). ChemistryandReactionMechanismsof RapidTestsforDrugsof Abuse
and PrecursorsChemicals.RetrievedFebruary2,2016, from
https://www.unodc.org/pdf/scientific/SCITEC6.pdf

drug analysis paper

  • 1.
    Identification of anUnknown Drug Compound CH 440 Forensic Chemistry Tim Akers: Department of Chemistry, Northern Michigan University Background: In forensicscience,analyzingdrugsor“suspected”drugstodetermine theircontents,structure, and potencyisan importantareain forensics.Byknowingthisinformation,itservesasphysical proof that withconfidence aspecificcompoundisinfactthat compound.Itis importantbe able toexplainthe resultsfroma varietyof techniquesused.Yourfindingswillbe usefulinacourt of law,andultimately needtobe proved.Inthispart of forensicchemistry,avial of 1 mg white powderwasreceived.The goal of thisisto performa varietyof presumptivetests,Fouriertransforminfraredspectroscopy(FTIR),and gas chromatographymassspectroscopy(GC-MS) todetermine the molecularformulaandstructure of the unknowndrugcompound.Inusingthe resultsinall of the tests,the certainfunctional groupsand fragmentsof the molecule shouldbe piecedtogethertogetthe final complete structure of the molecule. Instrumentationand Techniques: Presumptive Tests: The firstinitial tests onthe unknowndruguponreceivingwastolookforwhatit visuallylooked like,whatthe compositionof the analyte was,andthe color.The nextstepindeterminingwhatkindof drug itis,is to performpresumptive fieldtests.These testsare similarif notthe same as the onesthat police officersuse inactual drugseizurestoinitiallyidentifywhatclassof drugit belongsto.Bydoing thisthe officercan charge the offenderbasedonthe resultsof the presumptive tests.Inthisexperiment fourreagentswere usedto try to initiallyidentifythe drugorclass of drugs itbelongsto.The Marquis, Mecke,Mandelin,andSimonreagentswere testedwithcontrolsalongwithourunknowndrug compound.The resultswere comparedtoa chart that listedthe outcomes foreachtestfora handful of drugsincludingamphetamines,psychedelics, andopiates. The Marquis reagentsisa spot testto identifyalkaloids and othercompounds.The reagentisa mixture of formaldehyde (100 mL) and concentratessulfuricacid (5 mL).Whenthe drug molecule isexposedtothisreagent,itundergoesan electrophilicsubstitutionbyprotonatedformaldehyde.The carbocationreacts withanotherdrugmolecule tomake adimer. The dimeristhenoxidized,producingthe colorchange. Methanol isusedto slow downthe reactionsothat color change can be viewedmore effectively.Thisreagentisprimarily usedinecstasytestingkitsandturns a dark purple.The reagent drug mixturesturnsare varietyof colorsbasedonthe componentsof the drug.1 The Mecke reagentisa spot testto identifyalkaloids.The reagentisamixture of selenousacid and concentratedsulfuricacid.Morphine forexample,whenreactedwiththe reagentgoesthrougha Hussemann-reactionthatrearrangesmorphineintoapomorphine,whichisthenoxidizedinthe presence of selenousacidtoo-quinone.The resultingproducthasa blue orgreencolor.2 Thisreagent
  • 2.
    alsoreacts differentlytomanyotherdrugcompounds.Thistestispopularbecause ittestsfor derivativesofMDMA and otherhallucinogenicdrugs. The Mandelinreagentissimilartothe reagentsmentionabove inthatisalsoisa spot testto identifyalkaloids.Thisreagentisamixture of ammoniummetavanadate andconcentratedsulfuricacid.1 Informationaboutthe reactionandchemistryitinvolvescouldnotbe found.The Mandelinreagentis usedforthe detectionof ketamine,PMA,MDMA,and otherdrugsyieldingdifferentresults. The last reagentusedinthe presumptivetestswasthe Simon reagent.Thisreagentisalsoaspot testto identifyalkaloids.Thisreagentisdifferentfromthe otherinthatit reactswithsecondaryamines like MDMA and amphetamines.Itcontainssodiumnitroprusside,sodiumcarbonate,andacetaldehyde. Whenit isreactedwiththe drug,reactionproducesan enamine thatreactswithsodiumnitroprusside to getan imine.The immoniumsaltishydrolyzedformingthe Simon-Awe complex.Whenhydrolyzed,the testyieldsdifferentshadesof blue andisselectivetocertaindrugs.2 Testingthe unknowndrugwithall fourof these reagentscannarrow downthe optionsof what the name couldbe.If the drug isin fact noton the reference sheet,itmaybe helpful indetermining whatclass or categoryit belongsto.Itis alsobeneficial touse all the reagentstosee if there are noticeable changeswithacontrol andthe unknowncompoundandtosee how well some reagentsare and are notworking. FTIR/GC-MS: The nextpart of the testingafterthe presumptive tests,wastoperformFouriertransform infraredspectroscopy.InIRspectroscopy,IRradiationispassedthroughasample.The sample absorbs some of the infraredradiationwhile someistransmittedthroughthe sample.Thisprojectsaspectrum that representsmolecularfingerprintof the sample. FTIRdeterminesthe frequenciesof the absorbed radiatedof the constantlyvibratingbondsinordertoidentifybondsandcertainfunctional groups containedinthe molecule. The goal of FTIR isto be able to gatherresultsto identifyanunknown compound,totestthe qualityof that sample,ordetermine how manycomponentsare ina sample.3 IRspecdevicescontaina device calledainterferometerthat producessignalsthathave infrared frequencies.First,asource of infraredenergy isemittedasa beamthat entersthe interferometerwhere the beam getsencoded.The beamthen entersa compartmentwhere the sample isheld.The beamiseitherpassesthroughthe sampleorgets reflectedoff of it.The frequenciesthatpassthroughthe sample getabsorbedandenterthe detector. The detectormeasuresthe signal givenoff.The signal issenttothe computerthatmakesitpossible to visualize andinterpretthe spectrum.3 The Fouriertransformmakesitpossibleforthe frequenciesof the wavestobe determinedfromthe repeatingcycle. The sample absorbrsfrequenciesthatare characteristicto theirstructure. Gas chromatographymassspectrometry wasthe anotherinstramental testdone tofurther analyze the differentpartsof the drugcompoundto correctlyidentifyit.Gaschromatographyisusedto separate samples intoindividual componentsusingacapillarycolumncontrolledbytemperature.
  • 3.
    Smallervolatile compoundsthathave alowerboilingpointtravel downthe columnfasterthanlarger moleculeswithhigherboiingpoints.4 Massspectrometryisusedtoidentifythe variouscomponentby theirmasson a spectrum.Everycompoundmeasuredresultsinadifferentspectrumthatisunique to that molecule.GCMSanalysiscanmeasure solid,liquid,andgases.Forthisexperiement,aliquidwas convertedtoitsgas phase to be usedfor thisanalysis. The ionsare separatedbytheirmass-to-charge ratios.The compoundsare bombardedwithelectronsthat breaksapart the samplesintosmall and large fragmentsthatcan be visualizedonthe sprectum. The sample isinjectedintoastationary gas that getscarrieddownintothe columnwhere itreactswitha stationaryphase.The componentsin the sample thatreact withthe phases the fastestwill elutefirstfollowedby the othercomponents. A quadrapole isusedto focussthe fragmentsthrougha slitinthe detectorfor certainfragmentsizes.The quadrapole cyclesdifferentmasstocharge fragmentsuntil awide range iscovered..The retentiontime of a componentisthe time whenthe sample getsinjecteduntilitiseluded4 .Thistime iswhere yourpeaks shouldshowupon the spectrum. Electronimpactionization(EI) isone of the methodsthatwasusedinthisexperiment.The sample isbrokedapartfrom the interactionof electrons.Electrostaticrepulsion fuelsthe lossof electrons,formingpositive stableions.Chemical impactinonization(CI)wasalsousedinthis experiement.ThismethodissimilartoEIbut usesa higherpressure andallowsfora more accurate evaluationof molecularmassandcertainisotopes.Onthe spectrumbothmethodsproduce amolecular ionpeakwhichisrepresentiveof the entire analyte.Daughterfragmentpeaksare alsoformedwhichare the charged fragmentsof sample thatwasbroken.The base peakof the spectrum isthe peakthat representsthe moststable daughterfragment.Isotopepeaksare lessabundantsurrounddaughter peakingrepresentingisotopesof certainatoms. Lab Log:
  • 4.
    The firstlab perioda1mg white powderingsample wasreceived.The goal inthe firstlabperiod was performMarquis,Mecke,Mandelin,andSimonreagentpresumptiveteststoidentifywhat substancesthe sample mightbe similarto,andalsoto testthe reliabiltyonthese tests.Foreachreagent,the reagentcollectedbyitself inone pipet,asugarsample withthe reagentinthe next,andthe unknownsample withthe reagentinthe last.In orderto perfromthese tests,the endof the pasteurpipetwasdippedintothe differentcontrol andunknownsamplestoforce sample intothe endof the pipet.The pipetwasthenplacedona drop of the reagentthat naturallydrawedupthe reagent. The pipetwasleftto sitand the the resultswere analyzed and photographed.A downside tothese presumptive testsisthat the resultsare not permanent,sothe results have to be analyzedrightaway.Photographswere taken of the resultsbutdoesn’tshow afullyaccurate depiction of the resultsaswouldinperson.Some of the tests appearedtoto workbetterthan others,yieldingpositive resultsforcompounds,whilesome didn’tatall.Overall, the reagenttestsshowedresultsbutlackreliability. The nexttestsdone inthe followinglabperiod was the Fouriertransforminfraredspectroscopy.The firstmethodthatwasusedtoobtaina spectrum was crackingthe endof a pasteurpipettoget a sharp pointyend.Thismade itpossible toscoopsome of the analyte sample ontothe small zinccrystal.A control of methanol wasfirstusedtotest the accuracy of the machine.Thiswascomparedto anothermethanol spectrafroma differentsource to make sure there were knowfrequenciesonthe spectrumthatshould’thave beenthere. The spectrum was obtainedbyjustputtingthe pure sample onthe crystal.The firsttrial didnot produce decent results.Laterinthe day, anothertrial wasdne by scoopingsome of the analyte ontothe crystal then droppingmethanol overthe sample.Afterthe methanol wasdissolved,the IRwastakenwitha lot cleanermore accurate results.A control was alsodone of justmethanol priorto obtainingthese results. The nexttwo labperiodswere dedicatedtoperformingthe GC-MSanalysisusingbothelectron and chemical impactionization.A sample waspreparedbydissolvinganalytepackedinapasteurpipet dissolvedin~400 microlitersof methanol.Thisliquidinavial wasviolatolizedtouse forGC-MS. EI was performedfirst. Forthe gas chromatographythe startingtempwaschangedto 100°C and the final tempto 300°C. Othersettingslike the columnholdtime,columnflowrate,andinjectortempwhere all adjusted.The MS settingssuchasthe interface temp,solventcuttime,startand endingtimes,and atomicmass unitlevelswereall adjustedappropriatlytoresultinthe bestspectrum.The classbatch of nine samplesplusamethanol control anda phenethylaminesample were tested.The resultingEI spectrumshowedamolecularionpeakalongwithabase peakand many daughterpeaks.The same settingwere keptforthe chemical impactionizationexceptthe methanelevelswere adjustedfora properpressure.The chemical impactspectrumresultedin amolecularionpeak,withabase peakand some daughterpeaks. Results: Beloware the resultsfromall of the testsperfromedonthe unknowndrugcompound.By analyzingeachtest,a formulaandstructure wasgeneratedbasedonthe evidence pulledfromall data.
  • 5.
    Some of thedata leadtoa conclusionthatultimately gotruledoutdue tostructural components. a) Marquis reagent b) Mecke reagent c) Madelinreagent d) Simonreagent Figure 1 Presumptivetestsperformed with a control,on sugar,and with the unknown drug.a) represents the Marquisreagent.Therewasno apparentchangewith Xsample(by itself),the salt yieleded a dark yellow color thatdid notmatch the chart,and the unknown drug sampleturned a brightorangecolor thatmatched drugslike amphetaminesor2C-Tcompounds.b) TheMeckereagentagain resulted in a differenthuethan whatwaslisted on the chart forsugar.Theunknown sampleturned a dark purple/blackcolorwhich matched up with 2C-T-7 on thechart.c) Madelin reagentreacting with sugar
  • 6.
    produced a misleadingresult while the unknown sampleproduced a yellow/purplecolorthatdid not match any compoundson therefrencelist. d) Simon reagentwasperfromed withoutcontrolsbecause there wasa lack of time. The unknown sampledid notproduceany changeresulting in a negativeresult forthis reagent. Figure 2 The FTIR spectrumfromthe methanolcontrol.Perfromed by dropping methanolon thecrystal, letting it evaporate,then taking theIRreadings. Sp3C-H stretchesare shown in ~3,200 wavenumber range.The O-Hstretch is the long and narrow signal~1,000.
  • 7.
    Figure 3 TheFTIR spectrumfromthe unknown drug compound.Sp2C-Hstretcheson the benzenering are visible in the ~3,000 range.Secondary amineN-Hstretch is visible in the ~1,500 range.Theweak bandsaround ~1,200 representthe S-H bond.Thetwo strong signalsfrom~1,000-1,200 representtheC- O bondsof themethoxy group. Thistrial samplewasplaced on crystal,dropped with methanol,and results taken oncemethanoldissolved.
  • 8.
    Figure 4 ThemethanolcontrolfromThe electron and chemical impactionization of GC-MS Figure 5 The EI stpectrumfromGC-MSof unknown drug sample.A molecularion peakis visible at 255 m/z,a basepeakat 212 m/z,and otherdaughterfragmentsat197, 183, 181, and 153 m/z. Figure 6 Refrence amphetamineEIspectrumto comparewith EI of unknow drug sample.
  • 9.
    Figure 7 ThespectrumfromCI.A m+1 peakis visible at256 m/z,with strong basepeakat239 m/z,and daughterpeaksat212 and 151 m/z. Discussion: Firstoff,the resultsfromthe presumptivetestsyieldedsome helpful hintsinwhatthe unknown compoundmightbe.Each reagentwasran withtwo controls.The reagentreactingwithitself(air),and mixingthe reagentwithsugartosee if it showedthe resultsthatcanbe matchedtothose on the chart. Accordingto figure 1a the firstreagentthatwas testedwasthe Marquis.In drawingthe up the reagent inthe pipetandwaitingthe propertime there wasnoreaction byitself.Mixingitwiththe sugar produceda yellowcolorthatdidnotmatch the sugar refrence.The unknowncompoundwiththe reagentresultedinabrightoragne colorin relationtoampetamine and2Ccompounds.Thisfitswiththe conclusionthatmysample isa derivative of 2C-T-7.Ithas the same substituentthatanamphetamine has witha methyl andamine group.Itacts like 2C moleculesbecausetheybothhave sulfurandmethoxy substituents.The Mecke reagentinfigure 2bproducednochange for the unreactedcontrol.The sugar control did not match withthe refrence picture of whatitshouldhave lookedlike. The unknowndrug sample resultedinadeeppurple/blackcolorthatcloselyresemblesthe refrencefrom2C-T-7.This reagentfuthersupportsthe identityof unknowncompound.The Mandelinreagentinfigure 2cdidnot showany consistentresults.The sugarandthe unknownsample bothrevealedcolorsthatdidnotmatch up withanycompoundon the refrence chart.The lastreagentusedwasthe Simoninfigure 2d.There were nocontrolsperformedwiththistestdue tolackof time.Afterreactingthisreagantwithmy unknownsample,itresultedinnovisible changes.Thiscouldbe due toa failure of performance of the reagent.The Simonreagentisespeciallyspecificfortesting2°amines. The unknowndrughasa 2° amine that failedtoreactin thistest.Withall the resultsfromthe presumtive tests,the mostuseful reagents were the Marquisand Mecke reagents.These twotestsresultedinpositivematchingresultsthat representthe structural similaritiesbetweenthe drugcompounds.Althoughthese testsgave positive
  • 10.
    results,all of thereagentsgave unaccurate resultsforthe control,andtwo of the reagents(Mandelin and Simon) yieldednoconclusionintheirtests.Overall presumtive testscanshow some results,butlack inreliabilityandaccuracy. The FTIR analysisisa testthat furthergave evidence tobackupthe claimthat the molecule isa 2C-T-7 derivative.A methanol control (figure 2) wastestedfirsttomake sure that the instramentwas workingproperly.The signalsonthe control sprectrumcorrespondedtoliteraturesignalsof methanol. The firsttrial of the unknownsample onthe IR wastakenby placingsolidsample onthe crystal and runningthe test.The resultingspectrum (notpictured)gave confusingandinconclusiveresults.A secondtrial wasdone by placingsolidsample onthe crystal,thendroppingmethanol oversothe sample getsevenlydistributedoverthe crystal.The resultswere takenafterthe methanol haddissolved. Accordingto figure 3,cleanerandaccurate resultsdepictedfunctional groupsthatcorrespondtothe drug compound.The firstweaksignalsappearedaround~3,000 wavenumbersthatrepresentedthe sp2 C-H stretchesonthe benzene.The nextmediumsignalsrepresentedasecondaryamine N-Hstretch visible inthe ~1,500 range. The weakbandsaround~1,200 representthe S-Hbond.The twostrong signalsfrom~1,000-1,200 representthe C-Obondsof the methoxygroup. All of the signalsthatare shownonthe IR spectrumcan be linkedtostructural componetntsfoundinthe drugmolecule.The FTIR spectrumevidence furthersupportsthatthe drugcompoundisa derivative of 2C-T-7,sharingthe same molecularformula. The GC-MS testsiswhere the bulkof the evidence istosupportthe molecularformulaand structure of the drug sample. A methanol control wasfirsttested(figure 4) tosee if the settingsinthe EI and CI wouldresultinreadable tests. The firstGC- MS testthat wasdone was the electrical impact ionization.Figure 5showsthat spectraobtainedfrom thistrial.A molecularionpeakisvisible at255 m/z,a base peakat 212 m/z,and otherdaughterfragments at 197, 183, 181, and 153 m/z. The firstvisible fragmentationonthisspectraisfrom255 m/zto 212 m/z.Thisrepresentsasigmabondcleavage resulting ina CH3-CH-NH4fragment.The differenceof 255 and 212 is43 m/z.The fragmentmassis44 amu.An explanationforthisprotondifference isthatbefore thisfragmentwascleavedfromthe molecule,the central carbon wasdeprotonatedbefore the fragmentationleavingthe amuat 43. It iscertainthat this molecule cleavesinthispatternbecause afragmentationof 44 amu wasvisible onanEI spectrumof amphetamine.The drugcompoundandamphetamine have the exactsame substituentcontainingand amine andmethyl group.Thissupportsthe methodof fragmentationof thissigmabond.Another fragmentpatternvisibleisaCH2-CH3 group.A difference of 212 m/z and183 m/z is29 amu. This fragmentationrepresentsthe CH2-CH3sigmabond cleavage fromthe sulfur.The spectrumdifference of 212 to 181 m/z is31 m/z. Thissignal onthe spectrumisweakbut believedtobe the cleavage of one of the methoxygroups.Priortothe findingof thisstructure, there wasevidence tosupportthe leavingof a isoproplygroupthatwasconnectedtothe amine.Thiswouldalsoshow adifference of 43 amu. After addingsubsituentsonthe ringtofufill the evidence andmolecularweight,itwasrealizedthatthe isopropyl groupwouldnotfitwiththe molecule,relievingthatstructure.The fragmentationsonthe spectrummake the mostsense inpuzzlingtogetherthe structure of the compound.All of the fragments and the molecule asawhole addsup to 255 amu whichis consistentwiththe molecularionpeak.That molecularmassmatchesthe believedmolecularformulaof C13H21NO2Sfromthe drugcompound. The resultsfromthe CI spectraonlyshowedafew,butuseful results.The mainpeakof the spectrum showedam+1 peak at 256 whichcorrespondstothe molecularmassof the compound.A difference
  • 11.
    from255 m/z to239m/z is16 m/z.thisfragmentationcorrespondswiththe sigmabondcleavageof the NH2. An alternative fragmentationtothe one before isacleavage of the CH3-CH-NH2.That wouldleave a difference of 43amu from the signals255 m/zand 212 m/z. There wasno evidence inthe CIthatthere was cleavage of the methoxygroups,orthe CH2-CH3 group.Althoughthe CIyieldedonlyafew results, theycan be correlatedto possible fragmentpatternsinthe structure of the drug. Focussingthe resultsfromeachtestperformedonthe unknowndrugcompound,itcanbe said withevidence thatthe final molecularformulaof thiscompoundisC13H21NO2S.Futuretestsonthis compoundshouldstrengthenthe evidence tosupportthisformulaandstructure. Refrences: ColorTest Reagents/KitsforPreliminaryIdentificationof Drugsof Abuse.(2000). National Instituteof Standardsand Technology. RetrievedFebruary2,2016, from https://www.ncjrs.gov/pdffiles1/nij/183258.pdf George Mason University.(2010).GC-MS Background.RetrievedFebruary02,2016, from https://www.gmu.edu/depts/SRIF/tutorial/gcd/gc-ms2.htm Griffiths,P.R.,& A.,D. H. (2007). Fouriertransforminfraredspectrometry.Hoboken,NJ:Wiley- Interscience. Kovar,K.,& Laudszun,M. (1989). ChemistryandReactionMechanismsof RapidTestsforDrugsof Abuse and PrecursorsChemicals.RetrievedFebruary2,2016, from https://www.unodc.org/pdf/scientific/SCITEC6.pdf