Theoretical evaluation of shotgun proteomic analysis strategies; Peptide observability and implication of choices in enzymes, technologies and their combinations
Similar to Theoretical evaluation of shotgun proteomic analysis strategies; Peptide observability and implication of choices in enzymes, technologies and their combinations
Similar to Theoretical evaluation of shotgun proteomic analysis strategies; Peptide observability and implication of choices in enzymes, technologies and their combinations (20)
Biochemical Implications of Three-Dimensional Model of Monomeric Actin Bound ...
Theoretical evaluation of shotgun proteomic analysis strategies; Peptide observability and implication of choices in enzymes, technologies and their combinations
1. Theoretical evaluation of shotgun proteomic analysis strategies;
Peptide observability and implication of choices in enzymes,
technologies and their combinations
1
Summary
Proteomics is a powerful high-throughput technique to study thousands of proteins.
Despite the improvements, shotgun proteomics approach is susceptible to sample complexity.
The limited dynamic range and heavily overlapping peptides in LC-MS/MS reduce the efficiency
and probability of peptide identification. Although widely used, such approaches are not
completely understood. There is a lack of studies addressing the characteristics of protein
digests and the efficiencies of their separations under various conditions. In this study we
examine the observability of peptides as well as the separation profile of peptides generated by
proteolysis under 2D-LC-MS/MS or peptide IEF-LC-MS/MS approach in conjunction with
different proteases to better understand overall properties of proteomic peptides.
First, mouse shotgun MS raw data was obtained from a publicly available repository.
The identified peptides and proteins were utilized to optimize amino acid hydrophobicity
coefficients, to predict retention time of peptides, and to build a peptide observability function.
Theoretical peptides by in Silico digestion of mouse proteome with virtual enzymes including
trypsin, chymotrypsin, V8, Lys-C, and Asp-N are applied to peptide observability function to
evaluate the observability of peptides, and the separation profiles by three different separations
techniques such as SAX, SCX, and IEF followed by RP-HPLC coupled with MS/MS analyses.
The application of peptide observability function to the theoretical tryptic digests of
mouse proteins achieved high correlation (R=0.995) to experimentally observed tryptic digests
of mouse proteins by LC-MS/MS, demonstrating that observability function predicts peptide
observability by LC-MS/MS analyses accurately. The evaluation of the theoretical peptides with
observability function suggests SAX/trypsin, IEF/Trypsin as favorable combinations of enzymes
and separation methods. Despite the difference in proteins’ nature in subcellular components,
all observable sub-proteomes showed identical pattern for theoretical separations by methods
evaluated. Overall, our theoretical evaluation of peptides observability and separation profile of
digested peptides provides a valuable foundation for future direction.
Introduction
Proteomics, the experimental investigation of the proteome (PROTEins expressed by
the genOME) is a rapidly developing field of research. Proteomics studies large collection of
proteins which define specific biological systems at a given time. Recent advances in
technology allow researchers to apply proteomics techniques to understand the changes in a
broad range of biological systems such as pathlogical disease states and, stress treatment, as
well as to monitor the efficiency of therapeutic interventions (1-3). Currently there are two
fundamental strategies used in proteomics studies, top-down and bottom-up.
The top-down approach separates and quantifies proteins at the intact protein level.
Most frequently used method for top-down approach is the two-dimensional gel electrophoresis
(2D gel) analysis followed by mass spectrometry to identify protein spots. Recently, mass
spectrometry alone was also utilized to analyze intact proteins as a top-down strategy. In the
bottom-up approach, protein complexes are first subjected to chemical or enzymatic digestion.
The digested peptides are then separated usually by chromatography followed by mass
spectrometry to identify peptide and protein sequences. This is also known as the shotgun
approach.
2. In the shotgun approach, trypsin is widely used to digest proteins to peptides. Trypsin, a
serine protease, cleaves polypeptides immediately after an arginine (R) or a lysine (K). The
cleaved peptides are usually fractionated using strong cation exchange (SCX) column to reduce
the complexity and to allow the identification of low abundant proteins before applying reverse
phase LC-MS/MS(4, 5). Recently, isoelectric focusing was utilized to fractionate tryptic peptides
as a first dimensional separation instead of SCX prior to LC-MS/MS(6-8). The combined
analyses of all fractions represent hundreds or thousands of proteins. With a rapid development
in mass spectrometry techniques, it is expected that proteomics will be utilized routinely to
identify the changes or biomarkers in various patho-physiologic proteomic samples in the future.
However, being able to quantify an individual protein in a complex proteome will require more
effort.
Despite improvements in bottom-up proteomics studies, shotgun proteomics approach
still has known susceptibility to sample complexity. The limited dynamic range of peptide
amounts and heavily overlapping peptide distribution in final LC-MS/MS analysis reduce the
efficiency and probability of peptide identification. These limitations more severely affect the less
abundant proteins that may be mostly functionally important species. There are many
approaches used to address this problem. The pre-fractionation and multi-dimensional
separation are most widely and successfully used techniques. Although widely used, lack of
studies addressing fundamental understanding of digestion of proteins and separation of
digested peptides under such approaches hinder improvements in these technologies.
Therefore, this study was undertaken to examine the observability of peptides as well as
the separation profile of peptides generated by proteolysis under 2D-LC-MS/MS or peptide IEF-LC-
MS/MS approach in conjunction with different proteases to understand better overall
2
properties of proteomic peptides.
3. Experimental procedure
MS/MS data analysis of mouse shotgun proteomics data
The raw shotgun MS/MS data of 10 identical runs for tryptic digests of mouse breast
tissue were acquired from public proteomic data repository (FHCRC proteomics Repository,
http://proteomics.fhcrc.org/CPL/home.html)(9). The raw MS dataset of 10 runs for normal breast
tissue(10) were analyzed using Mascot v.2.1.03(11) to identify the peptide and protein
sequences as separate entries or a single combined .mgf (Mascot generic format) file. Searches
were performed against rodent Swiss-Prot database with carbamidomethylation of cystein, with
partial oxidation of methionine, with 1 missed cleavage allowed, and with mass tolerance of 1.5
Da and of 0.8 Da for MS and MS/MS, respectively. We have used relatively stringent cutoff ion
score of 50 for peptides using Swiss-Prot/UniProt(12) Rodents database (50.3). Ion score 50
was calculated as follows.
The Mascot score is calculated with formula S = , where S = 50 means
probability = 10-5. The probability for peptide to be observed by chance is database size
dependent, so the following calculations are necessary.
Database size Ds = 2.2x10⁵ entries
Average length of protein ln = 360 residues
Average K/R frequency in the sequence fR/fK = 5.9/5.5%, respectively
Total Tryptic peptides N = Ds x ln x (fR+fK) = 2.2x105x3.6x102*1.1x10-1 ! 107
Average length of peptides Lav = Ds x ln / N = 9 residues
Suppose we have a peptide with 9 residues identified by a database search.
Possible sequences for same amino acid composition with 9 residues : 9! ! 3.6x10⁵
With consideration of amino acid frequency such as Leu/Ala ~10% in sequence,
Total number of possible unique sequences Sq = roughly 2x10⁵
Probability to observe this peptide by chance c = 1/ Sq = (2x10⁵)-1 =5x10⁻⁴
Occurrence of this peptide in this database Oc = N x c =107x5x10-4=5x10³
Significance level (p-value 0.05) : Oc x p = 5x10⁻²
Thus, necessary probability p = 0.05/ Oc = 5x10⁻²/5x103 = 10-5
This above is a rough calculation for probability p, but as S is logarithmic, estimation of
order is meaningful. As this calculation is exactly same for M.W., with error range depending on
mass spectrometer, this cutoff score is rather stringent enough. In addition, false discovery rate
for each run calculated using decoy database search was below 0.2%.
The identified peptide and protein lists from total of 10 runs are subjected to in-house
program to extract information such as observed scan numbers, sequences, and protein IDs
and to remove redundant peptides entries. The entries with best peptide probability were taken
among the overlapped peptide entries with same sequence and protein ID. This procedure was
necessary to have single entry for each peptide for parameter optimization. Raw data were also
converted to dta files with header using ReAdW (13) in order to retrieve scan number/retention
time relations.
Optimization of intrinsic amino acid hydrophobicity coefficients
Elution time/scan number information from non-redundant peptide list was obtained from
dta header file of each run. The initial values for hydrophobicity coefficients measured by
Kovacs, JM et al. using synthetic peptides(14) are utilized as starting values for optimization to
make sure convergence of optimized coefficients to be around experimentally determined
values under reversed-phase HPLC conditions. (Note: the values derived from reference
literature are in arbitrary unit which are relative values to poly-glycine. Although unit is arbitrary,
they are only used for further calculations as internal, and intermediate parameters.) The amino
acid compositions of peptides, and observed scan numbers are used to optimize hydrophobicity
3
4. coefficients of amino acid side-chains. The code is written in MATLAB® using function lsqnonlin.
Charged amino acids are split into two entries (for the cases charged residues are located next
to oppositely charged residues including amino and carboxyl-termini) to compensate effects of
nearby charged residues effect. Thus, total 25 amino acid entries are used for optimization.
Following is brief explanation for optimization process.
Amino acid composition matrix for n peptides with m amino acid components is:
4
= ,
!
!
c o= ,
!
!
I dx=
!
!
c o : Hydrophobicity coefficient vector, : peptide hydrophobicity index vector
!
!
c o= +
!
!
" ,
!
!
c o - =
!
!
" (
!
!
" is error vector)
Suppose linear correlations between peptide hydrophobicity index and retention
time/scan number and between scan number and retention time. (
!
!
S c : scan number,
!
!
R t(obs) ,
!
!
R t( pred ) : observed/predicted retention time )
=a+b
!
!
S c ,
!
!
S c =k
!
!
R t(obs) , set k as 1 for simplification, set an error vector
!
!
R t( pred )
!
!
R t(obs)+ ,
!
!
R t( pred )=
!
!
I dx " a
b
, =
!
!
R t( pred ) -
!
!
R t(obs) =
!
c o
b
!
!
R t( pred ) -
!
!
c o
b
"•
- -
!
!
"
b
Define overall error vector
!
!
O +
!
!
"
b
=
!
!
R t( pred ) -
!
"•
- ,
Thus, minimizer is |
!
!
O |2=| =
( is i th component of vector
!
!
R t( pred ) and is i th row of matrix )
The vector
!
!
c o and scalar a, b are optimized by minimizing |
!
!
O |2
Modeling of peptide observability function for LC-MS/MS
Sequences of all proteins identified among 10 runs of LC-MS/MS using Mascot search
with peptides ion score greater than 50 are theoretically digested by in-house program with
trypsin activity (cleaved at the C-terminal side of Lys and Arg). Hydrophobicity index of each
theoretical peptides are calculated by summing up optimized amino acid side-chain
hydrophobicity coefficients. Theoretical distribution of all peptides generated from observed
protein is then filtered with function of peptide hydrophobicity index with two terms that are
designed to indicate “C18 column interaction probability” and “peptide observability by MS”
since probability density functions are probability to start interacting with C18 column or being
observed by MS. It is designed around the error function as it is a good model for cumulative
probability distribution function(15). The function has five parameters as it is described
below (Equation 1),
, Equation 1
: hydrophobicity index, : Error function,
5. Peptides observed and theoretically digested are binned by hydrophobicity index interval of 10.
The sum of squares for difference between observed distribution and theoretical distribution at
the center value of bins is used as minimizer with 5 parameters (A is amplitude or overall
probability, m1,2 are center of sigmoid and d1,2 are width factor of distribution). The optimization is
performed with MATLAB® using function lsqnonlin as well.
Minimizer: |
5
!
!
F |2 = = ,
!
!
p : theoretical values at the center of bins,
!
!
y (obs) :
observed numbers in each bin.
Collection of mouse whole proteome and location specific protein information
LOCATE Subcellular Localization Database (16) is utilized to acquire the sequences of
proteins in various cell compartments. The current released version of LOCATE contains 58128
unique proteins of the mouse. First, proteins are separated into 30 bins by their localization
information. Each cellular compartment is also divided into five classes including cytoplasmic
proteins, secreted proteins, type I membrane proteins, type II membrane proteins, and
multipass transmembrane proteins. In total, 118 (out of 150 possible) subcellular protein
localization sets are formed.
Generation and classification of theoretical proteome digests
Each whole or sub-proteome is subjected to theoretical digestion by 5 virtual enzymes
(Asp-N, V8 protease (V8), Lysyl endopeptidase (Lys-C), Trypsin and Chymotrypsin; table 1). As
occurrence of sequences such as KP, RP are not high, we did not implement precise activities
such as KP, RP rules of trypsin which Lys-Pro and Arg-Pro bonds are rarely cleaved by trypsin.
Exclusion of these rules does not have statistical significance for analysis.
In order to compare separation profiles of peptides under different first dimension
separation techniques, calculation of number of peptide digests as well as theoretical digestions
were performed by in-house programs. The pI values were calculated using an algorithm based
on David L. Tabb (17). The varying pKa values of N-terminal amino and C-terminal carboxyl
groups are used for particular terminal residues unlike calculations for proteins as shorter
peptides terminal pKa can be affected significantly by presence of charges on those terminal
residues. Hydrophobicty index of peptides were calculated using optimized coefficients
described in previous section (modeling of peptide observability function). Both low and neutral
pH conditions have been used for calculations of number of positive or negative charges. The
results at low pH (pH~5) have been shown in this study as it shows better characteristics for ion
exchange separation than neutral pH does. Number of positive and negative charges was
calculated by counting N-termini/Lys/Arg/His residues and C-termini/Asp/Glu residues of peptide
digests, respectively. In this study, we do not consider hydrophobic interactions between ion
exchange bed resins and peptides as it is dependent to column. Moreover, inclusion of organic
solvents would affect the results. We assume that the column is packed with perfect material
that does not have hydrophobic interaction with peptides at all.
Theoretical digests are then binned by different properties and organized into two-dimensional
array form to see correlations among properties. In this study, SCX, SAX,(18, 19)
and peptide IEF followed by RP-HPLC were evaluated by analyzing the hydrophobicity index
and other properties (number of positively/negatively charged residues, pI) for classifying and
analyzing data.
Results
1. MS/MS data analysis of mouse shotgun proteomics data
Total 286 proteins were identified from tryptic digests of mouse breast tissue, which are
applied to LC-MS/MS in 10 separate runs (10) and then to Mascot database search to identify
peptides and protein sequences. Each single run identified around 500 tryptic peptides and 150
6. proteins in which an average 45% of proteins are identified with a single peptide (Table 1). By
combining 10 runs, the number of identified peptides and proteins increased to 1107 and 286,
respectively, compared to averages of single LC-MS/MS runs, 526 and 148, respectively. The
proteins identified with a single peptide decreased slightly to 40% by combining 10 single runs
compared to the single runs ranging 41% to 54 %. The data of combined 10 runs that 60% of
the proteins (173 out of 286 identified proteins) are identified with multiple peptides and
sufficiently high Mascot score (above 50) were utilized to build an optimizer and peptide
observability function (20).
2. Optimization of amino acid side-chain hydrophobicity coefficients
In order to estimate separation of peptide by RP-HPLC, hydrophobicity coefficients were
optimized using data from observed peptides under the condition for RP-HPLC separation (pH
~2 and changing organic concentration) since other interactions such as ion-pair formation (LC
runs are performed with 0.1% formic acid for this data set) in addition to hydrophobic interaction
attribute to retention of peptides in the column (21). The sum of hydrophobicity coefficients of
amino acids represents peptide hydrophobicity. The interaction of peptide with C18 column can
be estimated from these coefficients with relatively good accuracy (22-24).
All identified peptides with Mascot ion scores 50 or above and the best peptide
probabilities if observed multiple times, are used in the dataset for coefficient optimization using
least-square non-linear minimization. The residue hydrophobicity coefficients are computed
along with linear correlation coefficients a and b. The distribution of observed and predicted
scan numbers for our dataset has R2, 0.87, meaning that 87% of the variability in predicted scan
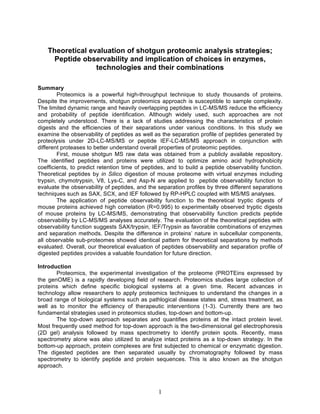
number was explained by observed scan number (Figure 1). In addition, error estimation
demonstrates that it is good enough for proceeding to further calculations as propagated error
throughout process still remains up to 10% level (R=0.93 with mean error 0.1 and standard error
0.003; supplemental text: error analysis).
3. Building peptide “observability” function
Computed hydrophobicity coefficients were used to calculate hydrophobicity indexes of
observed and theoretical peptides that are derived from identified mouse proteins by LC-MS/MS
analyses as described in Materials and Methods. The parameter optimization for function was
performed with observed scan numbers of identified peptides and with scan numbers of
theoretical peptides calculated with optimized hydrophobicity coefficients. The non-linear least
square minimization between observed distribution and theoretical-filtered distribution was
performed and optimized parameters are computed (Figure 2. See also equation 1 in Materials
and Methods. A=0.265, m1=47.7, m2=173.8, d1=24.1, d2=25.6). The peptide observability
function used for filtering theoretical peptides is composed of two terms. The first term, “C18
column interaction” is supposed to be a right-up sigmoidal function; conversely, “MS
observability” term is a left-up sigmoidal function. Rational for this design is the following. The
interaction term is a right-up curve as more hydrophobic peptides interact stronger with C18
column. At a certain point in index, all peptides interact strongly enough with column, thus
probability of interaction is 1. Sigmoidal error function is chosen as it indicates cumulative
probability density function, i.e. a probability function of possibly “starting an interaction”. Also,
second term, “MS observability” is designed in opposite way as low index region has high, and
high index has low probability to be observed. The low index region is set as 1 for this term
since these low index regions are influenced more by peptide interaction with column, rather
than by factors contributing MS observability. Probability of observation by LC-MS/MS
decreases as indices become high due to factors such as large average size of peptides, which
can be out of scan range, and low fragmentation/identification efficiencies by MS/MS. Peptides
with very high hydrophobicity index may be insoluble in aqueous solvent or hard to elute from
column. Interestingly, the two terms of functions reach a plateau and start descending at almost
6
7. same place. As a result, the filtered distribution becomes Poisson distribution-like with no
apparent plateau. The distribution of theoretical peptides filtered by peptide observability
function shows a bell-shaped function slightly tailed to higher index direction, which is similar to
the distribution of observed non-redundant peptides combined from 10 LC-MS/MS runs (Figure
2). Filtering of theoretical peptides by peptide observability function results in high correlation
between hydrophobicity indexes of observed peptides and filtered theoretical peptides as it
shows the correlation coefficient r=0.995.
Digestion of theoretical mouse proteins by listed enzymes (Asp-N, V8, Lys-C,
chymotrypsin, and trypsin) generates peptides ranging from 734,936 to 2,916,283 peptides and
the application of peptide observability function filtered out approximately 90% of peptides
generated by Asp-N, V8, Lys-C, or trypsin and 95% of peptides generated by chymotrypsin
(Table 2). Chymotrypsin generates 2,916,283 peptides with numerous small peptides (average
length of peptides and m/z, 4.7 and 382, table 2), which were filtered out by peptide
observability function.
The filtration by peptide observability function resulted in similar percentage of
observable peptides of both multiple-span transmembrane proteins (MTMP) and whole
proteome digested by typsin. A 93% of peptides of MTMP digests were filtered out while 94% of
peptides of whole proteome digests were filtered out by peptide observability function. Tryptic
peptides that are filtered by peptide observability function without MS observability term (figure
6) represents population that interact with C-18 column (low hydrophobicity index peptides are
filtered out) and potentially observed by LC-MS/MS. These populations for both whole proteome
and MTMP sub-proteome have 14 % and 42% of peptides that are filtered out by MS
observability term (18997 out of 130793 for whole proteome vs. 4462 out of 10538 for MTMP).
These represent that MTMP has more percentages of peptides with high hydrophobicity index
than whole proteomes.
4. Evaluation of 2D-LC-MS/MS and peptide IEF-LC-MS/MS strategies
4.1. Consideration for evaluation of the enzymes and strategies
To analyze separation profile of peptides under different strategies, the theoretical
distribution of peptides digested by several different enzymes such as ones specific to
negatively charged residues (Asp-N, and V8), positively charged residues (trypsin and Lyc-C),
or hydrophobic residues (chymotrypsin) with several 1st dimensional separation methods (SCX,
SAX, IEF) and 2nd dimensional separation (RP-HPLC) were evaluated. Particularly, first
dimension in multi-dimensional Protein Isolation Technology (MudPIT) is critical for reducing
complexity of sample in LC-MS/MS analysis. Accordingly, the wider and flatter distribution over
the characteristics used in 1st dimensional technique may result in better separation in 1st
dimention separation and eventually reduce the complexity in LC-MS/MS. Charge distribution
(positive and negative charges) was analyzed to evaluate ion exchange separation (SCX and
SAX, respectively) (25). For peptide IEF, pI distribution of peptides was used as it indicates
separation by this method. The distribution of hydrophobicity is analyzed with all 1st dimension
separation methods as it indicates separation by RP-HPLC in 2nd dimension.
Another indirect but also important characteristic is the charge state distribution by MS
(assuming ESI ionization). This impacts MS/MS data quality, coverage of fragments ions and
accordingly database search results. Large population of singly charged peptides is not
favorable as it gives ion series mostly only b-series and lacking y-series. The singly charged
peptides with MS/MS spectra in which only b-series ions, give significantly lower scores than
both b- and y-series which are always observed with doubly or multiply charged peptides (26).
Also multiple charges (more than +2) are not favorable in general. Firstly, there is the
MW scan range issue. Usually scans for MS is not set to very high mass range due to scan
speed, and number of MS/MS scans. Suppose the scan range is set to 2,000 and MS send the
7
8. ion with +3 charge and m/z 1200, singly charged peptide would be 3,600 Da. Depending on the
distribution of charged residues within the sequence, it is likely to lose almost half of fragment
ions because m/z values are out of scan range. Secondly, fragmentation efficiency does not
favor highly charged peptides. The observed peptides with high number of charged residues
tend to have more residues (longer) and efficiency of CID goes down by length of peptide
(reduced probability of cleavage at particular bond). Thus, we may see intense MS signal but
poor MS/MS spectrum. Thirdly, there is a bias in database search results in Mascot (26).
SEQUEST handles triply charged ions in the same way as doubly charged peptides but Mascot
scores triply charged ions as low as singly charged ions. Although we do not have data for X!
Tandem, it is clear that one of the most widely used database search engine has bias against
multiply charged peptides. In addition to biased search scores of search engines, the
complicated charge states of fragments makes interpretation difficult. Thus, multiply charged
peptides are not considered favorable.
4.2. Protein digestion by protease
Chymotrypsin and trypsin generated a lot of peptide digests (143866 and 130808,
respevtively) compared to Asp-N, V8, and Lyc-C (90067, 104500, and 82487, respectively).
Even though chymotrypsin produces a large number of peptides, 75 % of generated peptides
are singly charged which compete with other peptides but it will not observed with good MS/MS
fragment coverage due to lack of complementary series within spectra (26). Asp-N and V8
produce 20~25% of peptides (19102 out of 90061 and 26777 out of 104493 observable
peptides digested by Asp-N and V8 respectively) with single charge which are not favorable for
analyses. On the other hand, small population of tryptic and Lys-C peptides that are C-terminal
peptides (~2%) are singly charged.
4.3. Peptide IEF-LC-MS/MS approach
The peptide IEF on whole mouse proteome was reported as a good method for
separation of peptides prior to regular reversed-phase LC-MS/MS analysis (7, 27, 28). Although
Asp-N and V8 produce peptides widely distributed in both hydrophobicity index and pI, as
shown in inset of Figure 3, these enzymes produce 20~25% of peptides with single charge
which are not favorable for analyses. The number of peptides generated by trypsin is about 60%
more compared to ones generated by Lys-C, however, those 60 % tryptic peptides are
distributed in acidic and neutral pI as Figure 3 indicates. 28%, 16% and 9 % of typtic digest and
20%, 13%, and 13% of Lys-C peptides are distributed to most populated pI ranges of 4.0~4.5,
7.0~7.5 and 9.5~10.0, respectively.
4.4. SCX-LC-MS/MS approach
The SCX is a technique widely used for multi-dimensional LC-MS/MS. The number of
positive charges is a major factor for SCX peptide separation (29). The distribution for number
of positively charged residues is a good indication of the peptide separation efficiency by SCX
approach. After filtering by peptide observability function, we classified digests by
hydrophobicity index and number of positive charges including amino terminus and Arg/Lys/His
residues. Tryptic digest shows very poor distribution for positive charges as 2%, 79%, 12% and
5% of peptides are distributed to +1,+2,+3 and +4 charges, respectively. As shown in Figure 4,
digested peptides by enzymes specific to negatively charged residue such as Asp-N and V8
and to basic residue, Lys-C show relatively wide distribution over charges and hydrophobic
index.
4.5. SAX-LC-MS/MS approach
All enzymes except chymotrypsin produce a wide distribution for number of negative
charges (Figure 5). Lys-C and trypsin digests show wide and uniform charge distribution (15%,
8
9. 21% 20%, 15% and 11% of Lys-C digests and generates 24%, 27%, 21% 13% and 7% of
trypsin over -1 to -5 charges) while peptides digested by Asp-N and V8 have only 1.1 % of
peptides with -1 charge. Actual numbers of tryptic peptides are almost double for -1 to -4
chargeed peptides compared to Lys-C peptides (1.85 times more for trypsin) however, tryptic
and Lys-C peptides with -5 and more charges have similar numbers of peptides and similar
distribution (total 23090 and 20487 for Lys-C and trypsin, respectively, Figure 6). Overall, trypsin
has good charge distribution with more peptides while Lys-C generates fewer amounts of
peptides with wide and uniform distribution.
5. Evaluation of sub-fractionation with MudPIT techniques
To evaluate proteome analyses for sub-cellular components and membrane proteins, we
have examined the three techniques widely available to proteomic analyses in conjunction with
choice of enzymes. These include the peptide IEF with Lys-C or trypsin, SCX with Lys-C or Asp-
N, and SAX with Lys-C or trypsin, which were demonstrated to have relatively good separation
of peptide digests (refer to Section 4). The proteins are classified by cellular localizations such
as cytoplasm, ER, lysosome, mitochondria, and nucleus, which are functionally important for
biological viewpoint and its cellular separation has been utilized for numerous studies. The
proteins are also classified in cytoplasmic, type-I, type-II, secretome and multiple-span
transmembrane proteins (MTMP).
All sub-proteomes by cellular localization and whole proteome showed almost identical
distributions regardless the combinations of an enzyme and a technique (supplemental Figure
1). Same combinations of a technique and an enzyme are used to evaluate the membrane
proteins (supplemental Figure 2). The results indicate the same results as sub-cellular
components. MTMP show relatively flat distributions among pI ranges by peptide IEF compared
to the other acidic peptide dominant distributions.
Overall, we do not see any major difference among different subcellular components or
classes of membrane/cytosomal proteins. As a proteome, if there is enough number of proteins,
observable proteomes are all alike in terms of peptides generated from them. As we have
covered whole mouse proteome in this study, it is reasonable to deduce that this strategy may
work for all eukaryote proteomes.
Discussion
Modeling of peptide observability function for LC-MS/MS
The constructed model efficiently demonstrated prediction of MS observability of
theoretical peptides as the theoretical peptides show high correlation to actually observed
peptides with correlation coefficient R=0.995. Theoretical tryptic peptides that are derived from
286 proteins that are identified with Mascot ion score >50 have very high population between
observability index value -30 and -20 due to short basic peptides such as single Lys/Arg or Xaa-
Lys, Xaa-Arg (Figure 2, distribution of theoretical peptides). These short peptides may not
interact with C-18 column and may pass through the column. They could skew the overall result,
if they remain in the dataset. Thus, filtering the peptides with peptide observability function is an
important process to see the un-skewed results or more likely to be observed, real-world results.
The modeling of peptide observability function in this study, do not use any quantitative
information, as it is ambiguous to assign “quantity” information to each protein entry without
actual quantitative data. Thus, amplitude parameter for filtering function is assumed to be an
average for observed protein. Low abundant proteins may not be accounted in this study.
However, the construction of filtering function is based on observed peptides by real LC-MS/MS
analyses and although there is no actual quantitative information, the datasets themselves have
9
10. the information that observed peptides are abundant enough. As shown in results, this study
demonstrates that sub-proteomes and classes of membrane protein behave same way as long
as enough number of proteins is sampled. Also, there is no reason to believe that the proteome
from other species (at least eukaryotes) would behave differently. Thus, it is reasonable to
consider the filtering function proposed as universally applicable to any proteome.
Evaluation of 2D-LC-MS/MS and peptide IEF-LC-MS/MS strategies
As HPLC has non-comparable high separation power for peptides and extremely high
compatibility with MS platform, it is natural choice to use for separation technique directly
coupled to MS analysis. Charge-based separations such as ion exchanges and IEF are ideal
orthogonal, complementary technologies to be combined with hydrophobicity-based HPLC
separation as they are based on different physicochemical principles for separation.
Although the importance and wide usage of shotgun proteomics approaches, there is no
thorough evaluation of technologies. SCX-trypsin approach is taken so frequently as first choice
for MudPIT. Peng et al. have clearly shown that number of charges of peptides (His and miss-cleavages)
is clearly the most important factor for separating peptides using SCX approach (25,
29). Conversely, if there are peptides with different number of charges, the separation efficiency
of peptides using ion exchange column will increase. It is confirmed recently by Taouatas et al.
by using Lys-N with SCX(30). Although the development of mixed-bed approach for ion
exchange column, use of pH steps, Lys-N with low pH SCX and mixed-mode hydrophilic/cation
exchange technique (30-34) improves the separation by SCX, the subtle difference between the
pKa of Lys/Arg with same number of charges fails to separate the peptide efficiently, resulting in
peptide re-sampling in different fractions (34, 35). For SCX-trypsin strategy, pH step would be a
better strategy as pI of the peptide plays a role in elution and makes it a hybrid approach
between regular SCX and peptide IEF. For conventional strategies, this study suggests that
SAX/trypsin, SCX/Asp-N, SCX/Lys-C or peptide IEF/trypsin gives relatively good separation
profile of digested peptides among all combinations analyzed as first dimension separation of
peptides and peptidase. When the charge states of peptides were considered, SCX/Asp-N may
have potential setback since as many as 30% of observable peptides are singly charged. On
the other hand, the distribution of peptides over positive charges is obviously superior with Asp-
N and Lys-C (Figure 4). So far, we did not consider properties of proteases. It is well known that
Lys-C has extremely strict specificity and robustness of activity. Complex proteomes would
need a “complete” digest to acquire maximum number of peptides and also to generate the
simplest population. The miss-cleavages would not improve the coverage but would increase
complexity. In terms of enzyme activity, Lys-C is far superior to Asp-N. Thus, overall
effectiveness of these two enzymes in combination with SCX should be experimentally
evaluated. Also, the result would be dependent on the search engine used as shown by Kapp et
al. SEQUEST handles triply charged ions same as doubly charged ions. On the other hand,
Mascot scores triply charged peptides are as low as singly charged ions. Thus, it is important to
note that the peptides with SCX/Lys-C and SCX/Asp-N are distributed from 1 to 10 and majority
of peptides (79% and 67% for Lys-C and Asp-N), which are possible charge states over +2, will
be scored with bias (Figure 6, top panel).
The SAX has not employed for 2D-LC-MS/MS so commonly even though anion
exchange resin such as DEAE, Mono-Q are one of the most frequently used resins for protein
purification. Isobe’s group reported separation of full proteome by anion exchange for first
dimension. Full proteomes of C. elegans(36) and mouse embryonic stem cells(37) were
subjected to proteomic analysis utilizing SAX for 1st dimension separation and LC-MS/MS for
2nd dimension. The group reported 1616 and 1790 proteins (p<0.005), half of them were
identified with a single peptide. Both reports utilized 70 min linear gradient (5-40% acetonitrile)
and identified 2000~4000 unique peptides with p-value below 0.05 from total 4 and 6 runs while
SCX/trypsin typically identifies 500~2000(38-40). Our analysis indicats SAX/trypsin as a good
10
11. combination for proteomics analysis and it is supported by the study performed by Nakamura et
al. The study reports that more than twice as much peptides were observed by SAX compared
to SCX (~3500 and ~1500 by single run, respectively) with less fraction overlap, significantly
better separation of standard BSA digests(41). Trypsin is quite robust and has high specificity.
Tryptic peptides always have +2 charges except small population of C-terminal and His-containing
peptides. Hence, tryptic peptides always have a high probability to give good MS/MS
identification and simpler interpretation compared to multiply charged peptides. The distribution
of negative charge is as wide as distribution of positive charge for Asp-N peptides so that the
separation by SAX is expected to be excellent. With combination of completely volatile buffer
system such as hexafuloroaceton-ammonium system (or more conventional ammonium
bicarbonate) and neutral and volatile salts such as ammonium chloride or ammonium formate,
SAX/trypsin system may be very effective, MS-compatible first dimension system.
Peptide IEF is potentially a good technology although current implementation or
achieved technical level does not match with the other two techniques. IPG-peptide IEF can
achieve-high resolution separation(7) and has good potential although extraction of peptides
from IPG by equilibrium would lose most of low abundant proteins with high volume of extraction
buffer. The biggest problem stems from bulky apparatus that impose huge amount of initial
sample amount and also loss of sample during the process. If technology is further improved
with micro-scale apparatus(28) with pI range of 0.5 for separation, it has highest separation
capability with descent to good peptide distribution among pI ranges.
We have examined a full proteome with various strategies. Analysis suggests
SAX/trypsin or peptide-IEF/trypsin as a good combination of techniques that can be used.
Although both techniques have good quality of first dimensional separation, however, each
fraction may still contain more peptides than that can be separated by both combinations (for
example, the number of -2 charged peptides are 35041 in SAX/trypsin even after filtering). It
would be necessary to implement a technique such as a pH step to facilitate separation among
same charge states in order to achieve better separation. Overall, some factors such as charge
state/search engine bias, low fragment ion observability due to the size of fragment ions that is
exceeding m/z values beyond scan range, or decreased fragmentation efficiency needs to be
considered before experiments are designed.
Evaluation of sub-fractionation with MudPIT techniques
The results suggest that there is no need to use different strategies among different
subcellular components or the classes of membrane proteins. This also implies that the protein
abundance is the major factor for proteins to be observed. The dynamic range is one of the
problems for shotgun proteomics. The peptides from highly abundant proteins within the
proteome hinders detection of low abundance proteins not only by overlapping/covering them
with the peptides from low abundance proteins but also limiting actual amount of low abundance
proteins per loading amount. The collection of subcellular components or membrane fractions
will only contain its own sub-proteome without highly abundant proteins such as cytoskeletal
proteins or enzymes for respiratory system and fractionation of these components will simply
increase the amount of proteins per loading. As our data indicate that there is no difference
among the distributions of observable peptides generated from different subcellular
components, observable peptides will increase as their amounts increase to enough for LC-MS/
11
MS detections.
Subcellular fractionation serves as an enrichment technique and allows detection of low
abundance proteins specifically expressed in particular organelles. Although loading sample
amount and number of peptides uniquely identified have positive correlations, at a certain point,
number of identified peptides declines even with higher amount of loaded sample(42). It is
thought due to matrix effects as peptides that do not show correlation between observability and
loading amount are observed in clouded area in chromatogram. Simply increasing loading
12. amount does not improve peptide/protein identification but sample complexity needs to be
addressed to solve matrix effects and co-elution in MS analysis. Thus, fractionation eases both
issue of sample loading amount per protein and reduction of sample complexity.
Hydrophobic long peptides are highly abundant in membrane proteins and these highly
hydrophobic peptides show low “observability” in LC-MS/MS identification (Figure 7). These
peptides may be too hydrophobic to be eluted or insoluble. In our experiences, these peptides
tend to stay in column and eluted for prolonged time with leaky manner, contaminating the LC
system. Even regular peptides can be problematic in this regard and there is absolute necessity
of blank wash run for column after every single run of analysis, this may pose major problem of
run-to-run contamination if not handled carefully.
The proteome analyses could be direct determination techniques of localization if
applied to subcellular components although careful validation would be necessary to assess
contaminations from whole cell proteome. It is a discovery-based technique and unlike tagging
techniques such as GFP-tag, no prior knowledge for targets is necessary. In that way, we can
access rich protein localization information. As we are approaching to systems biology as a
mainstream research field, protein localization data are also extremely important. In this study,
we acquired the protein localization information from the LOCATE database. In this dataset,
some components are extracted from literature or gene ontology. However, some entries were
ambiguous. Increase of available experimental data for protein localization improves the
accuracy of databases such as LOCATE. For building interaction networks and other systems
approaches, such system wide databases are quite useful(43). Thus, more accurate
determination of subcellular localization is an important task to be completed.
Conclusions
Proteomics is a powerful technique to study thousands of proteins. However, large-scale
proteomic analyses are extremely human/machine labor intensive and expensive. The
theoretical evaluation of peptides’ observability as well as different separation techniques allows
researchers to choose the most appropriate methods suited for the analysis of the biological
system studied. In addition, this can save time and money, because invaluable experimental
proteomics data available through various public repositories can be reused (9, 44, 45). Overall,
our theoretical evaluation of peptides’ observability and separation using several combinations
of currently available separation techniques captures the current state-of-the-art proteomics and
provides a valuable foundation for future directions though it remains experimental validation of
these study.
12
13. References
1. Chelius, D., and Bondarenko, P. V. (2002) Quantitative profiling of proteins in complex
mixtures using liquid chromatography and mass spectrometry. Journal of proteome research 1,
Page.
2. Tao, W. A., and Aebersold, R. (2003) Advances in quantitative proteomics via stable
isotope tagging and mass spectrometry. Current opinion in biotechnology 14, Page.
3. Wang, W., Zhou, H., Lin, H., Roy, S., Shaler, T. A., Hill, L. R., Norton, S., Kumar, P.,
Anderle, M., and Becker, C. H. (2003) Quantification of proteins and metabolites by mass
spectrometry without isotopic labeling or spiked standards. Analytical chemistry 75, Page.
4. Washburn, M. P., Wolters, D., and Yates, J. R., 3rd (2001) Large-scale analysis of the
yeast proteome by multidimensional protein identification technology. Nat Biotechnol 19, Page.
5. Wu, C. C., and Yates, J. R., 3rd (2003) The application of mass spectrometry to
membrane proteomics. Nat Biotechnol 21, Page.
6. Cargile, B. J., Sevinsky, J. R., Essader, A. S., Stephenson, J. L., Jr., and Bundy, J. L.
(2005) Immobilized pH gradient isoelectric focusing as a first-dimension separation in shotgun
proteomics. J Biomol Tech 16, Page.
7. Chick, J. M., Haynes, P. A., Molloy, M. P., Bjellqvist, B., Baker, M. S., and Len, A. C.
(2008) Characterization of the rat liver membrane proteome using peptide immobilized pH
gradient isoelectric focusing. J Proteome Res 7, Page.
8. Eriksson, H., Lengqvist, J., Hedlund, J., Uhlen, K., Orre, L. M., Bjellqvist, B., Persson,
B., Lehtio, J., and Jakobsson, P. J. (2008) Quantitative membrane proteomics applying narrow
range peptide isoelectric focusing for studies of small cell lung cancer resistance mechanisms.
Proteomics 8, Page.
9. Rauch, A., Bellew, M., Eng, J., Fitzgibbon, M., Holzman, T., Hussey, P., Igra, M.,
Maclean, B., Lin, C. W., Detter, A., Fang, R., Faca, V., Gafken, P., Zhang, H., Whiteaker, J.,
States, D., Hanash, S., Paulovich, A., and McIntosh, M. W. (2006) Computational Proteomics
Analysis System (CPAS): an extensible, open-source analytic system for evaluating and
publishing proteomic data and high throughput biological experiments. J Proteome Res 5, Page.
10. Whiteaker, J. R., Zhang, H., Zhao, L., Wang, P., Kelly-Spratt, K. S., Ivey, R. G., Piening,
B. D., Feng, L. C., Kasarda, E., Gurley, K. E., Eng, J. K., Chodosh, L. A., Kemp, C. J.,
McIntosh, M. W., and Paulovich, A. G. (2007) Integrated pipeline for mass spectrometry-based
discovery and confirmation of biomarkers demonstrated in a mouse model of breast cancer. J
Proteome Res 6, Page.
11. Perkins, D. N., Pappin, D. J., Creasy, D. M., and Cottrell, J. S. (1999) Probability-based
protein identification by searching sequence databases using mass spectrometry data.
Electrophoresis 20, Page.
12. Consortium, T. U. (2008) The Universal Protein Resource (UniProt). Nucleic Acids Res,
Page.
13. Center, S. P. http://tools.proteomecenter.org/software.php. Page.
14. Kovacs, J. M., Mant, C. T., and Hodges, R. S. (2005) Determination of Intrinsic
Hydrophilicity/Hydrophobicity Coefficients of Amino Acid Side-Chains using Synthetic Model
Peptides. Understanding Biology Using Peptides (Sylvie E Blondelle, editor), Page.
15. Rozanov, Y. A. (1969) Probability Theory : A Concise Course (Translate and Edit by
Silverman, R.A.). Page.
16. Fink, J. L., Aturaliya, R. N., Davis, M. J., Zhang, F., Hanson, K., Teasdale, M. S., Kai,
C., Kawai, J., Carninci, P., Hayashizaki, Y., and Teasdale, R. D. (2006) LOCATE: a mouse
protein subcellular localization database. Nucleic Acids Res 34, Page.
13
14. 17. Tabb, D. L. (2001) An algorithm for isoelectric point estimation.
http://fields.scripps.edu/DTASelect/20010710-pI-Algorithm.pdf, Page.
18. Chen, E. I., Hewel, J., Felding-Habermann, B., and Yates, J. R., 3rd (2006) Large scale
protein profiling by combination of protein fractionation and multidimensional protein
identification technology (MudPIT). Mol Cell Proteomics 5, Page.
19. Aebersold R, and Mann M (2003) Mass spectrometry-based proteomics. Nature 422,
Page.
20. Dwivedi, R. C., Spicer, V., Harder, M., Antonovici, M., Ens, W., Standing, K. G.,
Wilkins, J. A., and Krokhin, O. V. (2008) Practical implementation of 2D HPLC scheme with
accurate peptide retention prediction in both dimensions for high-throughput bottom-up
proteomics. Anal Chem 80, Page.
21. Poole, C. F. (2003) The Essence of Chromatography. In: I.D. Wilson, M. C., C.F. Poole
ed. Encyclopedia of Separation Science, Academic Press, San Diego.
22. Spicer, V., Yamchuk, A., Cortens, J., Sousa, S., Ens, W., Standing, K. G., Wilkins, J. A.,
and Krokhin, O. V. (2007) Sequence-specific retention calculator. A family of peptide retention
time prediction algorithms in reversed-phase HPLC: applicability to various chromatographic
conditions and columns. Anal Chem 79, Page.
23. Tripet, B., Cepeniene, D., Kovacs, J. M., Mant, C. T., Krokhin, O. V., and Hodges, R. S.
(2007) Requirements for prediction of peptide retention time in reversed-phase high-performance
liquid chromatography: hydrophilicity/hydrophobicity of side-chains at the N- and C-termini of
peptides are dramatically affected by the end-groups and location. J Chromatogr A 1141, Page.
24. Gilar, M., Jaworski, A., Olivova, P., and Gebler, J. C. (2007) Peptide retention prediction
applied to proteomic data analysis. Rapid Commun Mass Spectrom 21, Page.
25. Gilar, M., Daly, A. E., Kele, M., Neue, U. D., and Gebler, J. C. (2004) Implications of
column peak capacity on the separation of complex peptide mixtures in single- and two-dimensional
high-performance liquid chromatography. J Chromatogr A 1061, Page.
26. Kapp, E. A., Schutz, F., Reid, G. E., Eddes, J. S., Moritz, R. L., O'Hair, R. A., Speed, T.
P., and Simpson, R. J. (2003) Mining a tandem mass spectrometry database to determine the
trends and global factors influencing peptide fragmentation. Anal Chem 75, Page.
27. Slebos, R. J., Brock, J. W., Winters, N. F., Stuart, S. R., Martinez, M. A., Li, M.,
Chambers, M. C., Zimmerman, L. J., Ham, A. J., Tabb, D. L., and Liebler, D. C. (2008)
Evaluation of Strong Cation Exchange versus Isoelectric Focusing of Peptides for
Multidimensional Liquid Chromatography-Tandem Mass Spectrometry. J Proteome Res, Page.
28. Shimura, K., Takahashi, K., Koyama, Y., Sato, K., and Kitamori, T. (2008) Isoelectric
focusing in a microfluidically defined electrophoresis channel. Anal Chem 80, Page.
29. Peng, J., Elias, J. E., Thoreen, C. C., Licklider, L. J., and Gygi, S. P. (2003) Evaluation of
multidimensional chromatography coupled with tandem mass spectrometry (LC/LC-MS/MS) for
large-scale protein analysis: the yeast proteome. J Proteome Res 2, Page.
30. Taouatas, N., Altelaar, A. F., Drugan, M. M., Helbig, A. O., Mohammed, S., and Heck,
A. J. (2008) SCX-based fractionation of Lys-N generated peptides facilitates the targeted
analysis of post-translational modifications. Mol Cell Proteomics, Page.
31. Motoyama, A., Xu, T., Ruse, C. I., Wohlschlegel, J. A., and Yates, J. R., 3rd (2007)
Anion and cation mixed-bed ion exchange for enhanced multidimensional separations of
peptides and phosphopeptides. Anal Chem 79, Page.
14
15. 32. Dai, J., Shieh, C. H., Sheng, Q. H., Zhou, H., and Zeng, R. (2005) Proteomic analysis
with integrated multiple dimensional liquid chromatography/mass spectrometry based on elution
of ion exchange column using pH steps. Anal Chem 77, Page.
33. Mant, C. T., and Hodges, R. S. (2008) Mixed-mode hydrophilic interaction/cation-exchange
chromatography: separation of complex mixtures of peptides of varying charge and
hydrophobicity. J Sep Sci 31, Page.
34. Dowell, J. A., Frost, D. C., Zhang, J., and Li, L. (2008) Comparison of two-dimensional
fractionation techniques for shotgun proteomics. Anal Chem 80, Page.
35. Le Bihan, T., Duewel, H. S., and Figeys, D. (2003) On-line strong cation exchange
micro-HPLC-ESI-MS/MS for protein identification and process optimization. J Am Soc Mass
Spectrom 14, Page.
36. Mawuenyega, K. G., Kaji, H., Yamuchi, Y., Shinkawa, T., Saito, H., Taoka, M.,
Takahashi, N., and Isobe, T. (2003) Large-scale identification of Caenorhabditis elegans proteins
by multidimensional liquid chromatography-tandem mass spectrometry. J Proteome Res 2, Page.
37. Nagano, K., Taoka, M., Yamauchi, Y., Itagaki, C., Shinkawa, T., Nunomura, K.,
Okamura, N., Takahashi, N., Izumi, T., and Isobe, T. (2005) Large-scale identification of
proteins expressed in mouse embryonic stem cells. Proteomics 5, Page.
38. Prieto, J. H., Koncarevic, S., Park, S. K., Yates, J., 3rd, and Becker, K. (2008) Large-scale
differential proteome analysis in Plasmodium falciparum under drug treatment. PLoS ONE
3, Page.
39. Gao, M., Deng, C., Yu, W., Zhang, Y., Yang, P., and Zhang, X. (2008) Large scale
depletion of the high-abundance proteins and analysis of middle- and low-abundance proteins in
human liver proteome by multidimensional liquid chromatography. Proteomics 8, Page.
40. Kirkland, P. A., Humbard, M. A., Daniels, C. J., and Maupin-Furlow, J. A. (2008)
Shotgun proteomics of the haloarchaeon Haloferax volcanii. J Proteome Res 7, Page.
41. Nakamura, T., Kuromitsu, J., and Oda, Y. (2008) Evaluation of comprehensive
multidimensional separations using reversed-phase, reversed-phase liquid chromatography/mass
spectrometry for shotgun proteomics. J Proteome Res 7, Page.
42. Liu, K., Zhang, J., Wang, J., Zhao, L., Peng, X., Jia, W., Ying, W., Zhu, Y., Xie, H., He,
F., and Qian, X. (2009) Relationship between Sample Loading Amount and Peptide
Identification and Its Effects on Quantitative Proteomics. Anal Chem, Page.
43. Duan, X. J., Xenarios, I., and Eisenberg, D. (2002) Describing biological protein
interactions in terms of protein states and state transitions: the LiveDIP database. Mol Cell
Proteomics 1, Page.
44. Krogan, N. J., Cagney, G., Yu, H., Zhong, G., Guo, X., Ignatchenko, A., Li, J., Pu, S.,
Datta, N., Tikuisis, A. P., Punna, T., Peregrin-Alvarez, J. M., Shales, M., Zhang, X., Davey, M.,
Robinson, M. D., Paccanaro, A., Bray, J. E., Sheung, A., Beattie, B., Richards, D. P., Canadien,
V., Lalev, A., Mena, F., Wong, P., Starostine, A., Canete, M. M., Vlasblom, J., Wu, S., Orsi, C.,
Collins, S. R., Chandran, S., Haw, R., Rilstone, J. J., Gandi, K., Thompson, N. J., Musso, G., St
Onge, P., Ghanny, S., Lam, M. H., Butland, G., Altaf-Ul, A. M., Kanaya, S., Shilatifard, A.,
O'Shea, E., Weissman, J. S., Ingles, C. J., Hughes, T. R., Parkinson, J., Gerstein, M., Wodak, S.
J., Emili, A., and Greenblatt, J. F. (2006) Global landscape of protein complexes in the yeast
Saccharomyces cerevisiae. Nature 440, Page.
45. Desiere, F., Deutsch, E. W., King, N. L., Nesvizhskii, A. I., Mallick, P., Eng, J., Chen, S.,
Eddes, J., Loevenich, S. N., and Aebersold, R. (2006) The PeptideAtlas project. Nucleic Acids
Res 34, Page.
15
16. Table 1
Protein/peptide identification by Mascot with 10 runs
Peptides /Protein
Run Identified
peptides
Identified
Proteins 1 2 3 >3
Protein with
Single peptide
1 573 162 76 31 14 41 47%
2 568 151 71 24 12 44 47%
3 540 153 63 36 15 39 41%
4 549 151 60 44 11 36 40%
5 505 151 76 23 16 36 50%
6 564 144 63 23 16 42 44%
7 420 132 71 18 15 28 54%
8 465 138 67 22 13 36 49%
9 551 159 73 29 19 38 46%
10 528 144 59 39 13 33 41%
Combined 1107 286 113 46 35 92 40%
Table 2
Peptides generated by 5 proteases
Nnumber
of peptides
average
length
average
m/z
Singly
charged
Number of
observable peptide
Asp-N 789539 19.9 720.4 0.373 90061
V8 1098314 14 617.3 0.467 104493
Lys-C 734936 21 728.2 0.017 82497
Trypsin 1261074 11.8 673 0.019 119350
Chymotrypsin 2916283 4.7 382.1 0.71 143866
Number of peptides is theoretical calculation of whole proteome digests without filtering by peptide observability
function.
17. a 48.97 ± 125.33
b 0.997 ± 0.012
0 5000 10000 15000 20000 25000 30000
25000
20000
15000
10000
5000
0
Equation: y = a + b*x
R2 = 0.86823
Observed scan#
Predicted scan#
Figure 1. The hydrophobicity coe!cient optimization
The least-square non-linear optimization of amino acid side-chain hydrophobicity coe!cients are performed by
predicting power of coe!cients to the peptide retention time. After optimization, hydrophobicity coe!cients
and linear relation coe!cients results in the "tting of observed and predicted scan number with R2=0.87.
Theoretical Observed
ï
ï
ï
hydrophobicity index
ï
hydrophobicity index
hydrophobicity index
ï
ï
ï
Residual
-5 5 25
Number of peptides
hydrophobicity index hydrophobicity index
Number of peptides
Number of peptides
Number of peptides
Filtering theoretical calculation
with “observability” function
Column interaction
term
MS observability
term
Filtered
( Observed - Filtered )
-
After
Figure 2. Modeling the peptide observability function
The optimized hydrophobicity coe!cients are used to calculate the peptide hydrophobicity indexes of both observed
and theoretical peptides. The hydrophobicity index distribution of observed and theoretical peptides were used to model
ltering function that denes “observability” of peptides as a function of hydrophobicity index (peptide observability function).
The function is composed of amplitude parameter and two terms of error functions and achieved R2=0.99 to lter the theoretical
distribution to observed one. The theoretical peptides are derived from the proteins actually identied by observed peptides
with at least Mascot ion score 50.
18. 4000
2000
1000
0
3000
2000
1000
250.0
Hydrophobicity Index
0.0
-50.0
100.0
50.0
200.0
150.0
500
0
1500
250.0
Hydrophobicity Index
0.0
-50.0
100.0
50.0
200.0
150.0
0.0
-50.0
100.0
50.0
200.0
150.0
250.0
4000
2000
1000
0
3000
20000
10000
Hydrophobicity Index
0
30000
pI range
250.0
Hydrophobicity Index
0.0
-50.0
100.0
50.0
200.0
150.0
2000
1000
500
0
1500
250.0
Hydrophobicity Index
0.0
-50.0
100.0
50.0
200.0
150.0
[ 0.00- 0.50]
[ 0.50- 1.00]
[ 1.00- 1.50]
[ 1.50- 2.00]
[ 2.00- 2.50]
[ 2.50- 3.00]
[ 3.00- 3.50]
[ 3.50- 4.00]
[ 4.00- 4.50]
[ 4.50- 5.00]
[ 5.00- 5.50]
[ 5.50- 6.00]
[ 6.00- 6.50]
[ 6.50- 7.00]
[ 7.00- 7.50]
[ 7.50- 8.00]
[ 8.00- 8.50]
[ 8.50- 9.00]
[ 9.00- 9.50]
[ 9.50-10.00]
[10.00-10.50]
[10.50-11.00]
[11.00-11.50]
[11.50-12.00]
[12.00-12.50]
[12.50-13.00]
[13.00-13.50]
0.45
0.4
0.35
0.3
0.25
0.2
0.15
0.1
0.05
AspN
AspN with filter
V8
V8 with filter
Ba s i c Acidic
Bas i c Acidic
Acidic
Basic pI
Ba si c Acidic
Acidic
Basic pI
pI
pI
pI
Asp-N V8
Lys-C Trypsin
0
1 3 5 7 9 11 13 15 15
Number of positive charges
Relative abundance
Chymotrypsin
Inset
Charge number distribution
Figure 3. Hydrophobicity v.s. pI distribution of peptides
In order to simulate the separation by peptide IEF followed by LC-MS/MS, theoretical peptides are generated
by 5 virtual enzymes and binned by two parameters. The pI values are calculated with bin width of 0.5 although
it seems too good for current separation. They have mainly 3 distinct populations in acidic, neutral and basic
pI regions. Acidic for peptides with more negative charges than positive, neutral for same numbers and basic
in more positive charges.
19. Asp-N 5000
V8
4000
3000
2000
250.0
3000
2500
2000
1500
1000
250.0
Lys-C Trypsin
15
Number of
positive charge
Chymotrypsin
-50.0
0.0
50.0
100.0
150.0
5000
4000
3000
2000
250.0
200.0
Intrinsic Hydrophobicity Index
-50.0
0.0
50.0
100.0
150.0
15000
12500
10000
7500
5000
250.0
200.0
Intrinsic Hydrophobicity Index
-50.0
0.0
50.0
100.0
150.0
60000
50000
40000
30000
20000
250.0
200.0
Intrinsic Hydrophobicity Index
-50.0
0.0
50.0
100.0
150.0
200.0
Intrinsic Hydrophobicity Index
-50.0
0.0
50.0
100.0
150.0
200.0
Intrinsic Hydrophobicity Index
Number of
Positive Charges
0123456789
10
11
12
13
14
15
15
2500
1000
10000
0
5
10
15
0
5
10
15
0
5
10
15
0
5
10
15
0
5
10
Number of
positive charge
Number of
positive charge
Number of
positive charge
Number of
positive charge
1000
500
Figure 4. Hydrophobicity v.s. positive charge distribution of peptides
The SCX followed by LC-MS/MS scenario is evaluated by plotting the number of peptides binned by number of positive charges
and hydrophobicity index of peptides. As Lys-C and trypsin cut at basic amino acids, they never have +1 charge except small
population of C-terminal peptides. Chymotrypsin has high number of peptides but they are mostly singly charged and expected
not be separated well. Most of Tryptic peptides have +2 charges and also expected not to be separated by this approach.
Asp-N 6000
V8
5000
4000
3000
2000
1000
4000
3000
2000
250.0
250.0
15
Number of
Negative charge
Lys-C 5000
Trypsin Chymotrypsin
4000
3000
2000
1000
1000
50000
40000
30000
20000
10000
2500
2000
1500
1000
500
Number of
Acidic residues
0123456789
10
11
12
13
14
15
15
-50.0
0.0
50.0
100.0
150.0
250.0
200.0
Intrinsic Hydrophobicity Index
-50.0
0.0
50.0
100.0
150.0
250.0
200.0
Intrinsic Hydrophobicity Index
-50.0
0.0
50.0
100.0
150.0
250.0
200.0
Intrinsic Hydrophobicity Index
-50.0
0.0
50.0
100.0
150.0
200.0
Intrinsic Hydrophobicity Index
-50.0
0.0
50.0
100.0
150.0
200.0
Intrinsic Hydrophobicity Index
0
5
10
15
0
5
10
15
0
5
10
15
0
5
10
15
0
5
10
Number of
Negative charge
Number of
Negative charge
Number of
Negative charge
Number of
Negative charge
Figure 5. Hydrophobicity v.s. negative charge distribution of peptides
The combination of SAX and LC-MS/MS is evaluated with negative charge and hydrophobicity index distributions. Chymotrypsin
has poor separation with mostly -1 charge. Lys-C and trypsin show wide distributions in both charges and hydrophobicity. Asp-N
and V8 also have descent distribution although lacking -1 charge.
20. SCX : Expected separtion SAX : Expected separtion
Asp-N
Lys-C
V8
Trypsin
Chymotrypsin
1 2 3 4 5 6 7 8 9 10 11 12 13 14 15 15
90000
80000
70000
60000
50000
40000
30000
20000
10000
0
Asp-N
Lys-C
V8
Trypsin
Chymotrypsin
Number of peptides
number of negative charges
1 2 3 4 5 6 7 8 9 10 11 12 13 14 15 15
1.0
1.5
0.0
0.5
3.0
3.5
2.0
2.5
5.0
5.5
4.0
4.5
6.0
6.5
8.0
8.5
7.0
7.5
9.0
9.5
10.0
11.0
11.5
10.5
13.0
12.0
12.5
140000
120000
100000
80000
60000
40000
20000
70000
60000
50000
40000
30000
20000
10000
0
Number of peptides
pI range
Asp-N
Lys-C
V8
Tyrpsin
chymotrypsin
0
Number of peptides
Number of positive charges
IEF : Expected separtion
Whole proteome (Column interactant)
Whole proteome (Filtered)
MTMP (Column interactant) x12.8 #
MTMP (Filtered) x12.8
Stick to colum
but not to be observed
42% of observable peptides
14% of observable peptides
-200 0 200 400
Hydrophobicity index
*
* The peptides are filtered with “column interaction” term with amplitude parameter only.
# Amplitude was adjusted to match Whole Proteome for clarity.
Figure 6. Summary of !rst dimensional separations
The separations by three techniques are summarized.
Panel 1: Separation by SCX.
Negative charge speci!c
enzymes have wide and relatively at distributions.
Lys-C also has relatively good separation except lack of
+1 charged peptides. Trypsin and chymotrypsin have
poor distribution.
Panel 2: Separation by SAX.
Except chymotrypsin, other four enzymes show excellent
distributions. V8 and Asp-N do not have -1 charged peptides.
Trypsin and Lys-C have wide distributions.
Panel 3: Separation by peptide-IEF.
Other than chymotrypsin,
all enzymes produce well distributed peptides in pI ranges.
Figure 7. Hydrophobic MTMP peptides
The peptides generated from MTMP are !ltered
with column interaction !lter (peptide observability
function without second MS observability term).
The ratios of unobservable against observable peptides
are computed for both whole and MTMP proteomes.
While whole proteome has only 14% peptides are
!ltered out due to MS observability term, MTMP
peptides are !ltered out by 42%.