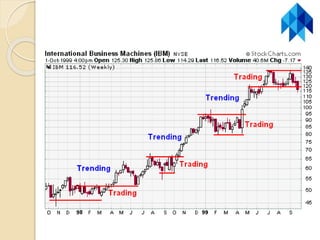
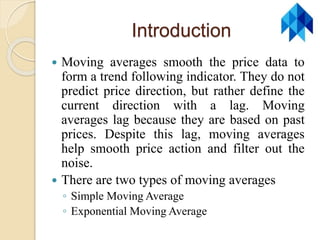
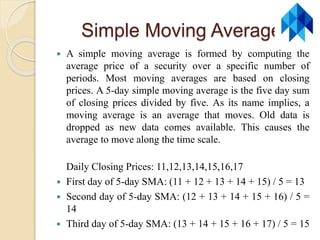
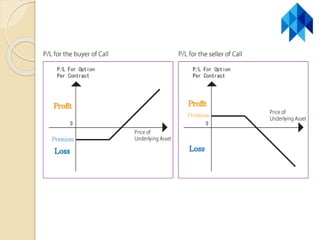
SlideShare a Scribd company logo
A Presentation
On
Moving Averages, ADX and
Derivatives
By
Kshitij Gupta
©CATALYST
What is Technical Analysis
Technical Analysis is the forecasting of
future financial price movements based on
an examination of past price movements.
Like weather forecasting, technical analysis
does not result in absolute predictions about
the future. Instead, technical analysis can
help investors anticipate what is “likely” to
happen to prices over time. Technical
analysis uses a wide variety of charts that
show price over time.
Three Rules to be Considered
While Using Technical Analysis
 According to Dow Theory there are three
rules
◦ Price Discounts Everything
◦ Price Movements are not totally random
◦ “What” is more important than “Why”
Price Discounts Everything
 This theorem is similar to the strong and semi-
strong forms of market efficiency. Technical
analysts believe that the current price fully reflects
all information. Because all information is already
reflected in the price, it represents the fair value,
and should form the basis for analysis. After all,
the market price reflects the sum knowledge of all
participants, including traders, investors, portfolio
managers, buy-side analysts, sell-side analysts,
market strategist, technical analysts, fundamental
analysts and many others. It would be folly to
disagree with the price set by such an impressive
array of people with impeccable credentials
Price Movements are not Totally
Random
 Most technicians agree that prices trend.
However, most technicians also acknowledge that
there are periods when prices do not trend. If
prices were always random, it would be extremely
difficult to make money using technical analysis.
 Jack Schwager states: “One way of viewing it is
that markets may witness extended periods of
random fluctuation, interspersed with shorter
periods of nonrandom behavior. The goal of the
chartist is to identify those periods (i.e. major
trends).”
“WHAT” is more important
than “WHY”
 Tony Plummer paraphrases Oscar Wilde
by stating, “A technical analyst knows the
price of everything, but the value of
nothing”.
 Technical Analyst mainly focuses on two
aspects
◦ What is the current price?
◦ What is the history of price movement.
Moving Averages
Introduction
 Moving averages smooth the price data to
form a trend following indicator. They do not
predict price direction, but rather define the
current direction with a lag. Moving
averages lag because they are based on past
prices. Despite this lag, moving averages
help smooth price action and filter out the
noise.
 There are two types of moving averages
◦ Simple Moving Average
◦ Exponential Moving Average
Simple Moving Average
 A simple moving average is formed by computing the
average price of a security over a specific number of
periods. Most moving averages are based on closing
prices. A 5-day simple moving average is the five day sum
of closing prices divided by five. As its name implies, a
moving average is an average that moves. Old data is
dropped as new data comes available. This causes the
average to move along the time scale.
Daily Closing Prices: 11,12,13,14,15,16,17
 First day of 5-day SMA: (11 + 12 + 13 + 14 + 15) / 5 = 13
 Second day of 5-day SMA: (12 + 13 + 14 + 15 + 16) / 5 =
14
 Third day of 5-day SMA: (13 + 14 + 15 + 16 + 17) / 5 = 15
Exponential Moving Average
 Exponential moving averages reduce the lag by
applying more weight to recent prices. The weighting
applied to the most recent price depends on the
number of periods in the moving average. There are
three steps to calculating an exponential moving
average. First, calculate the simple moving average.
An exponential moving average (EMA) has to start
somewhere so a simple moving average is used as the
previous period's EMA in the first calculation.
Second, calculate the weighting multiplier. Third,
calculate the exponential moving average. The
formula below is for a 10-day EMA.
 SMA: 10 period sum / 10 Multiplier: (2 / (Time
periods + 1) ) = (2 / (10 + 1) ) = 0.1818 (18.18%)
EMA: {Close - EMA(previous day)} x multiplier +
EMA(previousday).
Simple v/s Weighted MA
 Even though there are clear differences between
simple moving averages and exponential moving
averages, one is not necessarily better than the
other. Exponential moving averages have less lag
and are therefore more sensitive to recent prices -
and recent price changes. Exponential moving
averages will turn before simple moving averages.
Simple moving averages, on the other hand,
represent a true average of prices for the entire
time period. As such, simple moving averages
may be better suited to identify support or
resistance levels
The Lag Factor
 The longer the moving average, the more the
lag. A 10-day exponential moving average
will hug prices quite closely and turn shortly
after prices turn. Short moving averages are
like speed boats - nimble and quick to
change. In contrast, a 100-day moving
average contains lots of past data that slows
it down. Longer moving averages are like
ocean tankers - lethargic and slow to change.
It takes a larger and longer price movement
for a 100-day moving average to change
course.
Average Directional Index
(ADX)
Introduction
 The Average Directional Index (ADX), Minus
Directional Indicator (-DI) and Plus Directional
Indicator (+DI) represent a group of directional
movement indicators that form a trading system
developed by Welles Wilder. Wilder designed
ADX with commodities and daily prices in mind,
but these indicators can also be applied to stocks.
The Average Directional Index (ADX) measures
trend strength without regard to trend direction.
The other two indicators, Plus Directional
Indicator (+DI) and Minus Directional Indicator (-
DI), complement ADX by defining trend
direction. Used together, chartists can determine
both the direction and strength of the trend.
Directional Movement
 Plus Directional Movement (+DM) and Minus Directional
Movement (-DM) form the backbone of the Average
Directional Index (ADX). Wilder determined directional
movement by comparing the difference between two
consecutive lows with the difference between the highs.
 Directional movement is positive (plus) when the current
high minus the prior high is greater than the prior low minus
the current low. This so-called Plus Directional Movement
(+DM) then equals the current high minus the prior high,
provided it is positive. A negative value would simply be
entered as zero.
 Directional movement is negative (minus) when the prior
low minus the current low is greater than the current high
minus the prior high. This so-called Minus Directional
Movement (-DM) equals the prior low minus the current low,
provided it is positive. A negative value would simply be
entered as zero.
Calculation
The example below is based on a 14-day ADX calculation.
 1. Calculate the True Range (TR), Plus Directional Movement
(+DM) and Minus Directional Movement (-DM) for each period.
 2. Smooth these periodic values using the Wilder's smoothing
techniques.
 3. Divide the 14-day smoothed Plus Directional Movement (+DM)
by the 14-day smoothed True Range to find the 14-day Plus
Directional Indicator (+DI14). Multiply by 100 to move the decimal
point two places. This +DI14 is the Plus Directional Indicator
(green line) that is plotted along with ADX.
 4. Divide the 14-day smoothed Minus Directional Movement (-DM)
by the 14-day smoothed True Range to find the 14-day Minus
Directional Indicator (-DI14). Multiply by 100 to move the decimal
point two places. This -DI14 is the Minus Directional Indicator (red
line) that is plotted along with ADX.
 5. The Directional Movement Index (DX) equals the absolute value
of +DI14 less - DI14 divided by the sum of +DI14 and - DI14.
 6. After all these steps, it is time to calculate the Average Directional
Index (ADX). The first ADX value is simply a 14-day average of
DX. Subsequent ADX values are smoothed by multiplying the
previous 14-day ADX value by 13, adding the most recent DX
value and dividing this total by 14.
Wilder’s Smoothing
 First TR14 = Sum of first 14 periods of
TR1
 Second TR14 = First TR14 - (First
TR14/14) + Current TR1
 Subsequent Values = Prior TR14 - (Prior
TR14/14) + Current TR1
Interpretation
 The Average Directional Index (ADX) is
used to measure the strength or weakness
of a trend, not the actual direction.
Directional movement is defined by +DI
and -DI. In general, the bulls have the
edge when +DI is greater than - DI, while
the bears have the edge when - DI is
greater. Crosses of these directional
indicators can be combined with ADX for
a complete trading system.
Derivatives
Introduction
 A derivative is a security with a price that is
dependent upon or derived from one or more
underlying assets. The derivative itself is a contract
between two or more parties based upon the asset or
assets. Its value is determined by fluctuations in the
underlying asset. The most common underlying assets
include stocks, bonds, commodities, currencies, intere
st rates and market indexes.
 Derivatives either be traded over-the-counter
(OTC) or on an exchange. OTC derivatives constitute
the greater proportion of derivatives in existence and
are unregulated, whereas derivatives traded on
exchanges are standardized. OTC derivatives
generally have greater risk for the counterparty than
do standardized derivatives.
 Derivatives are further divided into three parts
◦ Forward Contract
◦ Future Contract
◦ Option Contract
 A forward contract is a customized contract between two
parties to buy or sell an asset at a specified price on a future
date. A forward contract can be used for hedging or
speculation, although its non-standardized nature makes it
particularly apt for hedging.
 A futures contract is a legal agreement, generally made on
the trading floor of a futures exchange, to buy or sell a
particular commodity or financial instrument at a
predetermined price at a specified time in the future. Futures
contracts are standardized to facilitate trading on a futures
exchange and, depending on the underlying asset being
traded, detail the quality and quantity of the commodity.
 An options contract is an agreement between two parties to
facilitate a potential transaction on the underlying security at a
preset price, referred to as the strike price, prior to the expiration
date. The two types of contracts are put and call options, which can
be purchased to speculate on the direction of stocks or stock indices,
or sold to generate income.
 Call Option - A call option is an agreement that gives an investor
the right, but not the obligation, to buy a stock, bond, commodity or
other instrument at a specified price within a specific time period.
 Put option - A put option is an option contract giving the owner the
right, but not the obligation, to sell a specified amount of
an underlying security at a specified price within a specified time.
This is the opposite of a call option, which gives the holder the right
to buy shares.
Basic Terminology
 Strike Price – The price at which the derivative contract is
exercised is known as strike price.
 Spot Price – The current price at which the security can be bought
or sold is known as spot price.
 In the money - A call option is said to be in the money when the
current market price of the stock is above the strike price of the call.
It is "in the money" because the holder of the call has the right to
buy the stock below its current market price.
 At the money - At the money is a situation where an option's strike
price is identical to the price of the underlying security.
 Out the money - Out of the money (OTM) is term used to describe
a call option with a strike price that is higher than the market
price of the underlying asset, or a put option with a strike price that
is lower than the market price of the underlying asset.
 Intrinsic Value - The intrinsic value is the difference between the
underling's price and the strike price.
 Premium - An option premium is the income received by an
investor who sells or "writes" an option contract to another party.
An option premium may also refer to the current price of any
specific option contract that has yet to expire.
How to Calculate Option
Price
Black Scholes Model
THANK YOU

More Related Content

What's hot

Forex trading
Forex tradingForex trading
Forex trading
eduCBA
 
Trade what you see not what you think
Trade what you see not what you thinkTrade what you see not what you think
Trade what you see not what you think
Ninja Tan
 
4 hour macd forex strategy
4 hour macd forex strategy4 hour macd forex strategy
4 hour macd forex strategy
Ernani Dias
 
Overview of price action trading
Overview of price action tradingOverview of price action trading
Overview of price action trading
ChristineNelson17
 
Trading Strategies
Trading StrategiesTrading Strategies
Trading Strategies
InvestingTips
 
Introduction To Technical Analysis
Introduction To Technical AnalysisIntroduction To Technical Analysis
Introduction To Technical Analysis
Trilok Hg
 
Traders worldmagazine elliott_wave_unveiled_www.dl4all.com
Traders worldmagazine elliott_wave_unveiled_www.dl4all.comTraders worldmagazine elliott_wave_unveiled_www.dl4all.com
Traders worldmagazine elliott_wave_unveiled_www.dl4all.com
shaned30
 
How To Trade Regular Divergence with MACD, RSI, Stochastics
How To Trade Regular Divergence with MACD, RSI, StochasticsHow To Trade Regular Divergence with MACD, RSI, Stochastics
How To Trade Regular Divergence with MACD, RSI, Stochastics
NetpicksTrading
 
Secrets of Price Action Trading
Secrets of Price Action TradingSecrets of Price Action Trading
Secrets of Price Action Trading
Syrous Pejman
 
Magic Breakout Forex Trading Strategy PDF eBook
Magic Breakout Forex Trading Strategy PDF eBookMagic Breakout Forex Trading Strategy PDF eBook
Magic Breakout Forex Trading Strategy PDF eBook
eforexcourse web
 
Learn A Simple Range Trading Strategy
Learn A Simple Range Trading StrategyLearn A Simple Range Trading Strategy
Learn A Simple Range Trading Strategy
NetpicksTrading
 
Top 8 Forex Trading Strategies That Pro Traders Use
Top 8 Forex Trading Strategies That Pro Traders UseTop 8 Forex Trading Strategies That Pro Traders Use
Top 8 Forex Trading Strategies That Pro Traders Use
Syrous Pejman
 
Price Action Trading.pdf
Price Action Trading.pdfPrice Action Trading.pdf
Price Action Trading.pdf
Shreya292338
 
The power to predict basics and advanced forex analysis
The power to predict   basics and advanced forex analysisThe power to predict   basics and advanced forex analysis
The power to predict basics and advanced forex analysis
Power Point
 
Simple scalping secret strategy
Simple scalping secret strategySimple scalping secret strategy
Simple scalping secret strategy
Heri Valiant
 
Divergences doc
Divergences docDivergences doc
Divergences doc
AlchemyTrading
 
Trading plan
Trading planTrading plan
Trading plan
pipsumo traderfx
 
Chart patterns final handout
Chart patterns   final handoutChart patterns   final handout
Chart patterns final handout
wijitha gayan
 
Learn forex in 15 min!
Learn forex in 15 min! Learn forex in 15 min!
Learn forex in 15 min!
Forex Illustrated
 
my fox
my fox my fox
my fox
Eaglefx
 

What's hot (20)

Forex trading
Forex tradingForex trading
Forex trading
 
Trade what you see not what you think
Trade what you see not what you thinkTrade what you see not what you think
Trade what you see not what you think
 
4 hour macd forex strategy
4 hour macd forex strategy4 hour macd forex strategy
4 hour macd forex strategy
 
Overview of price action trading
Overview of price action tradingOverview of price action trading
Overview of price action trading
 
Trading Strategies
Trading StrategiesTrading Strategies
Trading Strategies
 
Introduction To Technical Analysis
Introduction To Technical AnalysisIntroduction To Technical Analysis
Introduction To Technical Analysis
 
Traders worldmagazine elliott_wave_unveiled_www.dl4all.com
Traders worldmagazine elliott_wave_unveiled_www.dl4all.comTraders worldmagazine elliott_wave_unveiled_www.dl4all.com
Traders worldmagazine elliott_wave_unveiled_www.dl4all.com
 
How To Trade Regular Divergence with MACD, RSI, Stochastics
How To Trade Regular Divergence with MACD, RSI, StochasticsHow To Trade Regular Divergence with MACD, RSI, Stochastics
How To Trade Regular Divergence with MACD, RSI, Stochastics
 
Secrets of Price Action Trading
Secrets of Price Action TradingSecrets of Price Action Trading
Secrets of Price Action Trading
 
Magic Breakout Forex Trading Strategy PDF eBook
Magic Breakout Forex Trading Strategy PDF eBookMagic Breakout Forex Trading Strategy PDF eBook
Magic Breakout Forex Trading Strategy PDF eBook
 
Learn A Simple Range Trading Strategy
Learn A Simple Range Trading StrategyLearn A Simple Range Trading Strategy
Learn A Simple Range Trading Strategy
 
Top 8 Forex Trading Strategies That Pro Traders Use
Top 8 Forex Trading Strategies That Pro Traders UseTop 8 Forex Trading Strategies That Pro Traders Use
Top 8 Forex Trading Strategies That Pro Traders Use
 
Price Action Trading.pdf
Price Action Trading.pdfPrice Action Trading.pdf
Price Action Trading.pdf
 
The power to predict basics and advanced forex analysis
The power to predict   basics and advanced forex analysisThe power to predict   basics and advanced forex analysis
The power to predict basics and advanced forex analysis
 
Simple scalping secret strategy
Simple scalping secret strategySimple scalping secret strategy
Simple scalping secret strategy
 
Divergences doc
Divergences docDivergences doc
Divergences doc
 
Trading plan
Trading planTrading plan
Trading plan
 
Chart patterns final handout
Chart patterns   final handoutChart patterns   final handout
Chart patterns final handout
 
Learn forex in 15 min!
Learn forex in 15 min! Learn forex in 15 min!
Learn forex in 15 min!
 
my fox
my fox my fox
my fox
 

Viewers also liked

Curl
CurlCurl
vcla
vclavcla
Divergence,curl,gradient
Divergence,curl,gradientDivergence,curl,gradient
Divergence,curl,gradient
Kunj Patel
 
cURL base_simple_publishing - part of Giraffi
cURL base_simple_publishing - part of GirafficURL base_simple_publishing - part of Giraffi
cURL base_simple_publishing - part of Giraffi
Yukihiko SAWANOBORI
 
Vector calculus
Vector calculusVector calculus
Vector calculus
raghu ram
 
Tsx (1)
Tsx (1)Tsx (1)
Tsx (1)
keluskarnj
 
Canadian stock markets
Canadian stock marketsCanadian stock markets
Canadian stock markets
k_khetarpal
 
Toàn cảnh văn hóa, thể thao, du lịch số 1158 - vanhien.vn
Toàn cảnh văn hóa, thể thao, du lịch số 1158 - vanhien.vnToàn cảnh văn hóa, thể thao, du lịch số 1158 - vanhien.vn
Toàn cảnh văn hóa, thể thao, du lịch số 1158 - vanhien.vn
Pham Long
 
Moving average and Rate of change (ROC)
Moving average and Rate of change (ROC)Moving average and Rate of change (ROC)
Moving average and Rate of change (ROC)
Ayush Kansal
 
Forex Profits with the Kicker Signal
Forex Profits with the Kicker SignalForex Profits with the Kicker Signal
Forex Profits with the Kicker Signal
InvestingTips
 
Moving Average
Moving AverageMoving Average
Moving Average
elboone
 
VECTOR FUNCTION
VECTOR FUNCTION VECTOR FUNCTION
VECTOR FUNCTION
Siddhi Shrivas
 
Chart pattern
Chart patternChart pattern
Chart pattern
Angel Martinez
 
Japanese Candlestick
Japanese CandlestickJapanese Candlestick
Japanese Candlestick
Real World Systems
 
Fibonacci analysis
Fibonacci analysisFibonacci analysis
Fibonacci analysis
ypendharkar
 
Macd Professional_English
Macd Professional_EnglishMacd Professional_English
Macd Professional_English
Olymp Trade
 
Macd professional_Portugal
Macd professional_PortugalMacd professional_Portugal
Macd professional_Portugal
Olymp Trade
 
Candlestick presentation
Candlestick presentationCandlestick presentation
Candlestick presentation
Jenn Astwood
 
Technical analysis OF STOCK MARKET presentation of mba 4 sem FINANCE PPT
Technical analysis OF STOCK MARKET  presentation of mba 4 sem FINANCE PPTTechnical analysis OF STOCK MARKET  presentation of mba 4 sem FINANCE PPT
Technical analysis OF STOCK MARKET presentation of mba 4 sem FINANCE PPT
Babasab Patil
 

Viewers also liked (19)

Curl
CurlCurl
Curl
 
vcla
vclavcla
vcla
 
Divergence,curl,gradient
Divergence,curl,gradientDivergence,curl,gradient
Divergence,curl,gradient
 
cURL base_simple_publishing - part of Giraffi
cURL base_simple_publishing - part of GirafficURL base_simple_publishing - part of Giraffi
cURL base_simple_publishing - part of Giraffi
 
Vector calculus
Vector calculusVector calculus
Vector calculus
 
Tsx (1)
Tsx (1)Tsx (1)
Tsx (1)
 
Canadian stock markets
Canadian stock marketsCanadian stock markets
Canadian stock markets
 
Toàn cảnh văn hóa, thể thao, du lịch số 1158 - vanhien.vn
Toàn cảnh văn hóa, thể thao, du lịch số 1158 - vanhien.vnToàn cảnh văn hóa, thể thao, du lịch số 1158 - vanhien.vn
Toàn cảnh văn hóa, thể thao, du lịch số 1158 - vanhien.vn
 
Moving average and Rate of change (ROC)
Moving average and Rate of change (ROC)Moving average and Rate of change (ROC)
Moving average and Rate of change (ROC)
 
Forex Profits with the Kicker Signal
Forex Profits with the Kicker SignalForex Profits with the Kicker Signal
Forex Profits with the Kicker Signal
 
Moving Average
Moving AverageMoving Average
Moving Average
 
VECTOR FUNCTION
VECTOR FUNCTION VECTOR FUNCTION
VECTOR FUNCTION
 
Chart pattern
Chart patternChart pattern
Chart pattern
 
Japanese Candlestick
Japanese CandlestickJapanese Candlestick
Japanese Candlestick
 
Fibonacci analysis
Fibonacci analysisFibonacci analysis
Fibonacci analysis
 
Macd Professional_English
Macd Professional_EnglishMacd Professional_English
Macd Professional_English
 
Macd professional_Portugal
Macd professional_PortugalMacd professional_Portugal
Macd professional_Portugal
 
Candlestick presentation
Candlestick presentationCandlestick presentation
Candlestick presentation
 
Technical analysis OF STOCK MARKET presentation of mba 4 sem FINANCE PPT
Technical analysis OF STOCK MARKET  presentation of mba 4 sem FINANCE PPTTechnical analysis OF STOCK MARKET  presentation of mba 4 sem FINANCE PPT
Technical analysis OF STOCK MARKET presentation of mba 4 sem FINANCE PPT
 

Similar to Moving average adx derivatives

Cmt learning objective 2 c concept of directional movement
Cmt learning objective 2 c   concept of directional movementCmt learning objective 2 c   concept of directional movement
Cmt learning objective 2 c concept of directional movement
Professional Training Academy
 
Cmt learning objective 2 c concept of directional movement
Cmt learning objective 2 c   concept of directional movementCmt learning objective 2 c   concept of directional movement
Cmt learning objective 2 c concept of directional movement
Professional Training Academy
 
Cmt learning objective 2 c concept of directional movement
Cmt learning objective 2 c   concept of directional movementCmt learning objective 2 c   concept of directional movement
Cmt learning objective 2 c concept of directional movement
Professional Training Academy
 
Technical analysis
Technical analysisTechnical analysis
Technical analysis
nitigga92
 
Investment ppt
Investment pptInvestment ppt
Investment ppt
Ksoft Technologies
 
Technical-Analysis.pdf
Technical-Analysis.pdfTechnical-Analysis.pdf
Technical-Analysis.pdf
JoreenEvangelio
 
Technical analysis
Technical analysisTechnical analysis
Technical analysis
ANANDHU BALAN
 
Power hour power point 12.09.2010
Power hour power point 12.09.2010Power hour power point 12.09.2010
Power hour power point 12.09.2010
Marcello Ducille
 
Power hour power point 12.09.2010b
Power hour power point 12.09.2010bPower hour power point 12.09.2010b
Power hour power point 12.09.2010b
Marcello Ducille
 
Power hour power point 12.09.2010
Power hour power point 12.09.2010Power hour power point 12.09.2010
Power hour power point 12.09.2010
Marcello Ducille
 
Power hour power point 12.09.2010b
Power hour power point 12.09.2010bPower hour power point 12.09.2010b
Power hour power point 12.09.2010b
Marcello Ducille
 
Technical Analysis Of Stock Market
Technical Analysis Of Stock MarketTechnical Analysis Of Stock Market
Technical Analysis Of Stock Market
m.jalan
 
8th chapter
8th chapter8th chapter
8th chapter
Dasrat goswami
 
Investment management cws
Investment management cwsInvestment management cws
Investment management cws
2k20dmba087piyushkum
 
Top 5 Indicators for Intraday Trading and How to Use Them
Top 5 Indicators for Intraday Trading and How to Use ThemTop 5 Indicators for Intraday Trading and How to Use Them
Top 5 Indicators for Intraday Trading and How to Use Them
Stock Venture
 
Technically speaking
Technically speakingTechnically speaking
Technically speaking
Jeay Issac
 
Best Moving Average for Swing Trading.pdf
Best Moving Average for Swing Trading.pdfBest Moving Average for Swing Trading.pdf
Best Moving Average for Swing Trading.pdf
Nazim Khan
 
QNBFS Daily Technical Trader - Qatar for August 08 2018 التحليل الفني اليومي ...
QNBFS Daily Technical Trader - Qatar for August 08 2018 التحليل الفني اليومي ...QNBFS Daily Technical Trader - Qatar for August 08 2018 التحليل الفني اليومي ...
QNBFS Daily Technical Trader - Qatar for August 08 2018 التحليل الفني اليومي ...
QNB Group
 
Invest systemically earn smartly03
Invest systemically  earn smartly03Invest systemically  earn smartly03
Invest systemically earn smartly03
Sanjay Lad
 
Section 2 - Chapter 13 Part IV - Confirmations - Price Confirmations
Section 2 - Chapter 13 Part IV - Confirmations - Price  ConfirmationsSection 2 - Chapter 13 Part IV - Confirmations - Price  Confirmations
Section 2 - Chapter 13 Part IV - Confirmations - Price Confirmations
Professional Training Academy
 

Similar to Moving average adx derivatives (20)

Cmt learning objective 2 c concept of directional movement
Cmt learning objective 2 c   concept of directional movementCmt learning objective 2 c   concept of directional movement
Cmt learning objective 2 c concept of directional movement
 
Cmt learning objective 2 c concept of directional movement
Cmt learning objective 2 c   concept of directional movementCmt learning objective 2 c   concept of directional movement
Cmt learning objective 2 c concept of directional movement
 
Cmt learning objective 2 c concept of directional movement
Cmt learning objective 2 c   concept of directional movementCmt learning objective 2 c   concept of directional movement
Cmt learning objective 2 c concept of directional movement
 
Technical analysis
Technical analysisTechnical analysis
Technical analysis
 
Investment ppt
Investment pptInvestment ppt
Investment ppt
 
Technical-Analysis.pdf
Technical-Analysis.pdfTechnical-Analysis.pdf
Technical-Analysis.pdf
 
Technical analysis
Technical analysisTechnical analysis
Technical analysis
 
Power hour power point 12.09.2010
Power hour power point 12.09.2010Power hour power point 12.09.2010
Power hour power point 12.09.2010
 
Power hour power point 12.09.2010b
Power hour power point 12.09.2010bPower hour power point 12.09.2010b
Power hour power point 12.09.2010b
 
Power hour power point 12.09.2010
Power hour power point 12.09.2010Power hour power point 12.09.2010
Power hour power point 12.09.2010
 
Power hour power point 12.09.2010b
Power hour power point 12.09.2010bPower hour power point 12.09.2010b
Power hour power point 12.09.2010b
 
Technical Analysis Of Stock Market
Technical Analysis Of Stock MarketTechnical Analysis Of Stock Market
Technical Analysis Of Stock Market
 
8th chapter
8th chapter8th chapter
8th chapter
 
Investment management cws
Investment management cwsInvestment management cws
Investment management cws
 
Top 5 Indicators for Intraday Trading and How to Use Them
Top 5 Indicators for Intraday Trading and How to Use ThemTop 5 Indicators for Intraday Trading and How to Use Them
Top 5 Indicators for Intraday Trading and How to Use Them
 
Technically speaking
Technically speakingTechnically speaking
Technically speaking
 
Best Moving Average for Swing Trading.pdf
Best Moving Average for Swing Trading.pdfBest Moving Average for Swing Trading.pdf
Best Moving Average for Swing Trading.pdf
 
QNBFS Daily Technical Trader - Qatar for August 08 2018 التحليل الفني اليومي ...
QNBFS Daily Technical Trader - Qatar for August 08 2018 التحليل الفني اليومي ...QNBFS Daily Technical Trader - Qatar for August 08 2018 التحليل الفني اليومي ...
QNBFS Daily Technical Trader - Qatar for August 08 2018 التحليل الفني اليومي ...
 
Invest systemically earn smartly03
Invest systemically  earn smartly03Invest systemically  earn smartly03
Invest systemically earn smartly03
 
Section 2 - Chapter 13 Part IV - Confirmations - Price Confirmations
Section 2 - Chapter 13 Part IV - Confirmations - Price  ConfirmationsSection 2 - Chapter 13 Part IV - Confirmations - Price  Confirmations
Section 2 - Chapter 13 Part IV - Confirmations - Price Confirmations
 

More from Kshitij Gupta

Cibil
CibilCibil
CSR Policy of ONGC and Oil India Ltd
CSR Policy of ONGC and Oil India LtdCSR Policy of ONGC and Oil India Ltd
CSR Policy of ONGC and Oil India Ltd
Kshitij Gupta
 
Downfall of micromax
Downfall of micromaxDownfall of micromax
Downfall of micromax
Kshitij Gupta
 
Work life balance
Work life balanceWork life balance
Work life balance
Kshitij Gupta
 
Income from house property
Income from house propertyIncome from house property
Income from house property
Kshitij Gupta
 
Build - Operate - Transfer
Build - Operate - TransferBuild - Operate - Transfer
Build - Operate - Transfer
Kshitij Gupta
 

More from Kshitij Gupta (6)

Cibil
CibilCibil
Cibil
 
CSR Policy of ONGC and Oil India Ltd
CSR Policy of ONGC and Oil India LtdCSR Policy of ONGC and Oil India Ltd
CSR Policy of ONGC and Oil India Ltd
 
Downfall of micromax
Downfall of micromaxDownfall of micromax
Downfall of micromax
 
Work life balance
Work life balanceWork life balance
Work life balance
 
Income from house property
Income from house propertyIncome from house property
Income from house property
 
Build - Operate - Transfer
Build - Operate - TransferBuild - Operate - Transfer
Build - Operate - Transfer
 

Recently uploaded

How HR Search Helps in Company Success.pdf
How HR Search Helps in Company Success.pdfHow HR Search Helps in Company Success.pdf
How HR Search Helps in Company Success.pdf
HumanResourceDimensi1
 
Garments ERP Software in Bangladesh _ Pridesys IT Ltd.pdf
Garments ERP Software in Bangladesh _ Pridesys IT Ltd.pdfGarments ERP Software in Bangladesh _ Pridesys IT Ltd.pdf
Garments ERP Software in Bangladesh _ Pridesys IT Ltd.pdf
Pridesys IT Ltd.
 
Best Competitive Marble Pricing in Dubai - ☎ 9928909666
Best Competitive Marble Pricing in Dubai - ☎ 9928909666Best Competitive Marble Pricing in Dubai - ☎ 9928909666
Best Competitive Marble Pricing in Dubai - ☎ 9928909666
Stone Art Hub
 
The latest Heat Pump Manual from Newentide
The latest Heat Pump Manual from NewentideThe latest Heat Pump Manual from Newentide
The latest Heat Pump Manual from Newentide
JoeYangGreatMachiner
 
Registered-Establishment-List-in-Uttarakhand-pdf.pdf
Registered-Establishment-List-in-Uttarakhand-pdf.pdfRegistered-Establishment-List-in-Uttarakhand-pdf.pdf
Registered-Establishment-List-in-Uttarakhand-pdf.pdf
dazzjoker
 
NIMA2024 | De toegevoegde waarde van DEI en ESG in campagnes | Nathalie Lam |...
NIMA2024 | De toegevoegde waarde van DEI en ESG in campagnes | Nathalie Lam |...NIMA2024 | De toegevoegde waarde van DEI en ESG in campagnes | Nathalie Lam |...
NIMA2024 | De toegevoegde waarde van DEI en ESG in campagnes | Nathalie Lam |...
BBPMedia1
 
Best practices for project execution and delivery
Best practices for project execution and deliveryBest practices for project execution and delivery
Best practices for project execution and delivery
CLIVE MINCHIN
 
4 Benefits of Partnering with an OnlyFans Agency for Content Creators.pdf
4 Benefits of Partnering with an OnlyFans Agency for Content Creators.pdf4 Benefits of Partnering with an OnlyFans Agency for Content Creators.pdf
4 Benefits of Partnering with an OnlyFans Agency for Content Creators.pdf
onlyfansmanagedau
 
Dpboss Matka Guessing Satta Matta Matka Kalyan panel Chart Indian Matka Dpbos...
Dpboss Matka Guessing Satta Matta Matka Kalyan panel Chart Indian Matka Dpbos...Dpboss Matka Guessing Satta Matta Matka Kalyan panel Chart Indian Matka Dpbos...
Dpboss Matka Guessing Satta Matta Matka Kalyan panel Chart Indian Matka Dpbos...
➒➌➎➏➑➐➋➑➐➐Dpboss Matka Guessing Satta Matka Kalyan Chart Indian Matka
 
The Steadfast and Reliable Bull: Taurus Zodiac Sign
The Steadfast and Reliable Bull: Taurus Zodiac SignThe Steadfast and Reliable Bull: Taurus Zodiac Sign
The Steadfast and Reliable Bull: Taurus Zodiac Sign
my Pandit
 
2022 Vintage Roman Numerals Men Rings
2022 Vintage Roman  Numerals  Men  Rings2022 Vintage Roman  Numerals  Men  Rings
2022 Vintage Roman Numerals Men Rings
aragme
 
The APCO Geopolitical Radar - Q3 2024 The Global Operating Environment for Bu...
The APCO Geopolitical Radar - Q3 2024 The Global Operating Environment for Bu...The APCO Geopolitical Radar - Q3 2024 The Global Operating Environment for Bu...
The APCO Geopolitical Radar - Q3 2024 The Global Operating Environment for Bu...
APCO
 
Innovation Management Frameworks: Your Guide to Creativity & Innovation
Innovation Management Frameworks: Your Guide to Creativity & InnovationInnovation Management Frameworks: Your Guide to Creativity & Innovation
Innovation Management Frameworks: Your Guide to Creativity & Innovation
Operational Excellence Consulting
 
TIMES BPO: Business Plan For Startup Industry
TIMES BPO: Business Plan For Startup IndustryTIMES BPO: Business Plan For Startup Industry
TIMES BPO: Business Plan For Startup Industry
timesbpobusiness
 
Innovative Uses of Revit in Urban Planning and Design
Innovative Uses of Revit in Urban Planning and DesignInnovative Uses of Revit in Urban Planning and Design
Innovative Uses of Revit in Urban Planning and Design
Chandresh Chudasama
 
Zodiac Signs and Food Preferences_ What Your Sign Says About Your Taste
Zodiac Signs and Food Preferences_ What Your Sign Says About Your TasteZodiac Signs and Food Preferences_ What Your Sign Says About Your Taste
Zodiac Signs and Food Preferences_ What Your Sign Says About Your Taste
my Pandit
 
Dpboss Matka Guessing Satta Matta Matka Kalyan Chart Satta Matka
Dpboss Matka Guessing Satta Matta Matka Kalyan Chart Satta MatkaDpboss Matka Guessing Satta Matta Matka Kalyan Chart Satta Matka
Dpboss Matka Guessing Satta Matta Matka Kalyan Chart Satta Matka
➒➌➎➏➑➐➋➑➐➐Dpboss Matka Guessing Satta Matka Kalyan Chart Indian Matka
 
Ellen Burstyn: From Detroit Dreamer to Hollywood Legend | CIO Women Magazine
Ellen Burstyn: From Detroit Dreamer to Hollywood Legend | CIO Women MagazineEllen Burstyn: From Detroit Dreamer to Hollywood Legend | CIO Women Magazine
Ellen Burstyn: From Detroit Dreamer to Hollywood Legend | CIO Women Magazine
CIOWomenMagazine
 
Digital Transformation Frameworks: Driving Digital Excellence
Digital Transformation Frameworks: Driving Digital ExcellenceDigital Transformation Frameworks: Driving Digital Excellence
Digital Transformation Frameworks: Driving Digital Excellence
Operational Excellence Consulting
 
The Genesis of BriansClub.cm Famous Dark WEb Platform
The Genesis of BriansClub.cm Famous Dark WEb PlatformThe Genesis of BriansClub.cm Famous Dark WEb Platform
The Genesis of BriansClub.cm Famous Dark WEb Platform
SabaaSudozai
 

Recently uploaded (20)

How HR Search Helps in Company Success.pdf
How HR Search Helps in Company Success.pdfHow HR Search Helps in Company Success.pdf
How HR Search Helps in Company Success.pdf
 
Garments ERP Software in Bangladesh _ Pridesys IT Ltd.pdf
Garments ERP Software in Bangladesh _ Pridesys IT Ltd.pdfGarments ERP Software in Bangladesh _ Pridesys IT Ltd.pdf
Garments ERP Software in Bangladesh _ Pridesys IT Ltd.pdf
 
Best Competitive Marble Pricing in Dubai - ☎ 9928909666
Best Competitive Marble Pricing in Dubai - ☎ 9928909666Best Competitive Marble Pricing in Dubai - ☎ 9928909666
Best Competitive Marble Pricing in Dubai - ☎ 9928909666
 
The latest Heat Pump Manual from Newentide
The latest Heat Pump Manual from NewentideThe latest Heat Pump Manual from Newentide
The latest Heat Pump Manual from Newentide
 
Registered-Establishment-List-in-Uttarakhand-pdf.pdf
Registered-Establishment-List-in-Uttarakhand-pdf.pdfRegistered-Establishment-List-in-Uttarakhand-pdf.pdf
Registered-Establishment-List-in-Uttarakhand-pdf.pdf
 
NIMA2024 | De toegevoegde waarde van DEI en ESG in campagnes | Nathalie Lam |...
NIMA2024 | De toegevoegde waarde van DEI en ESG in campagnes | Nathalie Lam |...NIMA2024 | De toegevoegde waarde van DEI en ESG in campagnes | Nathalie Lam |...
NIMA2024 | De toegevoegde waarde van DEI en ESG in campagnes | Nathalie Lam |...
 
Best practices for project execution and delivery
Best practices for project execution and deliveryBest practices for project execution and delivery
Best practices for project execution and delivery
 
4 Benefits of Partnering with an OnlyFans Agency for Content Creators.pdf
4 Benefits of Partnering with an OnlyFans Agency for Content Creators.pdf4 Benefits of Partnering with an OnlyFans Agency for Content Creators.pdf
4 Benefits of Partnering with an OnlyFans Agency for Content Creators.pdf
 
Dpboss Matka Guessing Satta Matta Matka Kalyan panel Chart Indian Matka Dpbos...
Dpboss Matka Guessing Satta Matta Matka Kalyan panel Chart Indian Matka Dpbos...Dpboss Matka Guessing Satta Matta Matka Kalyan panel Chart Indian Matka Dpbos...
Dpboss Matka Guessing Satta Matta Matka Kalyan panel Chart Indian Matka Dpbos...
 
The Steadfast and Reliable Bull: Taurus Zodiac Sign
The Steadfast and Reliable Bull: Taurus Zodiac SignThe Steadfast and Reliable Bull: Taurus Zodiac Sign
The Steadfast and Reliable Bull: Taurus Zodiac Sign
 
2022 Vintage Roman Numerals Men Rings
2022 Vintage Roman  Numerals  Men  Rings2022 Vintage Roman  Numerals  Men  Rings
2022 Vintage Roman Numerals Men Rings
 
The APCO Geopolitical Radar - Q3 2024 The Global Operating Environment for Bu...
The APCO Geopolitical Radar - Q3 2024 The Global Operating Environment for Bu...The APCO Geopolitical Radar - Q3 2024 The Global Operating Environment for Bu...
The APCO Geopolitical Radar - Q3 2024 The Global Operating Environment for Bu...
 
Innovation Management Frameworks: Your Guide to Creativity & Innovation
Innovation Management Frameworks: Your Guide to Creativity & InnovationInnovation Management Frameworks: Your Guide to Creativity & Innovation
Innovation Management Frameworks: Your Guide to Creativity & Innovation
 
TIMES BPO: Business Plan For Startup Industry
TIMES BPO: Business Plan For Startup IndustryTIMES BPO: Business Plan For Startup Industry
TIMES BPO: Business Plan For Startup Industry
 
Innovative Uses of Revit in Urban Planning and Design
Innovative Uses of Revit in Urban Planning and DesignInnovative Uses of Revit in Urban Planning and Design
Innovative Uses of Revit in Urban Planning and Design
 
Zodiac Signs and Food Preferences_ What Your Sign Says About Your Taste
Zodiac Signs and Food Preferences_ What Your Sign Says About Your TasteZodiac Signs and Food Preferences_ What Your Sign Says About Your Taste
Zodiac Signs and Food Preferences_ What Your Sign Says About Your Taste
 
Dpboss Matka Guessing Satta Matta Matka Kalyan Chart Satta Matka
Dpboss Matka Guessing Satta Matta Matka Kalyan Chart Satta MatkaDpboss Matka Guessing Satta Matta Matka Kalyan Chart Satta Matka
Dpboss Matka Guessing Satta Matta Matka Kalyan Chart Satta Matka
 
Ellen Burstyn: From Detroit Dreamer to Hollywood Legend | CIO Women Magazine
Ellen Burstyn: From Detroit Dreamer to Hollywood Legend | CIO Women MagazineEllen Burstyn: From Detroit Dreamer to Hollywood Legend | CIO Women Magazine
Ellen Burstyn: From Detroit Dreamer to Hollywood Legend | CIO Women Magazine
 
Digital Transformation Frameworks: Driving Digital Excellence
Digital Transformation Frameworks: Driving Digital ExcellenceDigital Transformation Frameworks: Driving Digital Excellence
Digital Transformation Frameworks: Driving Digital Excellence
 
The Genesis of BriansClub.cm Famous Dark WEb Platform
The Genesis of BriansClub.cm Famous Dark WEb PlatformThe Genesis of BriansClub.cm Famous Dark WEb Platform
The Genesis of BriansClub.cm Famous Dark WEb Platform
 

Moving average adx derivatives

  • 1. A Presentation On Moving Averages, ADX and Derivatives By Kshitij Gupta ©CATALYST
  • 2. What is Technical Analysis Technical Analysis is the forecasting of future financial price movements based on an examination of past price movements. Like weather forecasting, technical analysis does not result in absolute predictions about the future. Instead, technical analysis can help investors anticipate what is “likely” to happen to prices over time. Technical analysis uses a wide variety of charts that show price over time.
  • 3. Three Rules to be Considered While Using Technical Analysis  According to Dow Theory there are three rules ◦ Price Discounts Everything ◦ Price Movements are not totally random ◦ “What” is more important than “Why”
  • 4. Price Discounts Everything  This theorem is similar to the strong and semi- strong forms of market efficiency. Technical analysts believe that the current price fully reflects all information. Because all information is already reflected in the price, it represents the fair value, and should form the basis for analysis. After all, the market price reflects the sum knowledge of all participants, including traders, investors, portfolio managers, buy-side analysts, sell-side analysts, market strategist, technical analysts, fundamental analysts and many others. It would be folly to disagree with the price set by such an impressive array of people with impeccable credentials
  • 5. Price Movements are not Totally Random  Most technicians agree that prices trend. However, most technicians also acknowledge that there are periods when prices do not trend. If prices were always random, it would be extremely difficult to make money using technical analysis.  Jack Schwager states: “One way of viewing it is that markets may witness extended periods of random fluctuation, interspersed with shorter periods of nonrandom behavior. The goal of the chartist is to identify those periods (i.e. major trends).”
  • 6.
  • 7. “WHAT” is more important than “WHY”  Tony Plummer paraphrases Oscar Wilde by stating, “A technical analyst knows the price of everything, but the value of nothing”.  Technical Analyst mainly focuses on two aspects ◦ What is the current price? ◦ What is the history of price movement.
  • 9. Introduction  Moving averages smooth the price data to form a trend following indicator. They do not predict price direction, but rather define the current direction with a lag. Moving averages lag because they are based on past prices. Despite this lag, moving averages help smooth price action and filter out the noise.  There are two types of moving averages ◦ Simple Moving Average ◦ Exponential Moving Average
  • 10. Simple Moving Average  A simple moving average is formed by computing the average price of a security over a specific number of periods. Most moving averages are based on closing prices. A 5-day simple moving average is the five day sum of closing prices divided by five. As its name implies, a moving average is an average that moves. Old data is dropped as new data comes available. This causes the average to move along the time scale. Daily Closing Prices: 11,12,13,14,15,16,17  First day of 5-day SMA: (11 + 12 + 13 + 14 + 15) / 5 = 13  Second day of 5-day SMA: (12 + 13 + 14 + 15 + 16) / 5 = 14  Third day of 5-day SMA: (13 + 14 + 15 + 16 + 17) / 5 = 15
  • 11.
  • 12. Exponential Moving Average  Exponential moving averages reduce the lag by applying more weight to recent prices. The weighting applied to the most recent price depends on the number of periods in the moving average. There are three steps to calculating an exponential moving average. First, calculate the simple moving average. An exponential moving average (EMA) has to start somewhere so a simple moving average is used as the previous period's EMA in the first calculation. Second, calculate the weighting multiplier. Third, calculate the exponential moving average. The formula below is for a 10-day EMA.  SMA: 10 period sum / 10 Multiplier: (2 / (Time periods + 1) ) = (2 / (10 + 1) ) = 0.1818 (18.18%) EMA: {Close - EMA(previous day)} x multiplier + EMA(previousday).
  • 13. Simple v/s Weighted MA  Even though there are clear differences between simple moving averages and exponential moving averages, one is not necessarily better than the other. Exponential moving averages have less lag and are therefore more sensitive to recent prices - and recent price changes. Exponential moving averages will turn before simple moving averages. Simple moving averages, on the other hand, represent a true average of prices for the entire time period. As such, simple moving averages may be better suited to identify support or resistance levels
  • 14. The Lag Factor  The longer the moving average, the more the lag. A 10-day exponential moving average will hug prices quite closely and turn shortly after prices turn. Short moving averages are like speed boats - nimble and quick to change. In contrast, a 100-day moving average contains lots of past data that slows it down. Longer moving averages are like ocean tankers - lethargic and slow to change. It takes a larger and longer price movement for a 100-day moving average to change course.
  • 16. Introduction  The Average Directional Index (ADX), Minus Directional Indicator (-DI) and Plus Directional Indicator (+DI) represent a group of directional movement indicators that form a trading system developed by Welles Wilder. Wilder designed ADX with commodities and daily prices in mind, but these indicators can also be applied to stocks. The Average Directional Index (ADX) measures trend strength without regard to trend direction. The other two indicators, Plus Directional Indicator (+DI) and Minus Directional Indicator (- DI), complement ADX by defining trend direction. Used together, chartists can determine both the direction and strength of the trend.
  • 17. Directional Movement  Plus Directional Movement (+DM) and Minus Directional Movement (-DM) form the backbone of the Average Directional Index (ADX). Wilder determined directional movement by comparing the difference between two consecutive lows with the difference between the highs.  Directional movement is positive (plus) when the current high minus the prior high is greater than the prior low minus the current low. This so-called Plus Directional Movement (+DM) then equals the current high minus the prior high, provided it is positive. A negative value would simply be entered as zero.  Directional movement is negative (minus) when the prior low minus the current low is greater than the current high minus the prior high. This so-called Minus Directional Movement (-DM) equals the prior low minus the current low, provided it is positive. A negative value would simply be entered as zero.
  • 18. Calculation The example below is based on a 14-day ADX calculation.  1. Calculate the True Range (TR), Plus Directional Movement (+DM) and Minus Directional Movement (-DM) for each period.  2. Smooth these periodic values using the Wilder's smoothing techniques.  3. Divide the 14-day smoothed Plus Directional Movement (+DM) by the 14-day smoothed True Range to find the 14-day Plus Directional Indicator (+DI14). Multiply by 100 to move the decimal point two places. This +DI14 is the Plus Directional Indicator (green line) that is plotted along with ADX.  4. Divide the 14-day smoothed Minus Directional Movement (-DM) by the 14-day smoothed True Range to find the 14-day Minus Directional Indicator (-DI14). Multiply by 100 to move the decimal point two places. This -DI14 is the Minus Directional Indicator (red line) that is plotted along with ADX.  5. The Directional Movement Index (DX) equals the absolute value of +DI14 less - DI14 divided by the sum of +DI14 and - DI14.  6. After all these steps, it is time to calculate the Average Directional Index (ADX). The first ADX value is simply a 14-day average of DX. Subsequent ADX values are smoothed by multiplying the previous 14-day ADX value by 13, adding the most recent DX value and dividing this total by 14.
  • 19. Wilder’s Smoothing  First TR14 = Sum of first 14 periods of TR1  Second TR14 = First TR14 - (First TR14/14) + Current TR1  Subsequent Values = Prior TR14 - (Prior TR14/14) + Current TR1
  • 20.
  • 21. Interpretation  The Average Directional Index (ADX) is used to measure the strength or weakness of a trend, not the actual direction. Directional movement is defined by +DI and -DI. In general, the bulls have the edge when +DI is greater than - DI, while the bears have the edge when - DI is greater. Crosses of these directional indicators can be combined with ADX for a complete trading system.
  • 22.
  • 24. Introduction  A derivative is a security with a price that is dependent upon or derived from one or more underlying assets. The derivative itself is a contract between two or more parties based upon the asset or assets. Its value is determined by fluctuations in the underlying asset. The most common underlying assets include stocks, bonds, commodities, currencies, intere st rates and market indexes.  Derivatives either be traded over-the-counter (OTC) or on an exchange. OTC derivatives constitute the greater proportion of derivatives in existence and are unregulated, whereas derivatives traded on exchanges are standardized. OTC derivatives generally have greater risk for the counterparty than do standardized derivatives.
  • 25.  Derivatives are further divided into three parts ◦ Forward Contract ◦ Future Contract ◦ Option Contract  A forward contract is a customized contract between two parties to buy or sell an asset at a specified price on a future date. A forward contract can be used for hedging or speculation, although its non-standardized nature makes it particularly apt for hedging.  A futures contract is a legal agreement, generally made on the trading floor of a futures exchange, to buy or sell a particular commodity or financial instrument at a predetermined price at a specified time in the future. Futures contracts are standardized to facilitate trading on a futures exchange and, depending on the underlying asset being traded, detail the quality and quantity of the commodity.
  • 26.  An options contract is an agreement between two parties to facilitate a potential transaction on the underlying security at a preset price, referred to as the strike price, prior to the expiration date. The two types of contracts are put and call options, which can be purchased to speculate on the direction of stocks or stock indices, or sold to generate income.  Call Option - A call option is an agreement that gives an investor the right, but not the obligation, to buy a stock, bond, commodity or other instrument at a specified price within a specific time period.  Put option - A put option is an option contract giving the owner the right, but not the obligation, to sell a specified amount of an underlying security at a specified price within a specified time. This is the opposite of a call option, which gives the holder the right to buy shares.
  • 27. Basic Terminology  Strike Price – The price at which the derivative contract is exercised is known as strike price.  Spot Price – The current price at which the security can be bought or sold is known as spot price.  In the money - A call option is said to be in the money when the current market price of the stock is above the strike price of the call. It is "in the money" because the holder of the call has the right to buy the stock below its current market price.  At the money - At the money is a situation where an option's strike price is identical to the price of the underlying security.  Out the money - Out of the money (OTM) is term used to describe a call option with a strike price that is higher than the market price of the underlying asset, or a put option with a strike price that is lower than the market price of the underlying asset.  Intrinsic Value - The intrinsic value is the difference between the underling's price and the strike price.  Premium - An option premium is the income received by an investor who sells or "writes" an option contract to another party. An option premium may also refer to the current price of any specific option contract that has yet to expire.
  • 28.
  • 29.
  • 30. How to Calculate Option Price Black Scholes Model