Download as PDF, PPTX


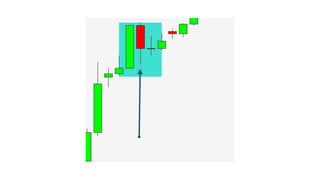


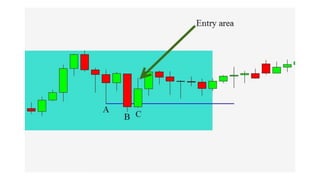


The document explains basic market trends and trading strategies, specifically focusing on pullbacks in trending markets. It discusses the distinction between simple and complex pullbacks, how to identify them on different time frames, and strategies for entering trades based on these patterns. The document emphasizes understanding price action and market structure to improve trading accuracy and avoid common pitfalls associated with standard trading methods.