Objective
Technical indicators usemathematical formulae to compute
certain values which can be used to identify bullish and bearish
trends in the market. These have been discussed in this chapter.
3.
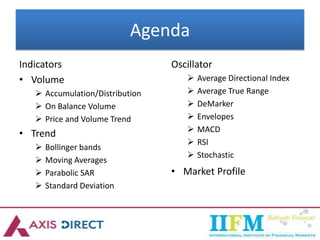
Agenda
Indicators
• Volume
Accumulation/Distribution
On Balance Volume
Price and Volume Trend
• Trend
Bollinger bands
Moving Averages
Parabolic SAR
Standard Deviation
Oscillator
Average Directional Index
Average True Range
DeMarker
Envelopes
MACD
RSI
Stochastic
• Market Profile
4.
Technical Indicators
• Basedon mathematical calculations on price and/or volume
• Values obtained are thus used to forecast probable price
changes
• There are many technical indicators already developed
• Types
Volume
Oscillator
Trend/ Momentum
5.
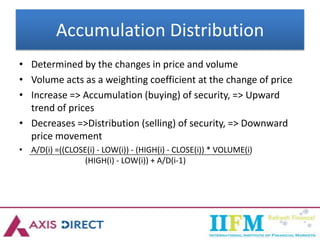
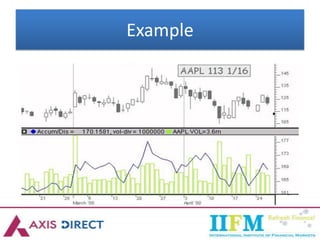
Accumulation Distribution
• Determinedby the changes in price and volume
• Volume acts as a weighting coefficient at the change of price
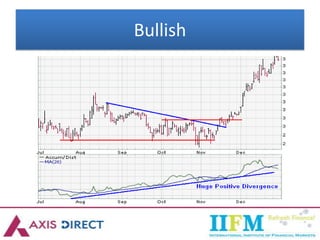
• Increase => Accumulation (buying) of security, => Upward
trend of prices
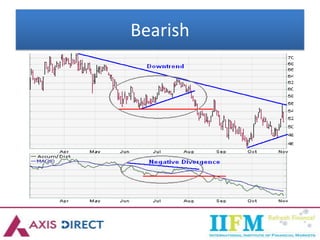
• Decreases =>Distribution (selling) of security, => Downward
price movement
• A/D(i) =((CLOSE(i) - LOW(i)) - (HIGH(i) - CLOSE(i)) * VOLUME(i)
(HIGH(i) - LOW(i)) + A/D(i-1)
On Balance Volume
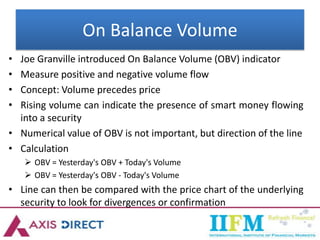
•Joe Granville introduced On Balance Volume (OBV) indicator
• Measure positive and negative volume flow
• Concept: Volume precedes price
• Rising volume can indicate the presence of smart money flowing
into a security
• Numerical value of OBV is not important, but direction of the line
• Calculation
OBV = Yesterday's OBV + Today's Volume
OBV = Yesterday's OBV - Today's Volume
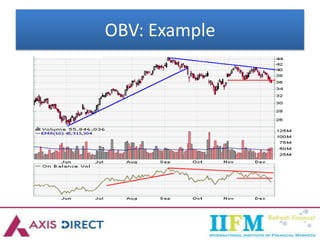
• Line can then be compared with the price chart of the underlying
security to look for divergences or confirmation
Price and VolumeTrend
• Growing sum of values of the trade volume calculated
regarding the change of closing prices
• A part of the current volume is added or subtracted
Depends on the movement of price in respective time period
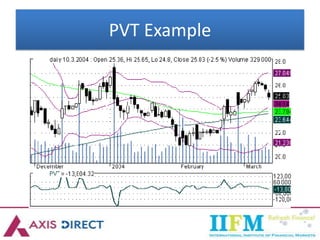
• PVT is considered more precise than OBV in showing the
dynamics of trade volume
• Trend matters more than value
• Calculation
13
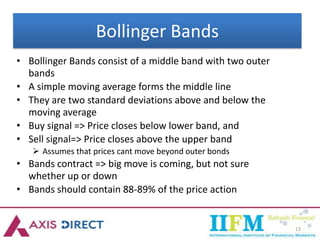
Bollinger Bands
• BollingerBands consist of a middle band with two outer
bands
• A simple moving average forms the middle line
• They are two standard deviations above and below the
moving average
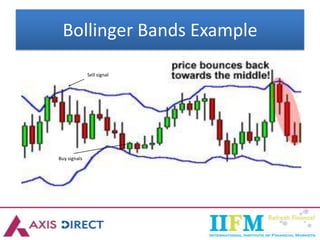
• Buy signal => Price closes below lower band, and
• Sell signal=> Price closes above the upper band
Assumes that prices cant move beyond outer bonds
• Bands contract => big move is coming, but not sure
whether up or down
• Bands should contain 88-89% of the price action
Moving Averages
• Movingaverages smooth the price data to form a trend
following indicator
• Define the current direction with a lag
• MA can be taken of
Top, Bottom, Close or Open
• Two most popular types are
Simple, Exponential, Smoothed, Linear weighted Moving Average
(EMA)
18.
• Helps inidentifying the trend
• Commonly used Moving Averages
5 (Weekly), 21 (Monthly), 200(Yearly)
• Can also be used as envelope
• 200 DMA is used as a very good resistance or Support
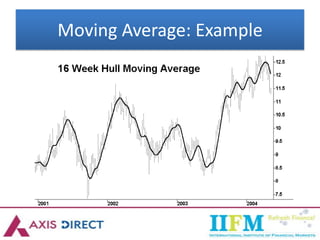
Moving Averages
19.
Adding Weights ofAverage
• Latest price has more importance than the previous prices
• Weights are added to price in such a way that the newer
prices get more importance in calculating the average
• This method is called Weighted Moving Average
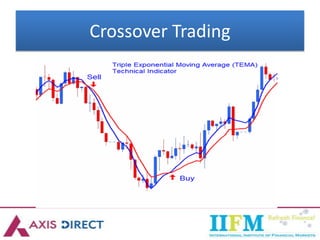
Crossover Trading
• Whenthe faster moving average crosses over the slower
average, a corresponding buy or sell signal can be generated
• Example: If 10 Moving Average increases to more than 30
Moving Average, a BUY trade can be performed
• Example: If 10 Moving Average decreases to less than 30
Moving Average, a SELL trade can be performed
23.
Parabolic SAR
• Developedby Welles Wilder, known as “Stop And Reversal”
• SAR sets trailing price stops for long or short positions
• Parabolic SAR is more popular for setting stops than for
establishing direction or trend
• Establishing the trend first, and then trading with Parabolic SAR
in the direction of the trend
• Trend is up => buy when the indicator moves below the price
• Trend is down=> sell when the indicator moves above the price
• The Parabolic SAR works best during strong trending periods,
• Estimates occur roughly 30% of the time
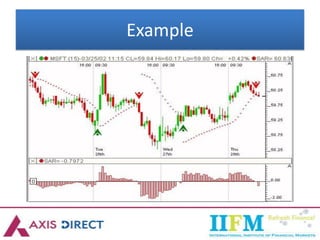
Use
• The dottedlines below the price establish the trailing stop for
a long position and
• The lines above establish the trailing stop for a short position
• There are two variables: the step and the maximum step
The higher the step is set, the more sensitive the indicator will be to
price changes
If the step is set too high, the indicator will fluctuate above and below
the price too often, making interpretation difficult
The maximum step controls the adjustment of the SAR as the price
moves
The lower the maximum step is set, the further the trailing stop will be
from the price
Wilder recommends setting the step at .02 and the maximum step at
.20
26.
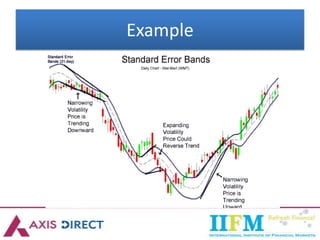
Standard Error
• Envelopewhose bands are obtained by the calculation of the
beta and alpha coefficients of linear regression
• Used to measure the strength of a trend, and it is interpreted
in a simple way
• When they begin to widen, this is a sign that the trend is
beginning to lose strength because the market is overbought
or oversold, and
Measures should therefore be taken expecting a reversal
• As for ranging markets, they have a large envelope in which
the prices tend to fluctuate
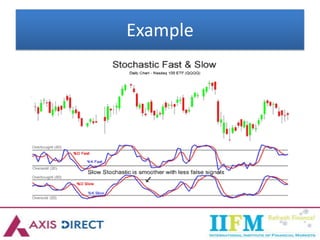
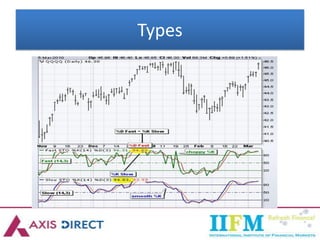
Stochastic
• A momentumindicator that shows the location of the close relative to the
high-low range over a set number of periods
• “Doesn't follow price, it doesn't follow volume or anything like that. It follows
the speed or the momentum of price. As a rule, the momentum changes
direction before price
• bullish and bearish divergences
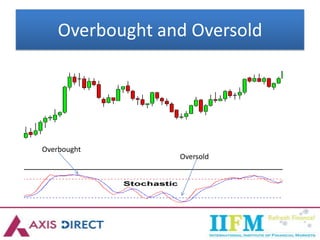
• Measures the level of the close relative to the high-low range over a given
period of time
• Low readings (below 20) indicate that price is near its low over a given time
period
• High readings (above 80) indicate that price is near its high over a give time
period
Uses
• Can alsobe used to identify turns near support or resistance
• A break above 20 to signal an upturn and successful support test
• A break below 80 to signal a downturn and resistance failure
• Settings on the Stochastic Oscillator depend on personal preference, trading
style and timeframe
• Shorter look-back period will produce a choppy oscillator with many
overbought and oversold readings
• Longer look-back period will provide a smoother oscillator with fewer
overbought and oversold readings
• In conjunction with other technical analysis tools. Volume,
support/resistance and breakouts can be used to confirm or refute signals
produced
33.
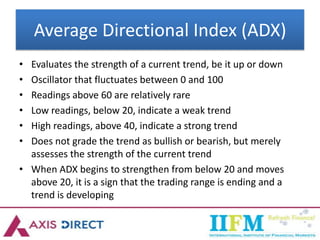
Average Directional Index(ADX)
• Evaluates the strength of a current trend, be it up or down
• Oscillator that fluctuates between 0 and 100
• Readings above 60 are relatively rare
• Low readings, below 20, indicate a weak trend
• High readings, above 40, indicate a strong trend
• Does not grade the trend as bullish or bearish, but merely
assesses the strength of the current trend
• When ADX begins to strengthen from below 20 and moves
above 20, it is a sign that the trading range is ending and a
trend is developing
34.
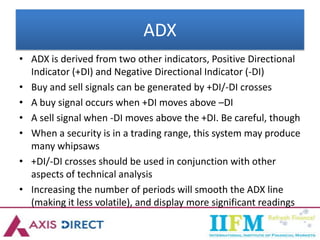
ADX
• ADX isderived from two other indicators, Positive Directional
Indicator (+DI) and Negative Directional Indicator (-DI)
• Buy and sell signals can be generated by +DI/-DI crosses
• A buy signal occurs when +DI moves above –DI
• A sell signal when -DI moves above the +DI. Be careful, though
• When a security is in a trading range, this system may produce
many whipsaws
• +DI/-DI crosses should be used in conjunction with other
aspects of technical analysis
• Increasing the number of periods will smooth the ADX line
(making it less volatile), and display more significant readings
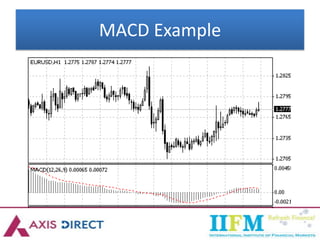
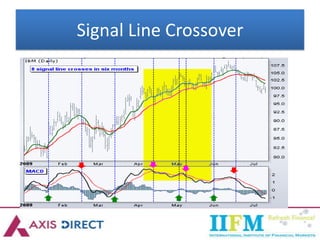
Moving Average Convergence-
Divergence(MACD)
• Developed by Gerald Appel in the late seventies
• One of the simplest and most effective momentum indicators
available
• Calculation =Shorter MA-Longer MA
• Trend following and Momentum
• Fluctuates above and below the zero line
Moving averages converge, cross and diverge
• Goes below zero => Sell Signal
• Goes above zero => buy Signal
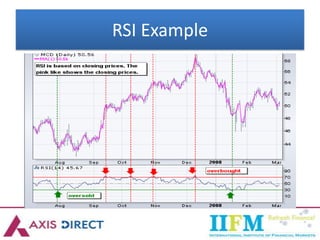
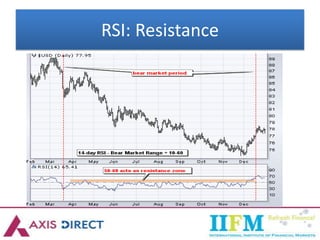
Relative Strength Index(RSI)
• J. Welles Wilder developed the Relative Strength Index (RSI) in 1978
• Extremely popular indicator
• Momentum oscillator that measures speed and change of price
movements
• RSI oscillates between zero and 100
• RSI is overbought => above 70 and
• Oversold=> below 30
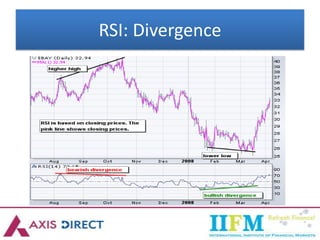
• Signals can be generated by looking for
Divergences, failure swings and centerline crossovers
• RSI can also be used to identify the general trend
• Generally period is taken as 14
RSI = 100 – 100 /(1+RS)
RS= Average Gain/ Average Loss
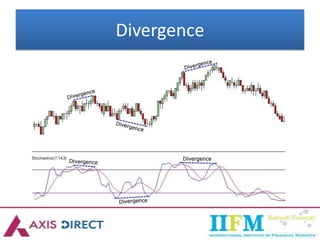
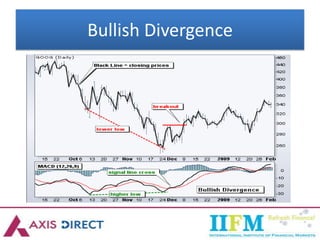
Divergence
• When theindicator and the price move in such a way that
they do not follow their standard movement, it is called as
Divergence
• In divergence, we assume that the indicator rightly depicts the
trend, and the price will soon adjust its direction to match
with the indicator values
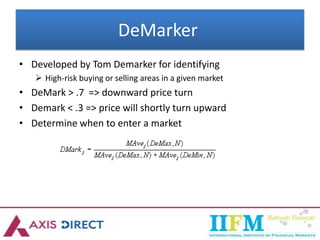
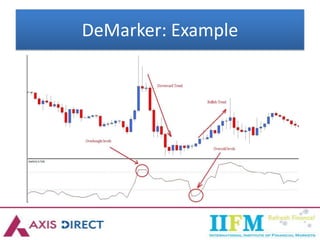
DeMarker
• Developed byTom Demarker for identifying
High-risk buying or selling areas in a given market
• DeMark > .7 => downward price turn
• Demark < .3 => price will shortly turn upward
• Determine when to enter a market
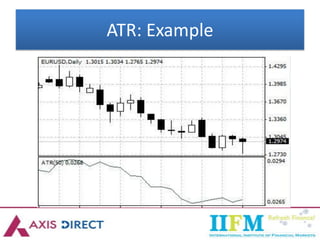
Average True Range(ATR)
• Introduced by Welles Wilder (1978)
• Shows volatility of the market
• Reflects the degree of interest or disinterest in a move
• Used as a component of numerous other indicators and
trading systems
• Low value => Weaker Trend
• High Value => Strong Trend
Market Profile
• ChicagoBoard of Trade has a registered trademark and holds
exclusive copyrights to the Market Profile charting technique
• Assumptions
• The purpose of all markets is to facilitate trade
• The markets are self regulating. The regulating constraints
include price, time, and volume
• The markets, as they attempt to facilitate trade, will use
price probes to "advertise" for sellers or buyers
The reaction to these probes provides valuable clues about the
strength or weakness of the market
51.
Market Profile
• TPO(Time-Price Opportunity)
• Helps traders to examine days such as normal, trend, neutral,
and long-term market activity charts
• The half-hour segment represents the price range that
developed over that time period
• Market's acceptance of price is where 70% of the day's
volume occurred. => day's value area
• Internal structure of the markets
• Designed to offer logical, statistically based analysis of price,
time, and volume
52.
Mix & Match
•No Indicator will work on one product all the time
• Ideally should use 2-3 indicators at one time
• Common Strategies
One to identify trend (If any) and then take another to take position
One to enter into position another to close position
Envelop of MA’s (21 day top to 21 day bottom)
Stochastic with ADX
RSI with Bollinger
RSI with Moving Averages
3 different indicators, work if 3 give same signal
• Back test it before using
• Don’t Marry a indicator, If not working move on to next