Download as PDF, PPTX


![MongoDB
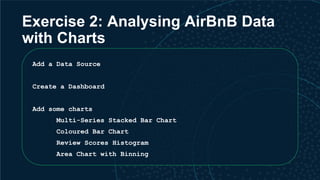
{ customer_id : 1,
first_name : "Mark",
last_name : "Smith",
city : "San Francisco",
phones: [ {
number : "1-212-777-1212",
type : "work"
},
{
number : "1-212-777-1213",
type : "cell"
}]
……...
Expressive
Queries
Find anyone with phone # “1-212…”
Check if the person with number “555…” is on the “do not call” list
Geospatial
Find the best offer for the customer at geo coordinates of 42nd St.
and 6th Ave
Text Search Find all tweets that mention the firm within the last 2 days
Aggregation
Count and sort number of customers by city, compute min, max, and
average spend
Native Binary
JSON Support
Add an additional phone number to Mark Smith’s record without
rewriting the document
Update just 2 phone numbers out of 10
Sort on the modified date
JOIN
($lookup)
Query for all San Francisco residences, lookup their transactions,
and sum the amount by person
Graph Queries
($graphLookup)
Query for all people within 3 degrees of separation from Mark
Rich query functionality](https://image.slidesharecdn.com/110-room3-dataanalyticswithmongodb-mongodb-181009183713/85/MongoDB-local-DC-2018-Tutorial-Data-Analytics-with-MongoDB-26-320.jpg)
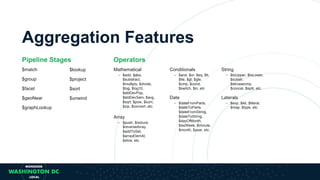
![Advanced data processing
pipeline for transformations
and analytics
Multiple stages
Similar to a unix pipe
Rich Expressions
Collection
db.orders.aggregate( [
$match stage {$match: { status: "A" } },
$group stage { $group: { _id: "$cust_id",total: { $sum: "$amount" } }
}
] )
{
cust_id: "A123",
amount: 500,
status: "A",
}
{
cust_id: "A123",
amount: 250,
status: "A",
}
{
cust_id: "B212",
amount: 200,
status: "A",
}
{
cust_id: "A123",
amount: 300,
status: "D",
}
Orders
{
cust_id: "A123",
amount: 500,
status: "A",
}
{
cust_id: "A123",
amount: 250,
status: "A",
}
{
cust_id: "B212",
amount: 200,
status: "A",
}
{
id: "A123",
total: 750
}
{
id: "B212",
total: 200
}
$match $group
Aggregations](https://image.slidesharecdn.com/110-room3-dataanalyticswithmongodb-mongodb-181009183713/85/MongoDB-local-DC-2018-Tutorial-Data-Analytics-with-MongoDB-27-320.jpg)

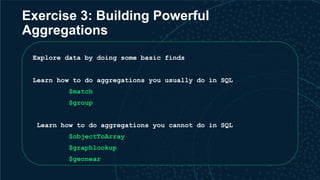

![Minimum price per night by number
of beds
Take a look at this example aggregation which computes minimum
price per night by number of beds
db.austinListingsAndReviews.aggregate( [
{
$group: {
_id: "$beds",
avg_by_beds: { $min: "$price" }
}
},
{ $sort: { avg_by_beds: 1 } }
] )](https://image.slidesharecdn.com/110-room3-dataanalyticswithmongodb-mongodb-181009183713/85/MongoDB-local-DC-2018-Tutorial-Data-Analytics-with-MongoDB-32-320.jpg)
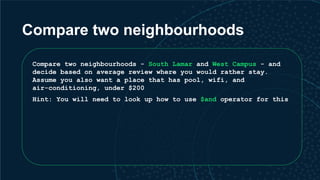
![Average price per night by room type
Construct a very similar query to find average price per night
by room type by filling in the blanks.
db.austinListingsAndReviews.aggregate( [
{
$group: {
_id: "___",
avg_by_roomtype: { $avg: "___" }
}
}}
] )](https://image.slidesharecdn.com/110-room3-dataanalyticswithmongodb-mongodb-181009183713/85/MongoDB-local-DC-2018-Tutorial-Data-Analytics-with-MongoDB-33-320.jpg)
![ANSWER: Average price per night by
room type
Construct a very similar query to find average price per night
by room type by filling in the blanks.
db.austinListingsAndReviews.aggregate( [
{
$group: {
_id: "$room_type",
avg_by_roomtype: { $avg: "$price" }
}
}}
] )](https://image.slidesharecdn.com/110-room3-dataanalyticswithmongodb-mongodb-181009183713/85/MongoDB-local-DC-2018-Tutorial-Data-Analytics-with-MongoDB-34-320.jpg)

![ANSWER: Average price per night by
suburb
db.austinListingsAndReviews.aggregate( [
{
$group: {
_id: "$address.suburb",
avg_by_suburb: { $avg: "$price" }
}
}
] )](https://image.slidesharecdn.com/110-room3-dataanalyticswithmongodb-mongodb-181009183713/85/MongoDB-local-DC-2018-Tutorial-Data-Analytics-with-MongoDB-36-320.jpg)
![Count and average price per night
Compute the count of properties and average price per night by
suburbs and number of bedrooms by filling in the blanks.
db.austinListingsAndReviews.aggregate([
{"$group" :
{
_id:{suburb:"$___", bedrooms:"$___"},
___:{$sum:1},
avg:{$___:"$price"}}
}
])](https://image.slidesharecdn.com/110-room3-dataanalyticswithmongodb-mongodb-181009183713/85/MongoDB-local-DC-2018-Tutorial-Data-Analytics-with-MongoDB-37-320.jpg)
![ANSWER: Count and average price
per night
db.austinListingsAndReviews.aggregate([
{"$group" :
{
_id:{suburb:"$address.suburb", bedrooms:"$bedrooms"},
count:{$sum:1},
avg:{$avg:"$price"}}
}
])](https://image.slidesharecdn.com/110-room3-dataanalyticswithmongodb-mongodb-181009183713/85/MongoDB-local-DC-2018-Tutorial-Data-Analytics-with-MongoDB-38-320.jpg)
![Add $match Stage
Use the query from previous step and add a $match stage to only
show those properties that have a pool
db.austinListingsAndReviews.aggregate([
{ $match : {amenities: "Pool"} },
{"$group" :
{
_id:{suburb:"$address.suburb",bedrooms:"$bedrooms"},
count:{$sum:1},
avg:{$avg:"$price"}}
}
])](https://image.slidesharecdn.com/110-room3-dataanalyticswithmongodb-mongodb-181009183713/85/MongoDB-local-DC-2018-Tutorial-Data-Analytics-with-MongoDB-39-320.jpg)

![Average review scores for all
properties in Austin with amenities
db.austinListingsAndReviews.aggregate([
{ $match : {
amenities: { $in: ["Cable TV", "Garden or backyard",
"Coffee maker"] } } },
{ $project: { scores: { $objectToArray: "$review_scores" } } },
{ $unwind: "$scores" },
{ $group: { _id: "$scores.k", average_score: { $avg:
"$scores.v" } } }
])](https://image.slidesharecdn.com/110-room3-dataanalyticswithmongodb-mongodb-181009183713/85/MongoDB-local-DC-2018-Tutorial-Data-Analytics-with-MongoDB-41-320.jpg)
![ANSWER: South Lamar
db.austinListingsAndReviews.aggregate([
{
$match: {
$and: [
{amenities: { $in: ["Pool", "Air conditioning", "Wifi"] } },
{price: { $lt: 200 } },
{"address.suburb": "South Lamar"}
]
}
},
{ $project: { scores: { $objectToArray: "$review_scores" } } },
{ $unwind: "$scores" },
{ $group: { _id: "$scores.k", average_score: { $avg: "$scores.v" } } }
])](https://image.slidesharecdn.com/110-room3-dataanalyticswithmongodb-mongodb-181009183713/85/MongoDB-local-DC-2018-Tutorial-Data-Analytics-with-MongoDB-43-320.jpg)
![ANSWER: West Campus
db.austinListingsAndReviews.aggregate([
{
$match: {
$and: [
{amenities: { $in: ["Pool", "Air conditioning", "Wifi"] } },
{price: { $lt: 200 } },
{"address.suburb": "West Campus"}
]
}
},
{ $project: { scores: { $objectToArray: "$review_scores" } } },
{ $unwind: "$scores" },
{ $group: { _id: "$scores.k", average_score: { $avg: "$scores.v" } } }
])](https://image.slidesharecdn.com/110-room3-dataanalyticswithmongodb-mongodb-181009183713/85/MongoDB-local-DC-2018-Tutorial-Data-Analytics-with-MongoDB-44-320.jpg)

![ANSWER: $geoNear
db.austinListingsAndReviews.aggregate([
{
$geoNear: {
near: { type: "Point", coordinates: [ -97.7064386 , 30.2988474 ] },
distanceField: "dist.calculated",
maxDistance: 500,
query: { $and: [ {amenities: { $in: ["Pool", "Air conditioning", "Wifi"] } },
{price: { $lt: 200 } }]},
includeLocs: "dist.location",
num: 5,
spherical: true
}
}]).pretty()](https://image.slidesharecdn.com/110-room3-dataanalyticswithmongodb-mongodb-181009183713/85/MongoDB-local-DC-2018-Tutorial-Data-Analytics-with-MongoDB-46-320.jpg)

![$graphLookup - example
db.austinListingsAndReviews.aggregate( [
{ $match: { "reviews.reviewer_id": "7538" } } ,{ $unwind: "$reviews" },{
$graphLookup: {
from: "austinListingsAndReviews",
startWith: "$reviews.reviewer_id",
connectFromField: "reviews.reviewer_id",
connectToField: "reviews.reviewer_id",
as: "reviewed_listings",
maxDepth: 1,
depthField: "depth",
restrictSearchWithMatch: { "reviews.reviewer_id": { $ne: "7538" } }
}},
{ $project: {
_id: 0,
listing: "$_id",
url: "$listing_url" }}]).pretty()](https://image.slidesharecdn.com/110-room3-dataanalyticswithmongodb-mongodb-181009183713/85/MongoDB-local-DC-2018-Tutorial-Data-Analytics-with-MongoDB-48-320.jpg)

![ANSWER: $graphlookup
db.austinListingsAndReviews.aggregate( [
{ $match: { "host.host_id": "100208662" } },
{ $graphLookup:
{
from: "austinListingsAndReviews",
startWith: "$host.host_id",
connectFromField: "host.host_id",
connectToField: "host.host_id",
as: "multi-listing-hosts"
} }]).pretty()](https://image.slidesharecdn.com/110-room3-dataanalyticswithmongodb-mongodb-181009183713/85/MongoDB-local-DC-2018-Tutorial-Data-Analytics-with-MongoDB-50-320.jpg)


The document discusses data analytics using MongoDB, covering various tools and methods such as the MongoDB BI Connector, MongoDB Charts, and the aggregation framework. It provides examples of how to visualize data, perform ETL processes, and execute complex queries for data analysis, particularly focusing on Airbnb data analysis. Additionally, it highlights the benefits of using MongoDB's features for business intelligence and analytics tasks.


![MongoDB .local San Francisco 2020: Powering the new age data demands [Infosys]](https://cdn.slidesharecdn.com/ss_thumbnails/315pminfosysfinalsfoversionvocalpart1-200120221508-thumbnail.jpg?width=640&height=640&fit=bounds)