


![MongoDB
{ customer_id : 1,
first_name : "Mark",
last_name : "Smith",
city : "San Francisco",
phones: [ {
number : "1-212-777-1212",
type : "work"
},
{
number : "1-212-777-1213",
type : "cell"
}]
...
Expressive
Queries
Find anyone with phone # “1-212…”
Check if the person with number “555…” is on the “do not call” list
Geospatial
Find the best offer for the customer at geo coordinates of 42nd St.
and 6th Ave
Text Search Find all tweets that mention the firm within the last 2 days
Aggregation
Count and sort number of customers by city, compute min, max, and
average spend
Native Binary
JSON Support
Add an additional phone number to Mark Smith’s record without
rewriting the document
Update just 2 phone numbers out of 10
Sort on the modified date
JOIN
($lookup)
Query for all San Francisco residences, lookup their transactions,
and sum the amount by person
Graph Queries
($graphLookup)
Query for all people within 3 degrees of separation from Mark
Rich query functionality](https://image.slidesharecdn.com/dataanalyticswithmongodb-mdbe18-181113145328/85/Data-Analytics-with-MongoDB-Jane-Fine-20-320.jpg)
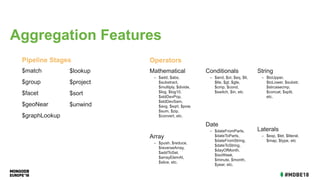
![Advanced data processing
pipeline for transformations
and analytics
Multiple stages
Similar to a unix pipe
Rich Expressions
Collection
db.orders.aggregate( [
$match stage {$match: { status: "A" } },
$group stage { $group: { _id:
"$cust_id",total: { $sum: "$amount" } } }
] )
{
cust_id: "A123",
amount: 500,
status: "A",
}
{
cust_id: "A123",
amount: 250,
status: "A",
}
{
cust_id: "B212",
amount: 200,
status: "A",
}
{
cust_id: "A123",
amount: 300,
status: "D",
}
Orders
{
cust_id: "A123",
amount: 500,
status: "A",
}
{
cust_id: "A123",
amount: 250,
status: "A",
}
{
cust_id: "B212",
amount: 200,
status: "A",
}
{
id: "A123",
total: 750
}
{
id: "B212",
total: 200
}
$match $group
Aggregations](https://image.slidesharecdn.com/dataanalyticswithmongodb-mdbe18-181113145328/85/Data-Analytics-with-MongoDB-Jane-Fine-21-320.jpg)


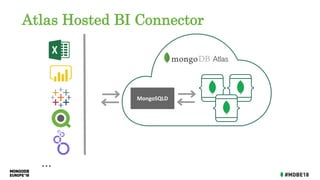
The document outlines the functionalities and use cases for data analytics using MongoDB, highlighting tools like the MongoDB BI Connector, MongoDB Charts, and MongoDB Compass. It details how these tools can visualize and explore data, perform aggregations, and support complex queries while addressing the needs of business analysts and data engineers. Various features such as schema translation, charting capabilities, and the aggregation framework are also discussed to illustrate the robustness of MongoDB for data analytics.


![MongoDB .local San Francisco 2020: Powering the new age data demands [Infosys]](https://cdn.slidesharecdn.com/ss_thumbnails/315pminfosysfinalsfoversionvocalpart1-200120221508-thumbnail.jpg?width=640&height=640&fit=bounds)