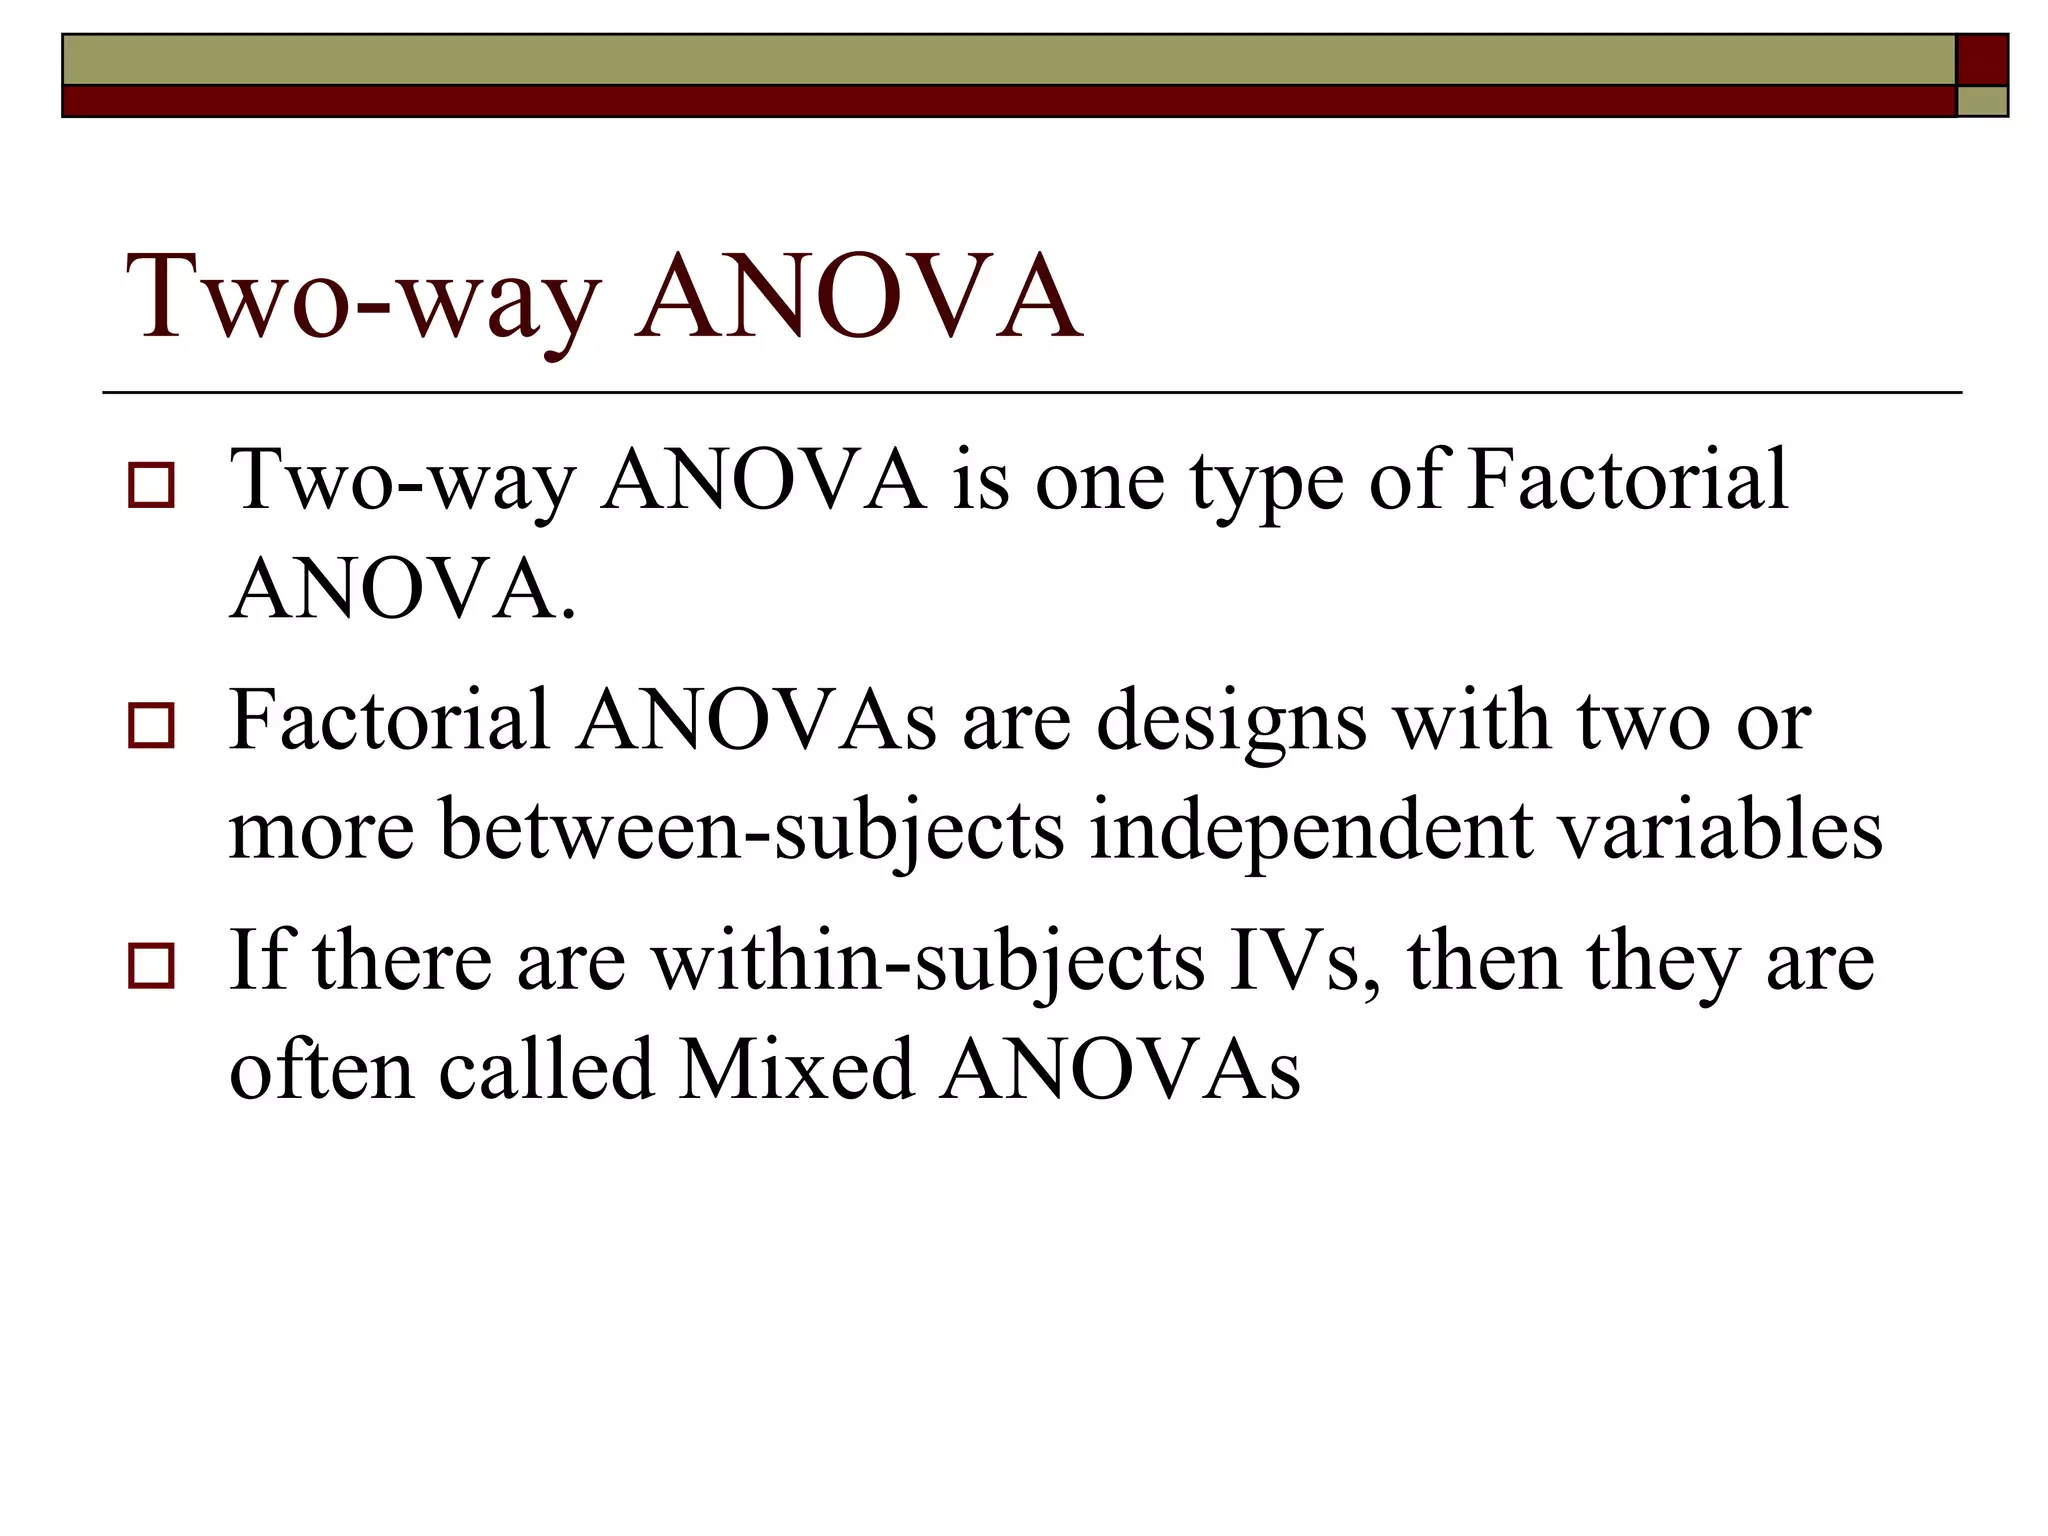
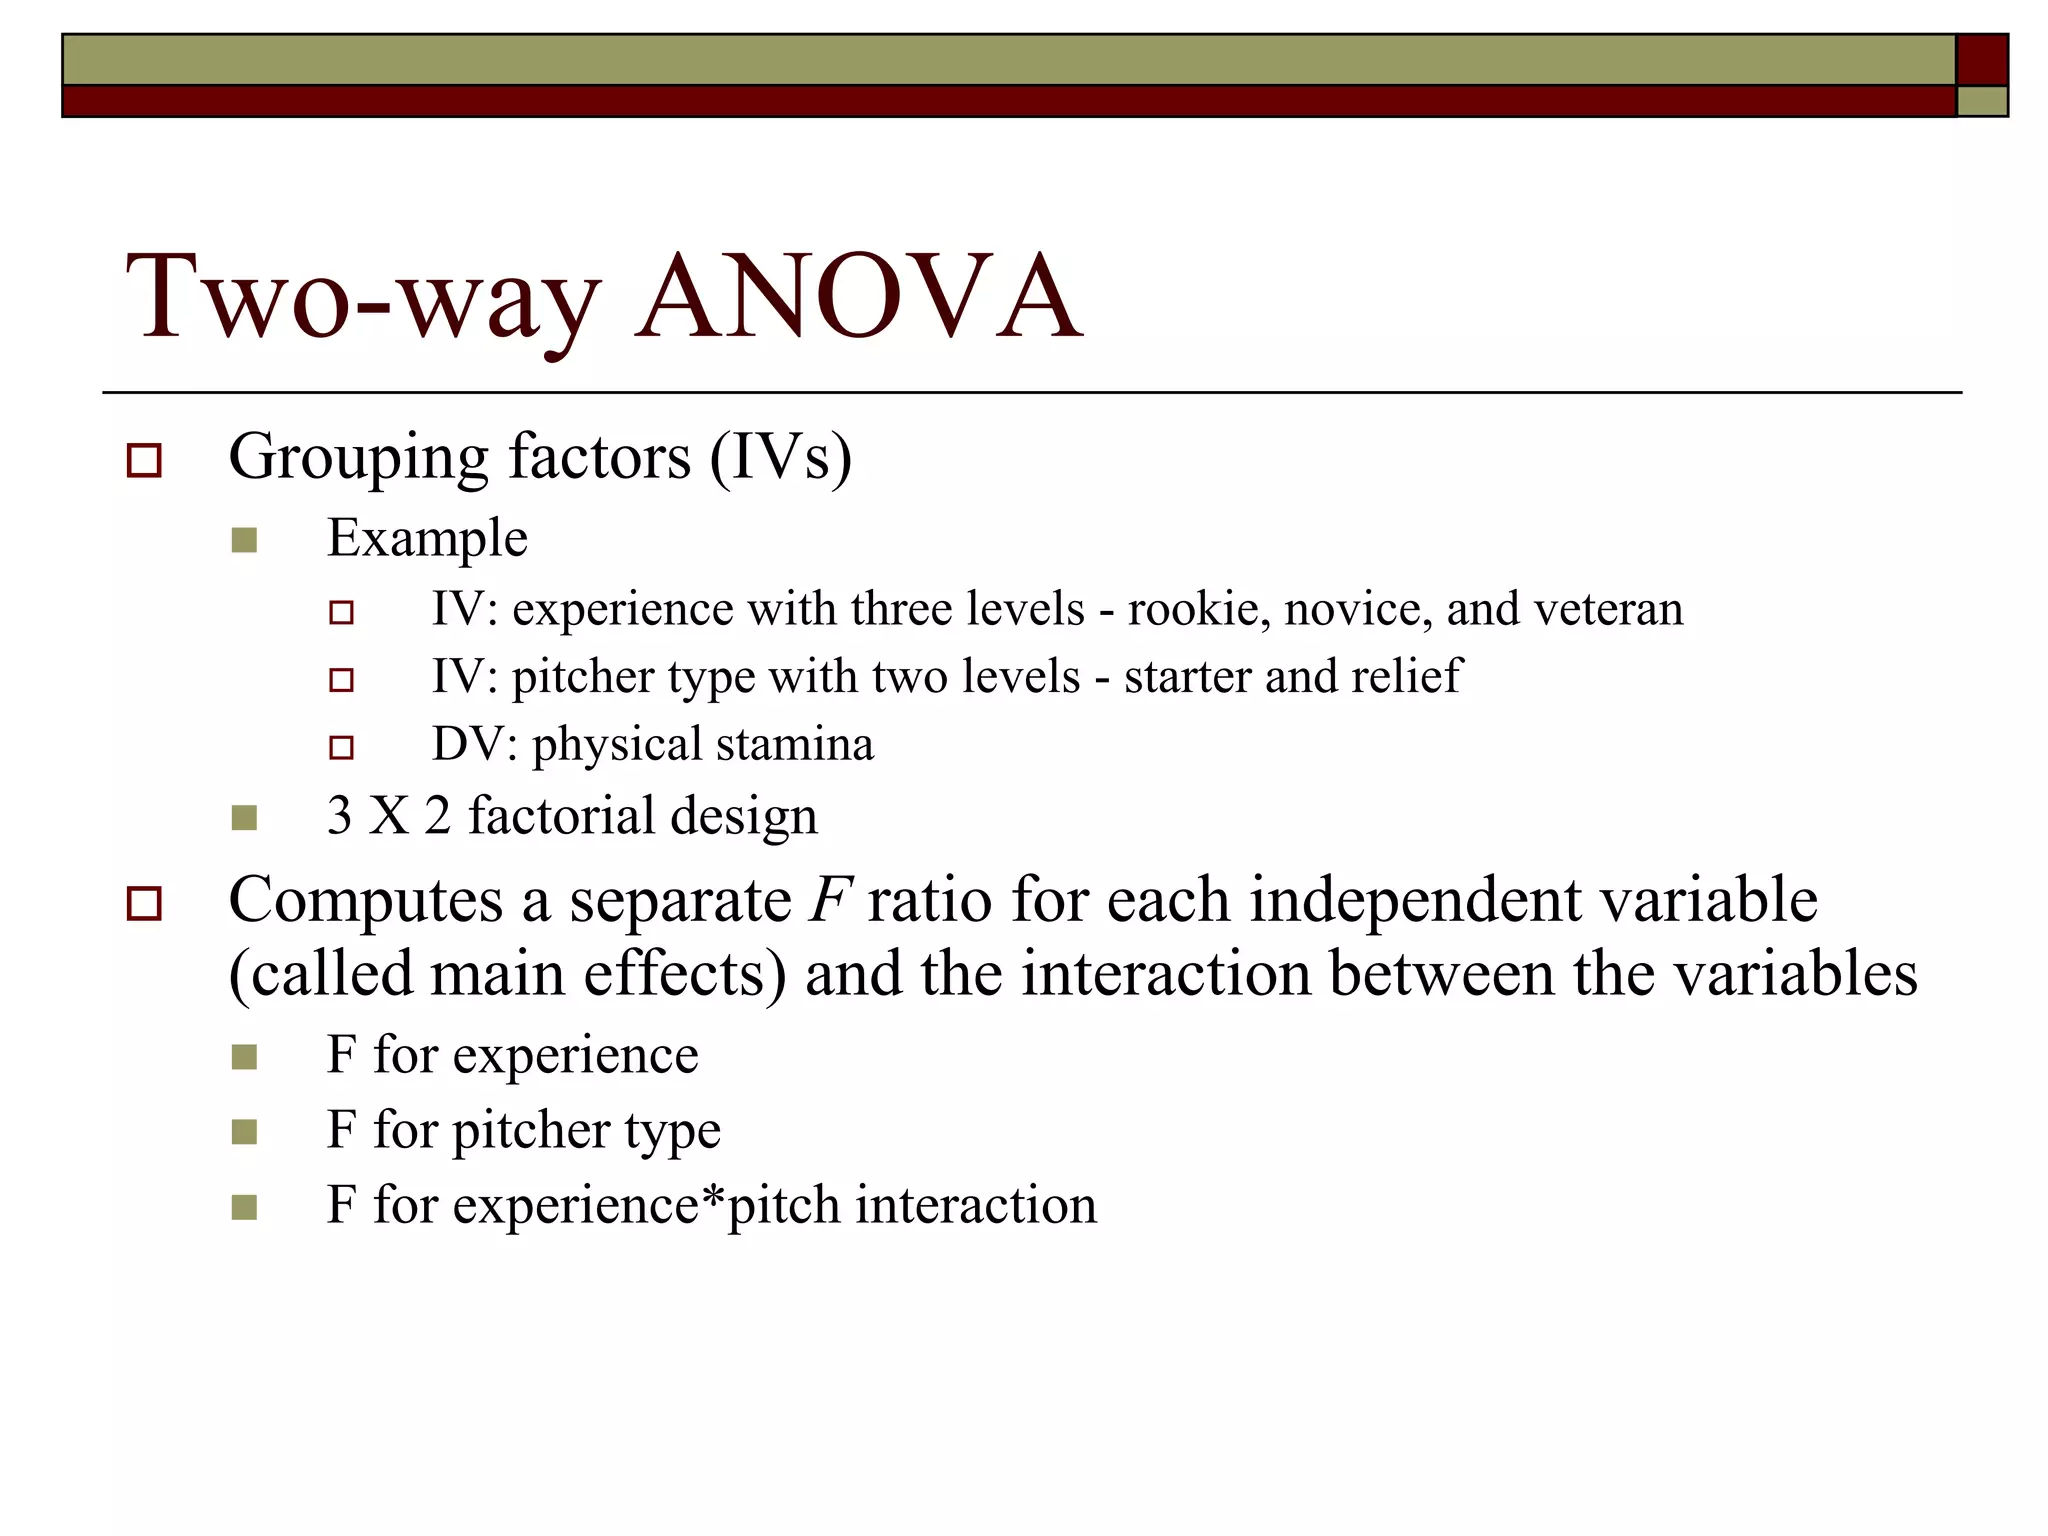
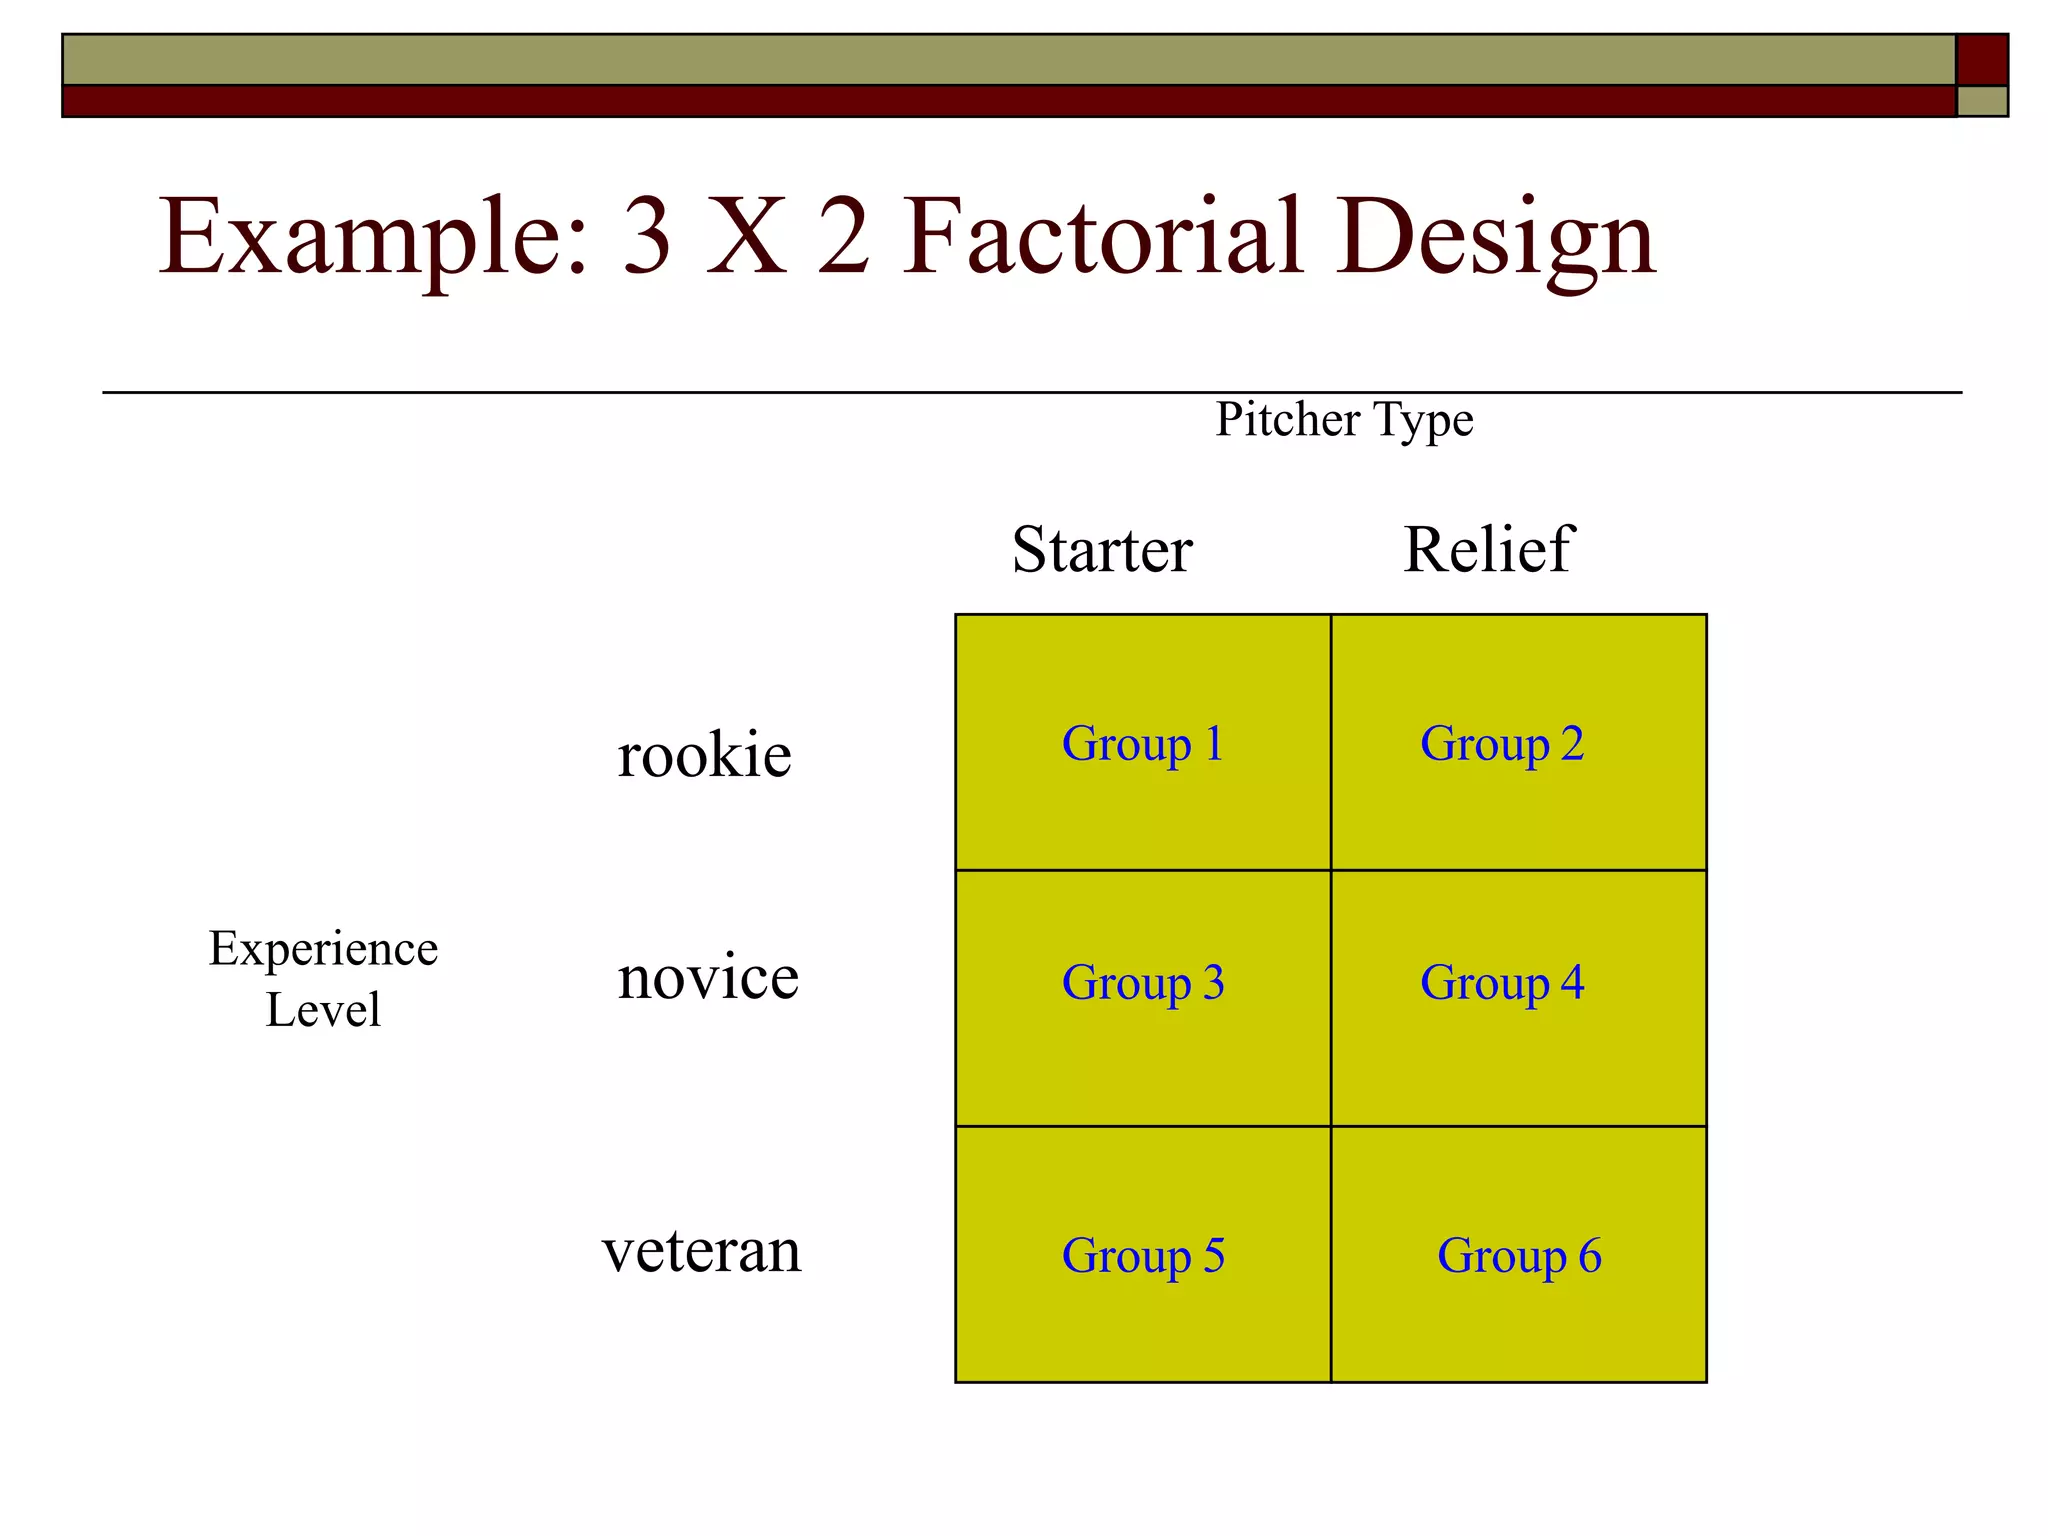
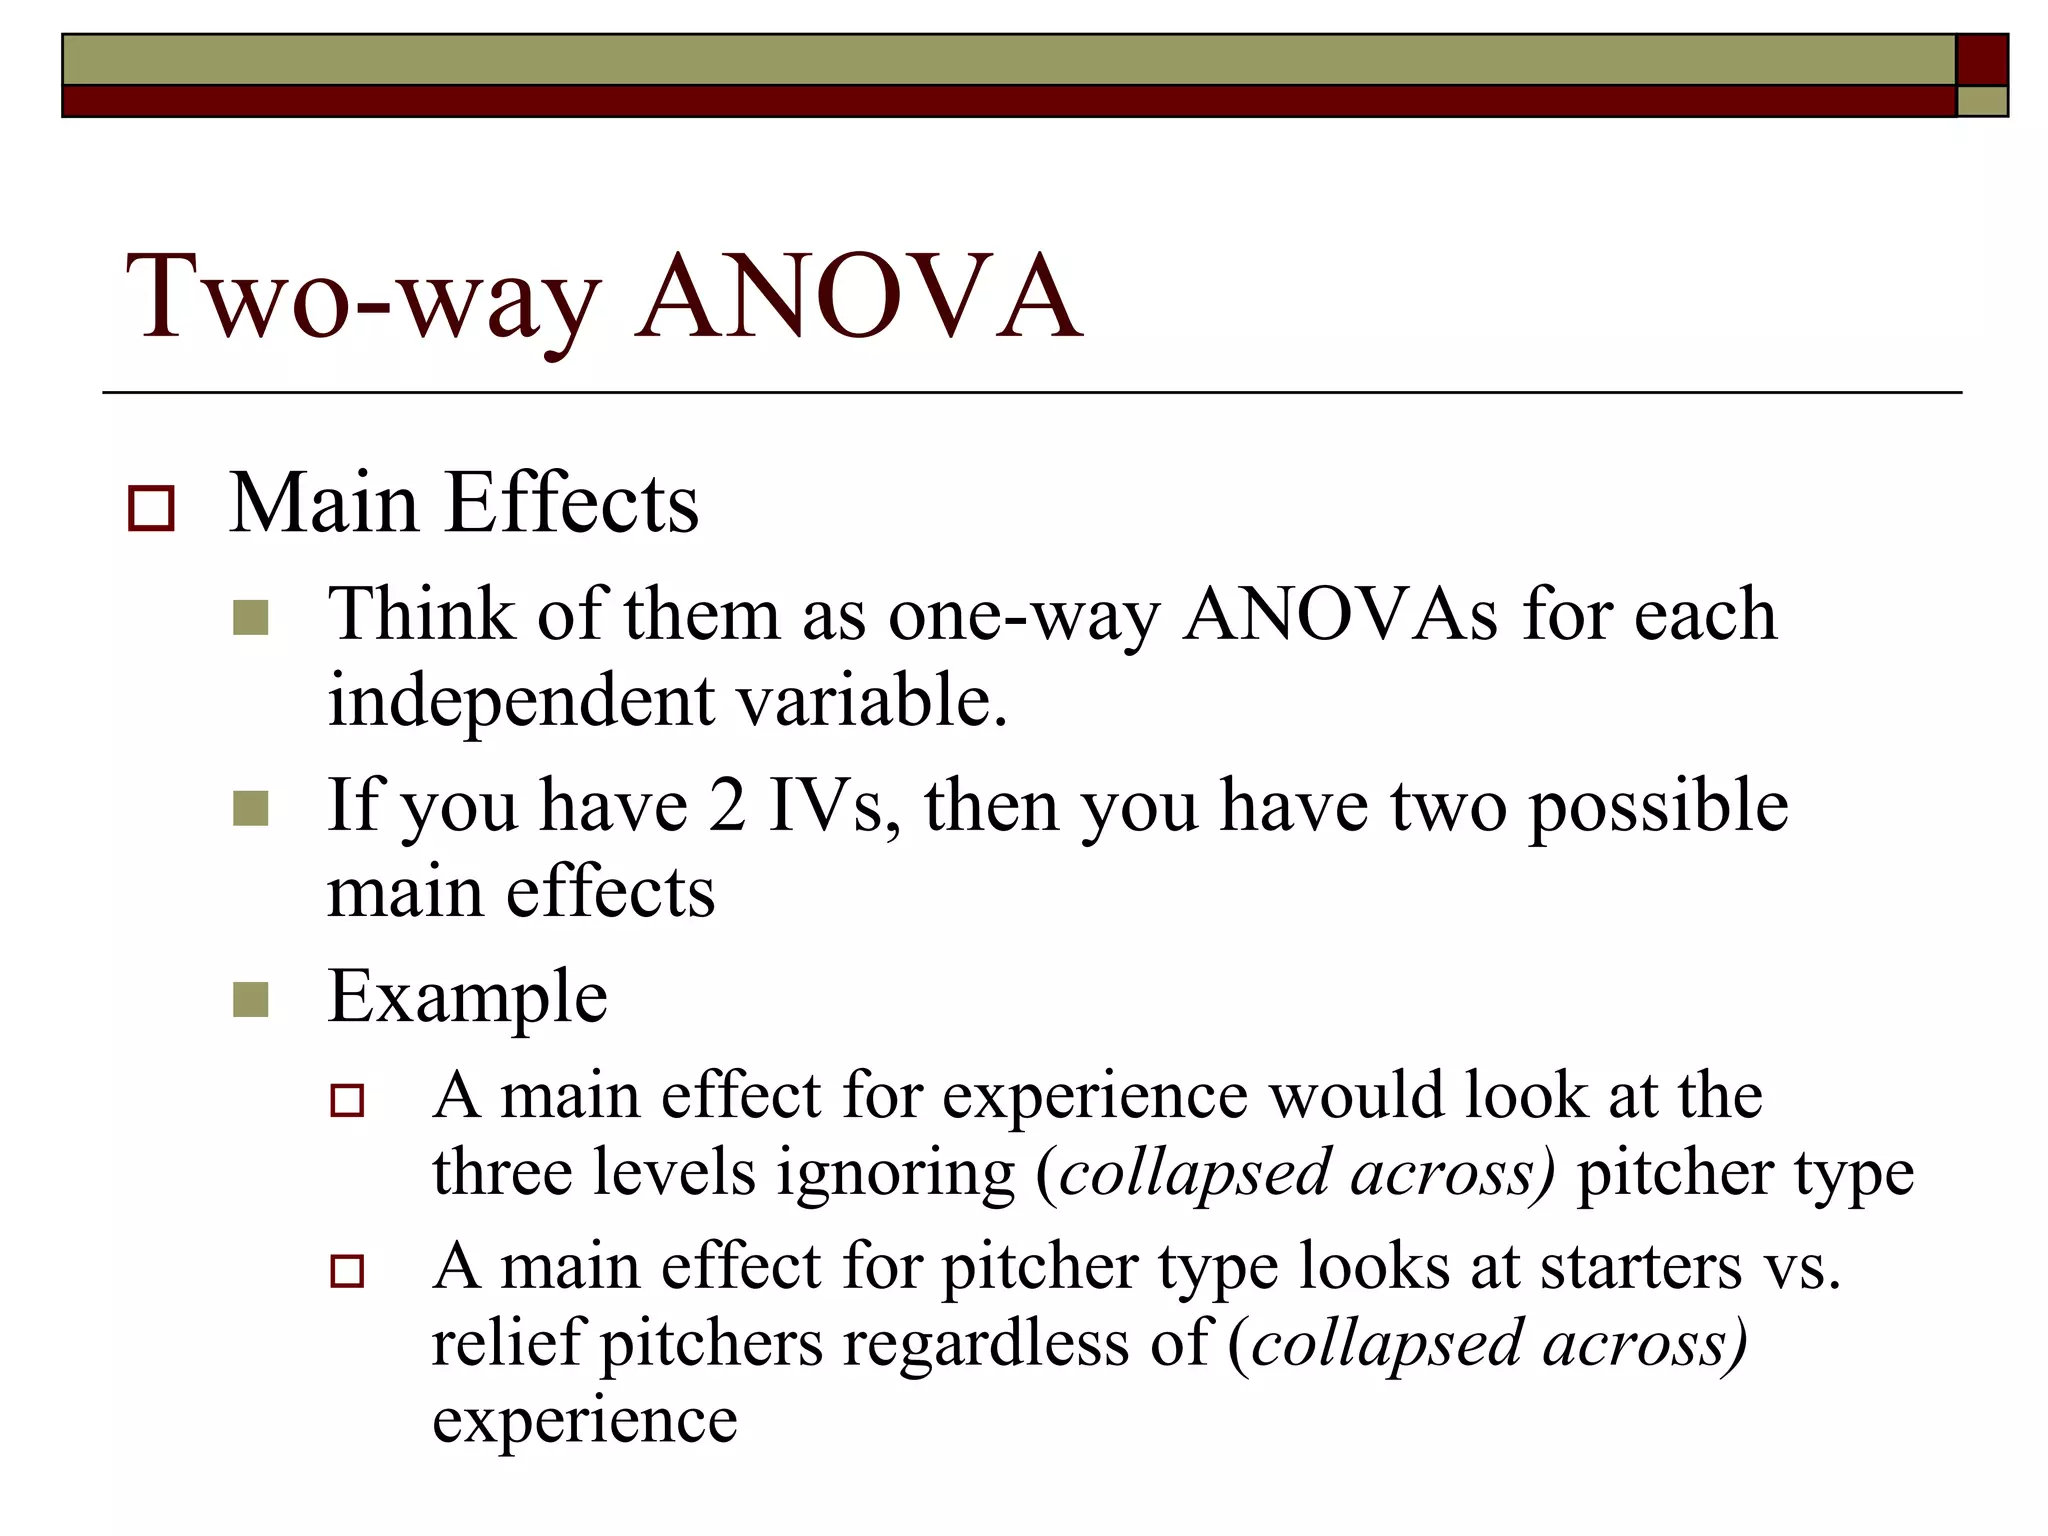
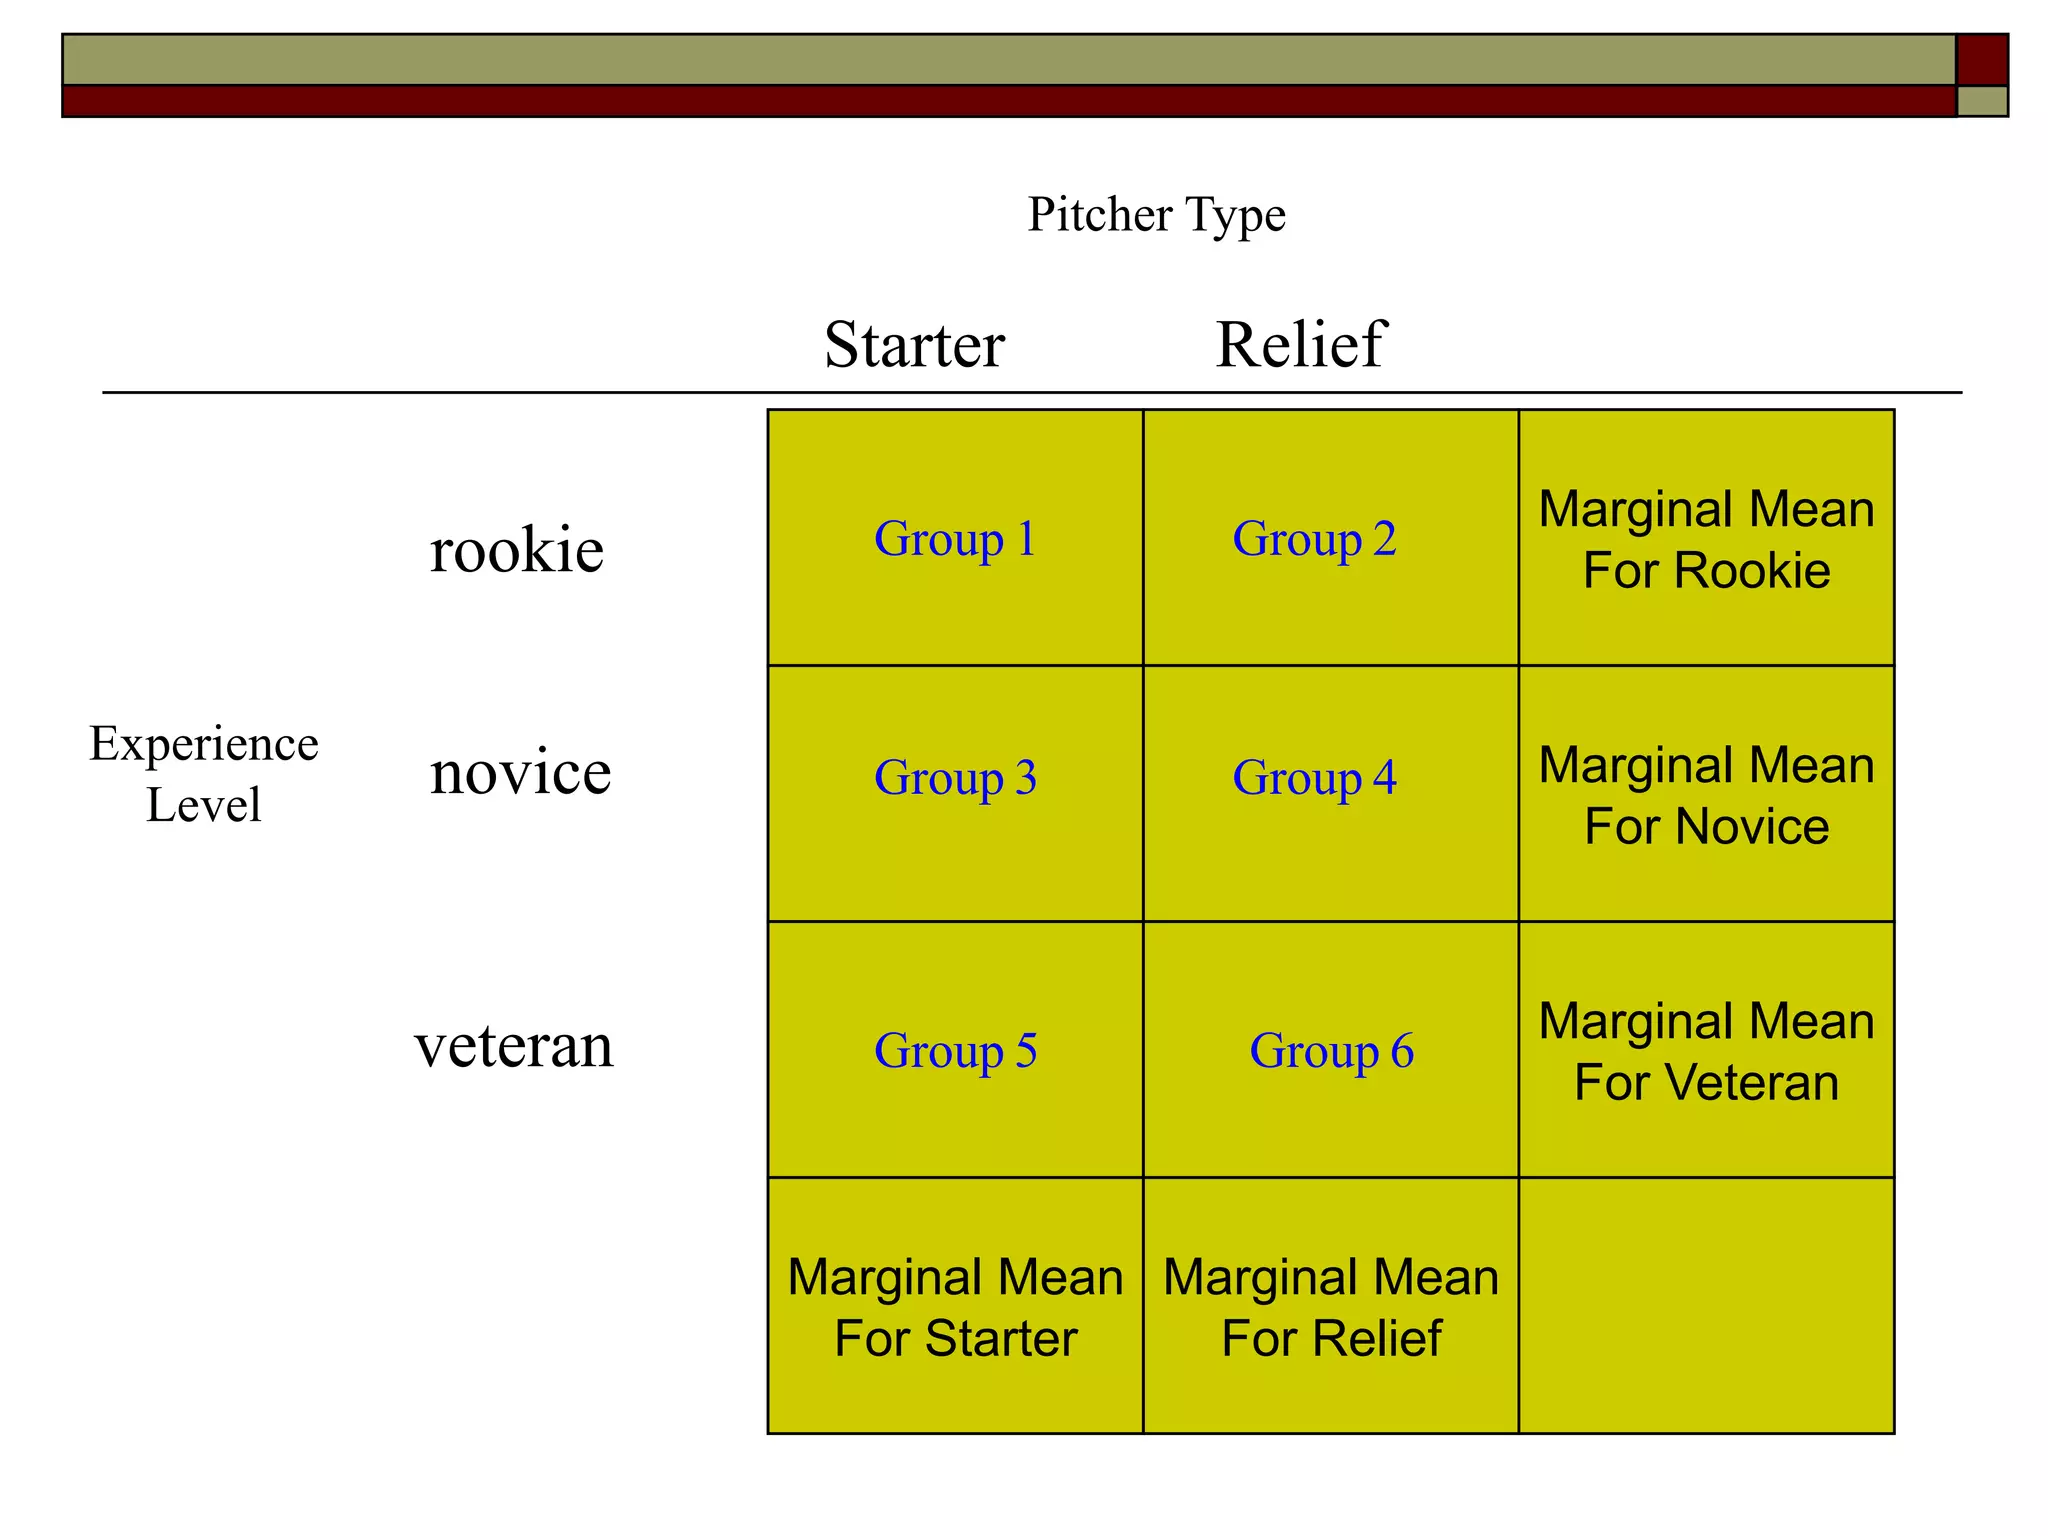
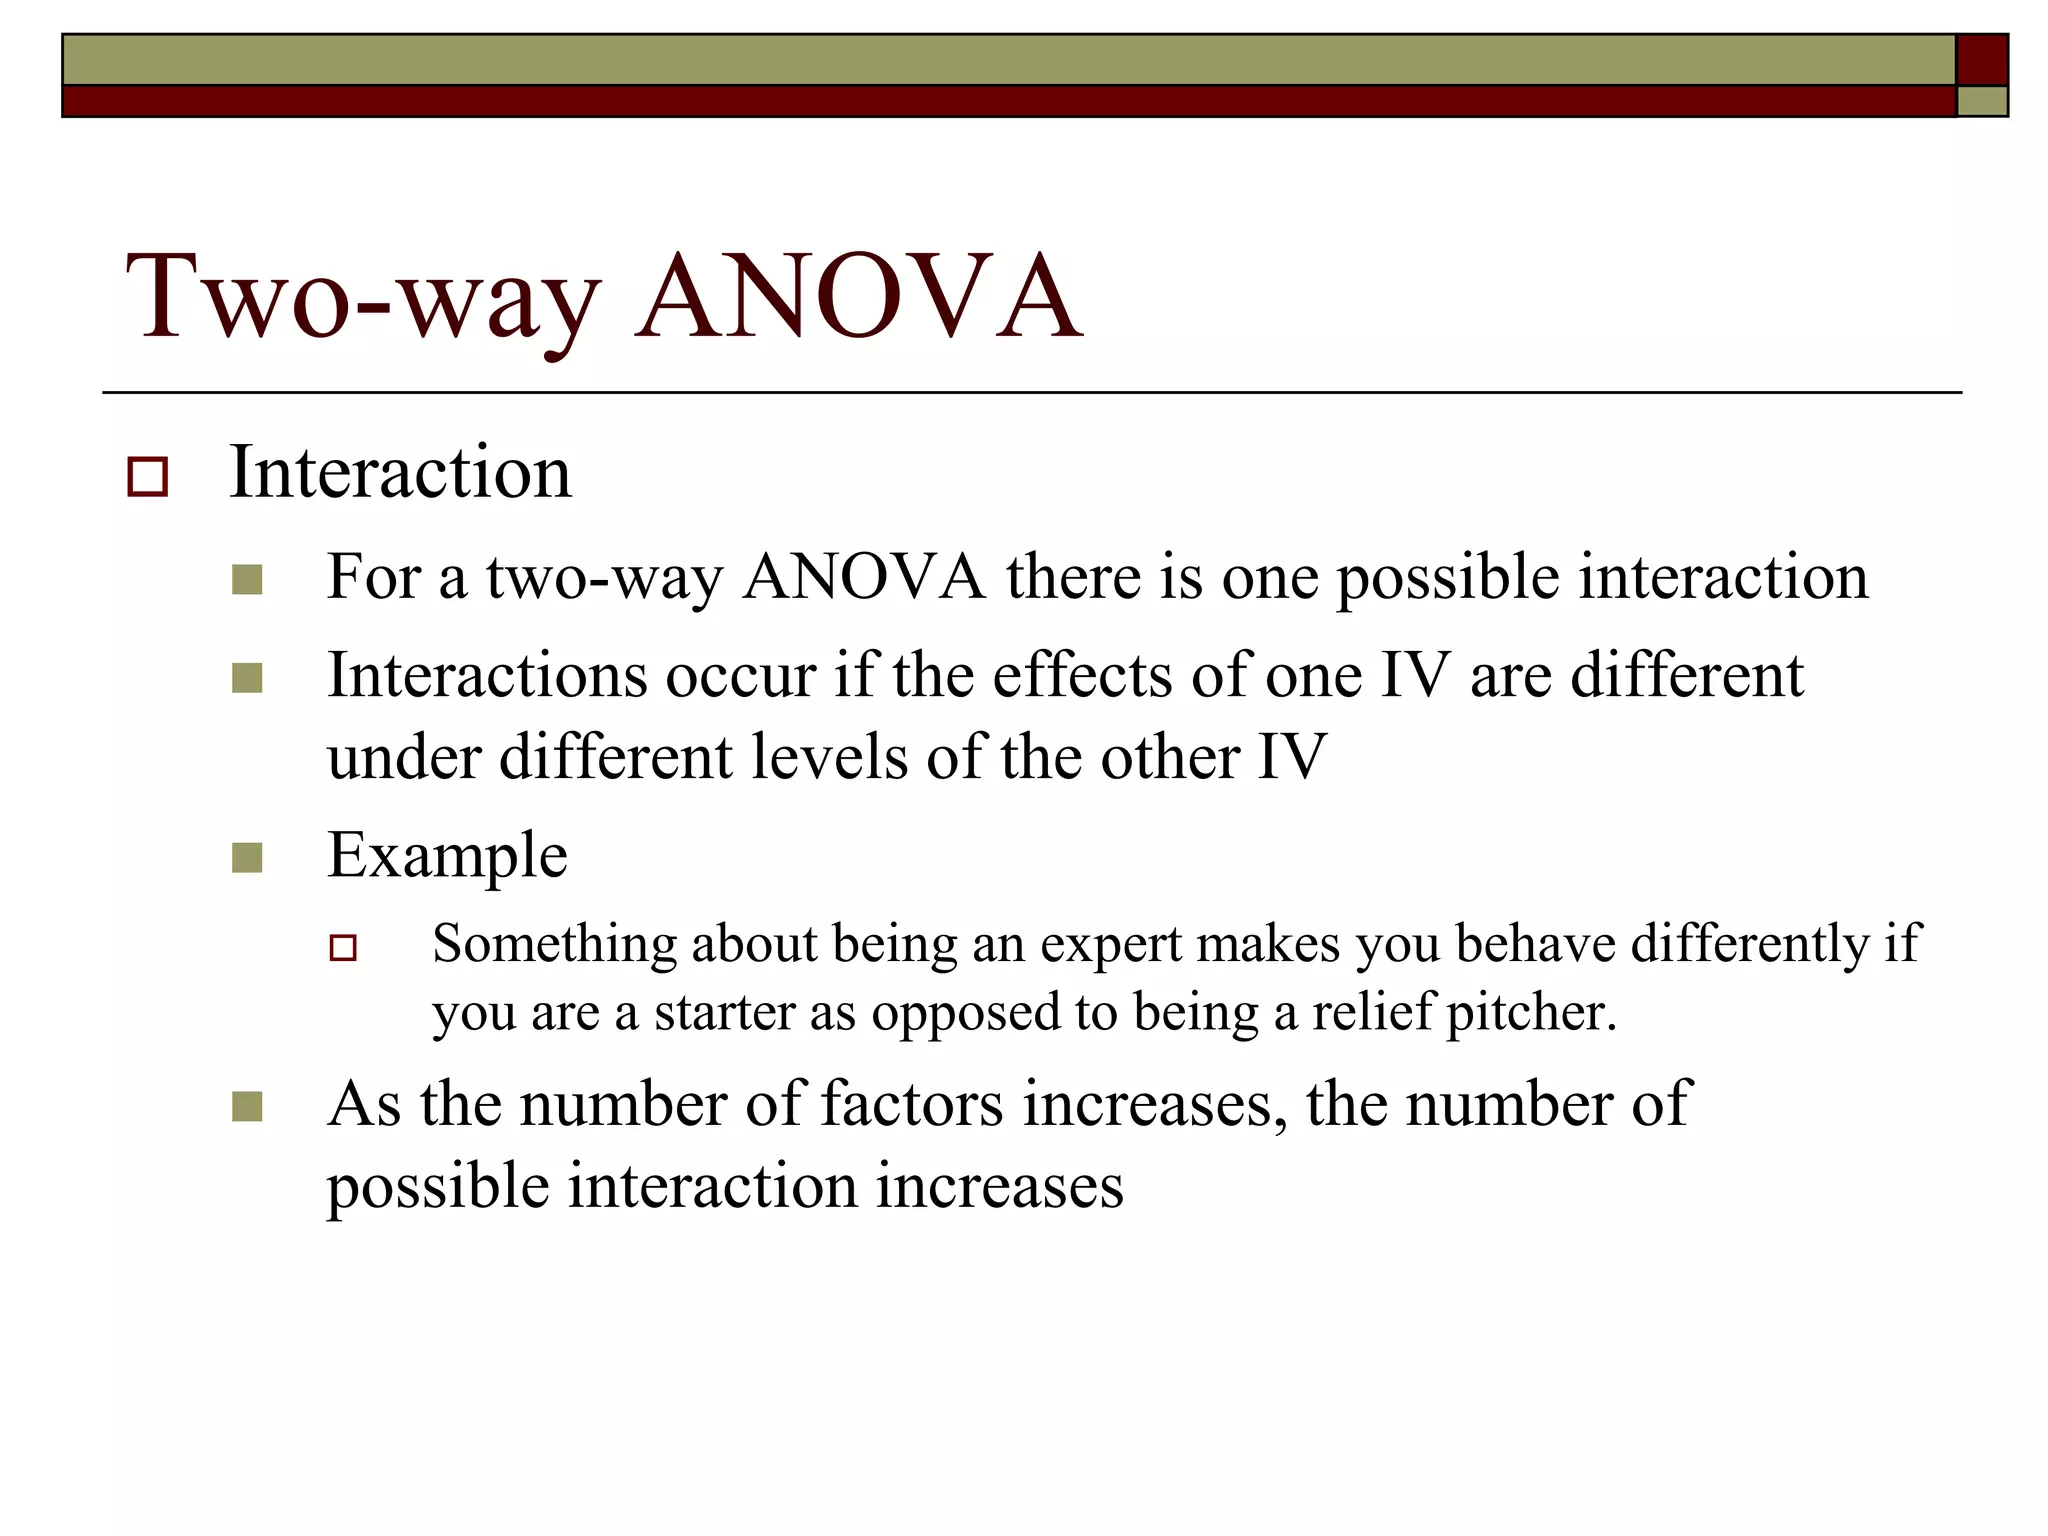
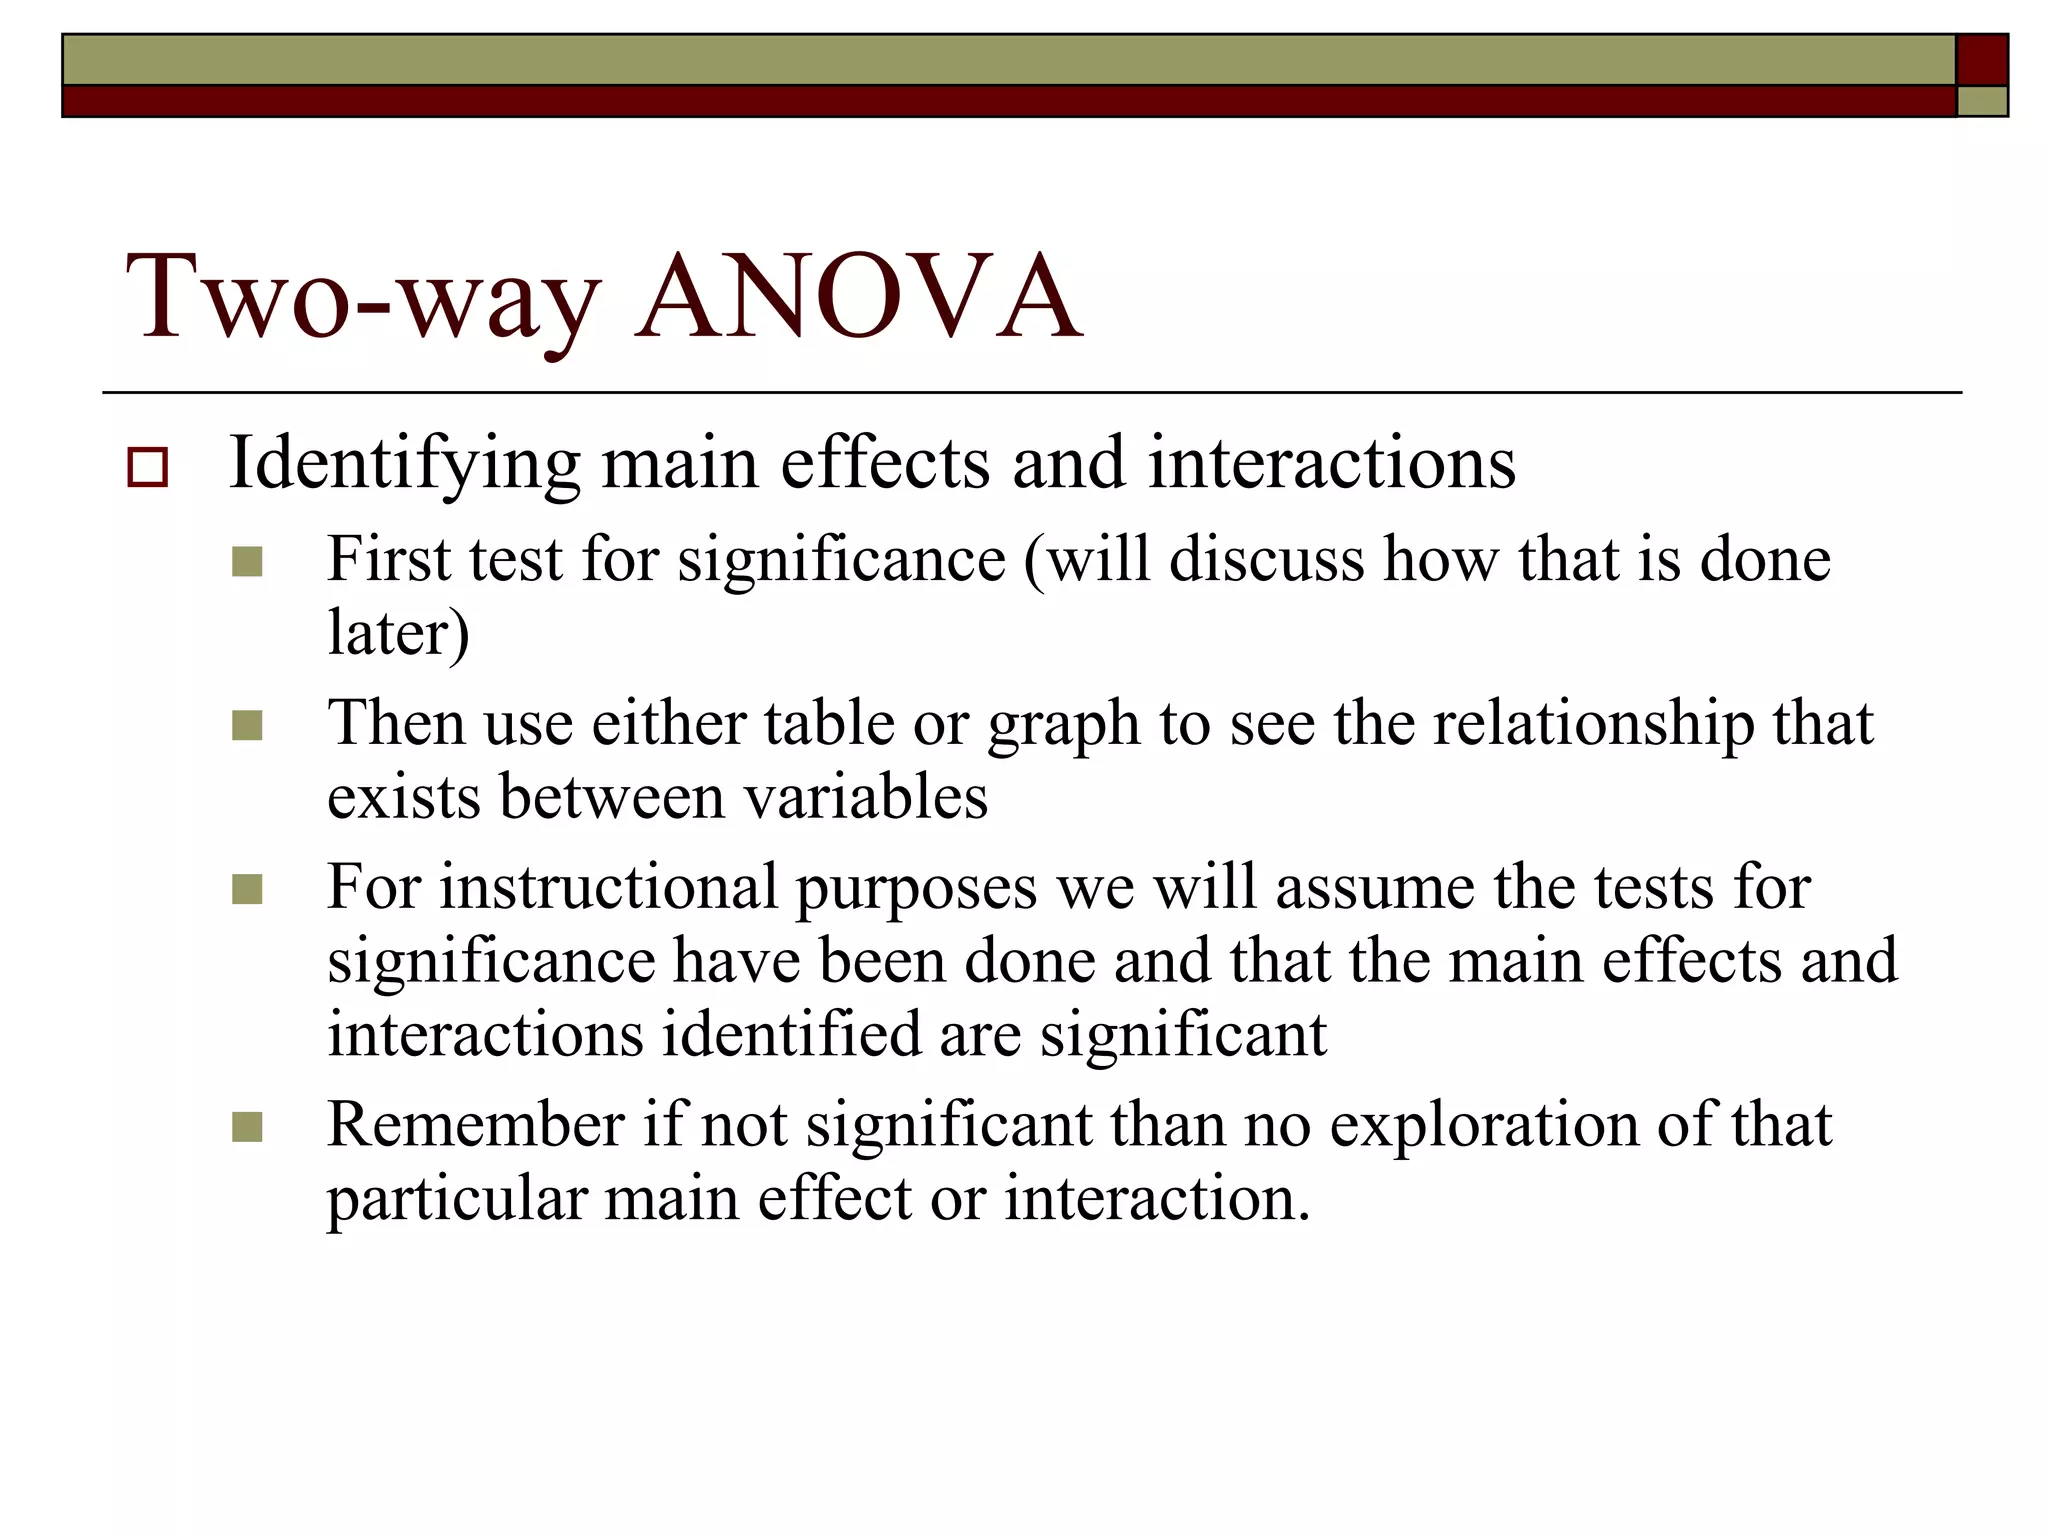
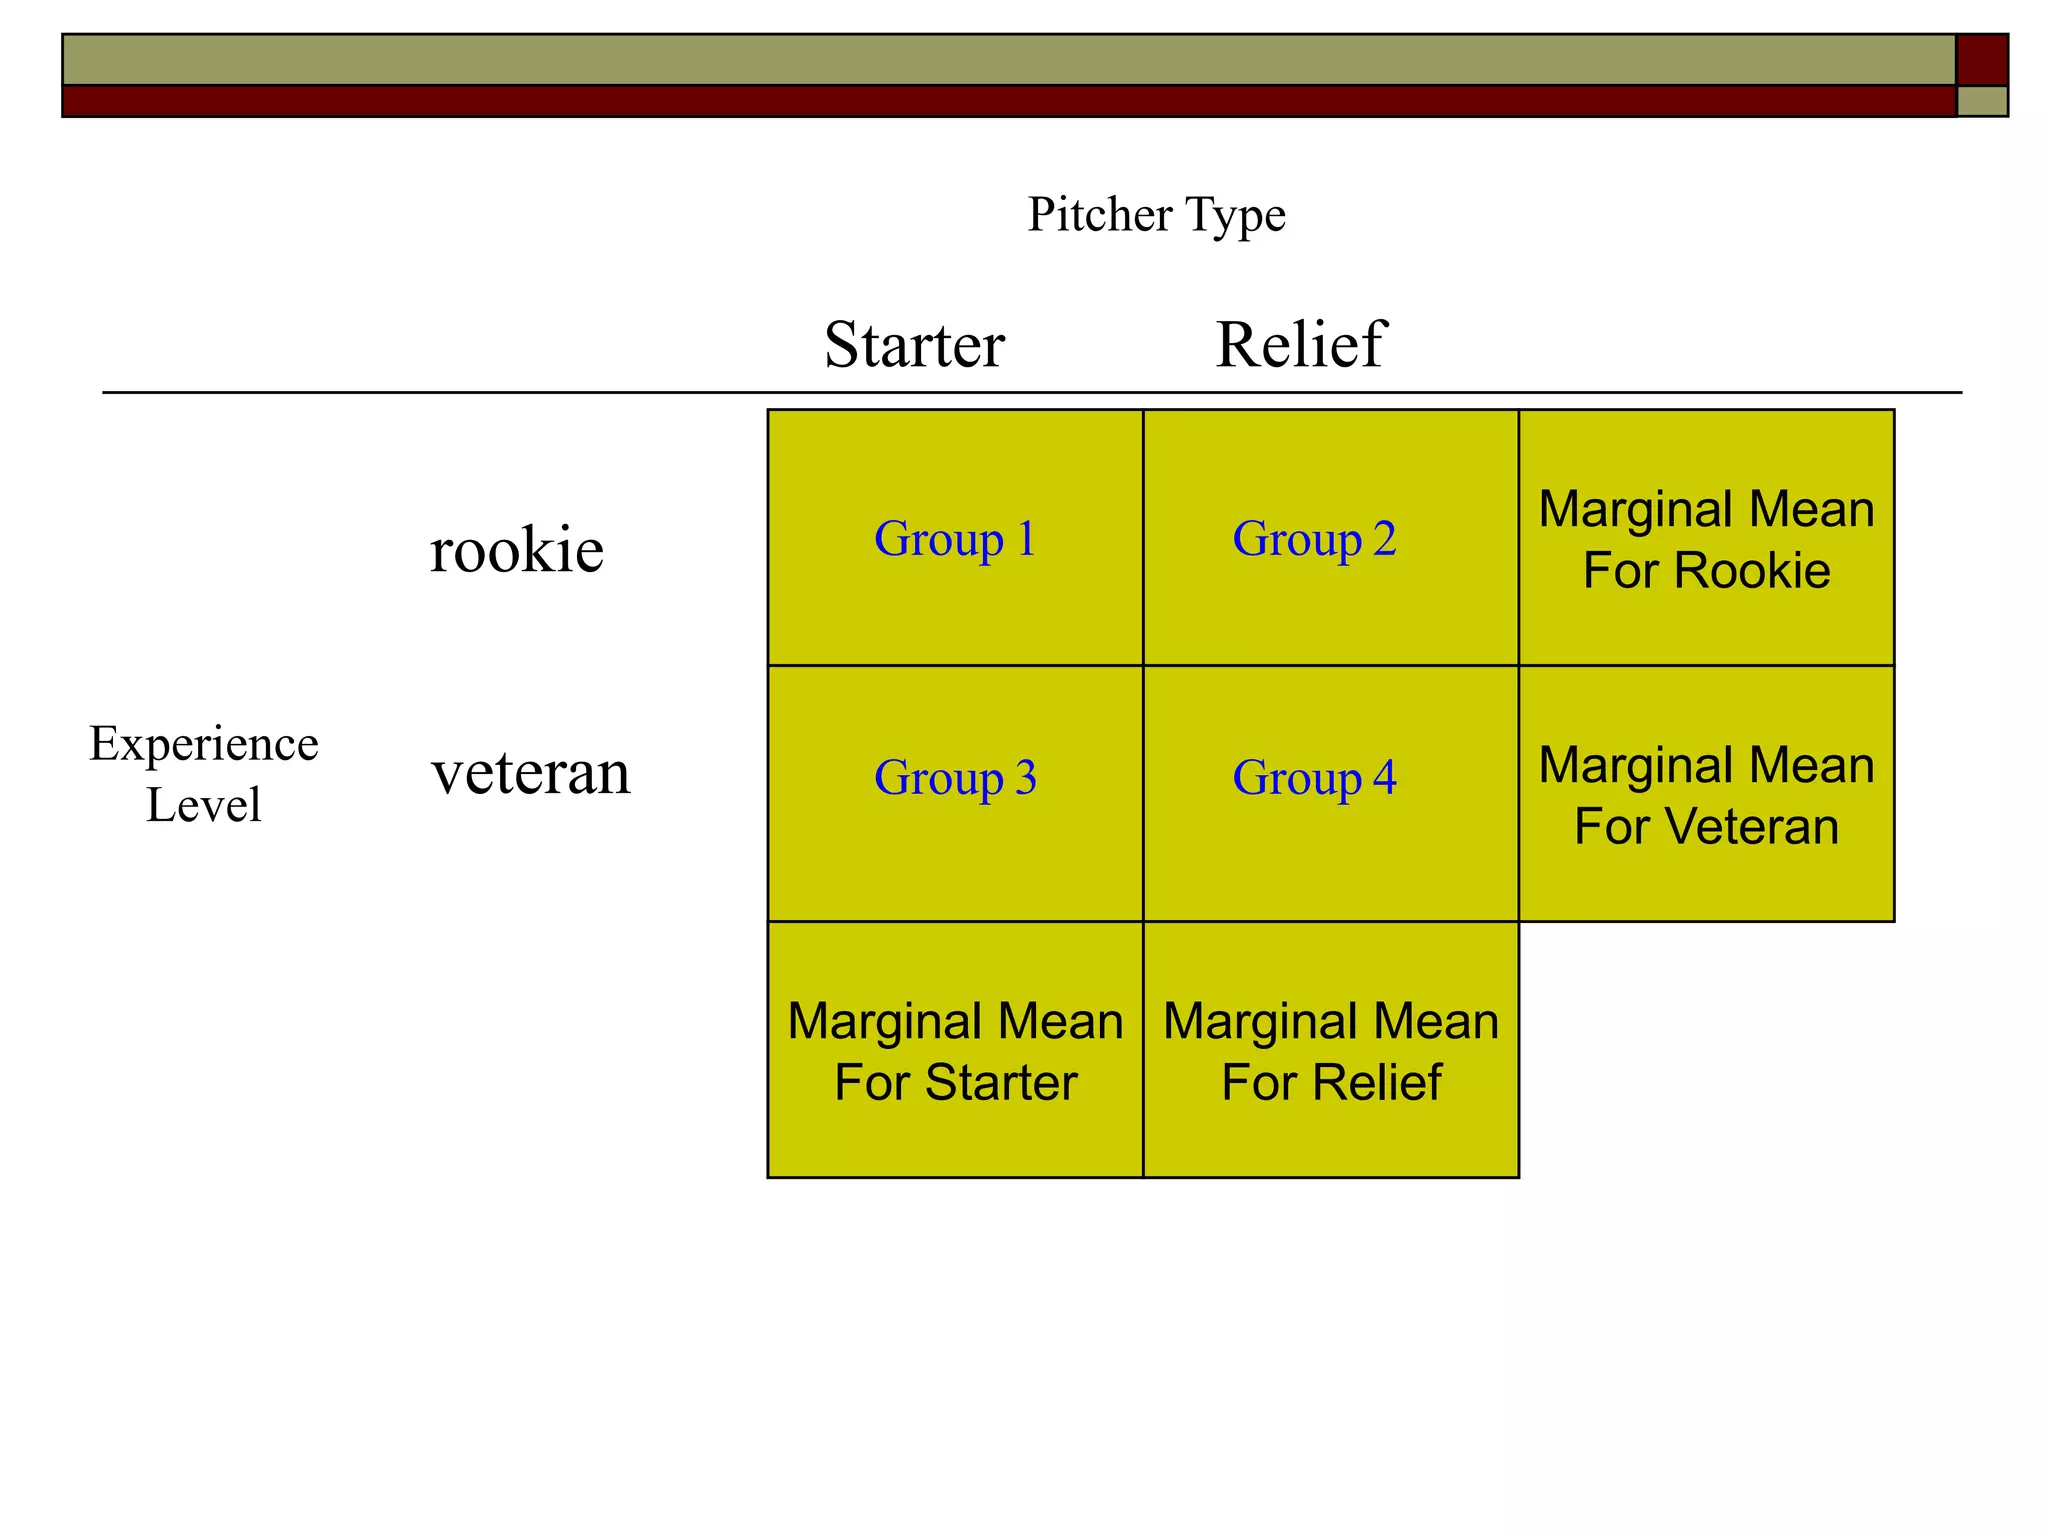
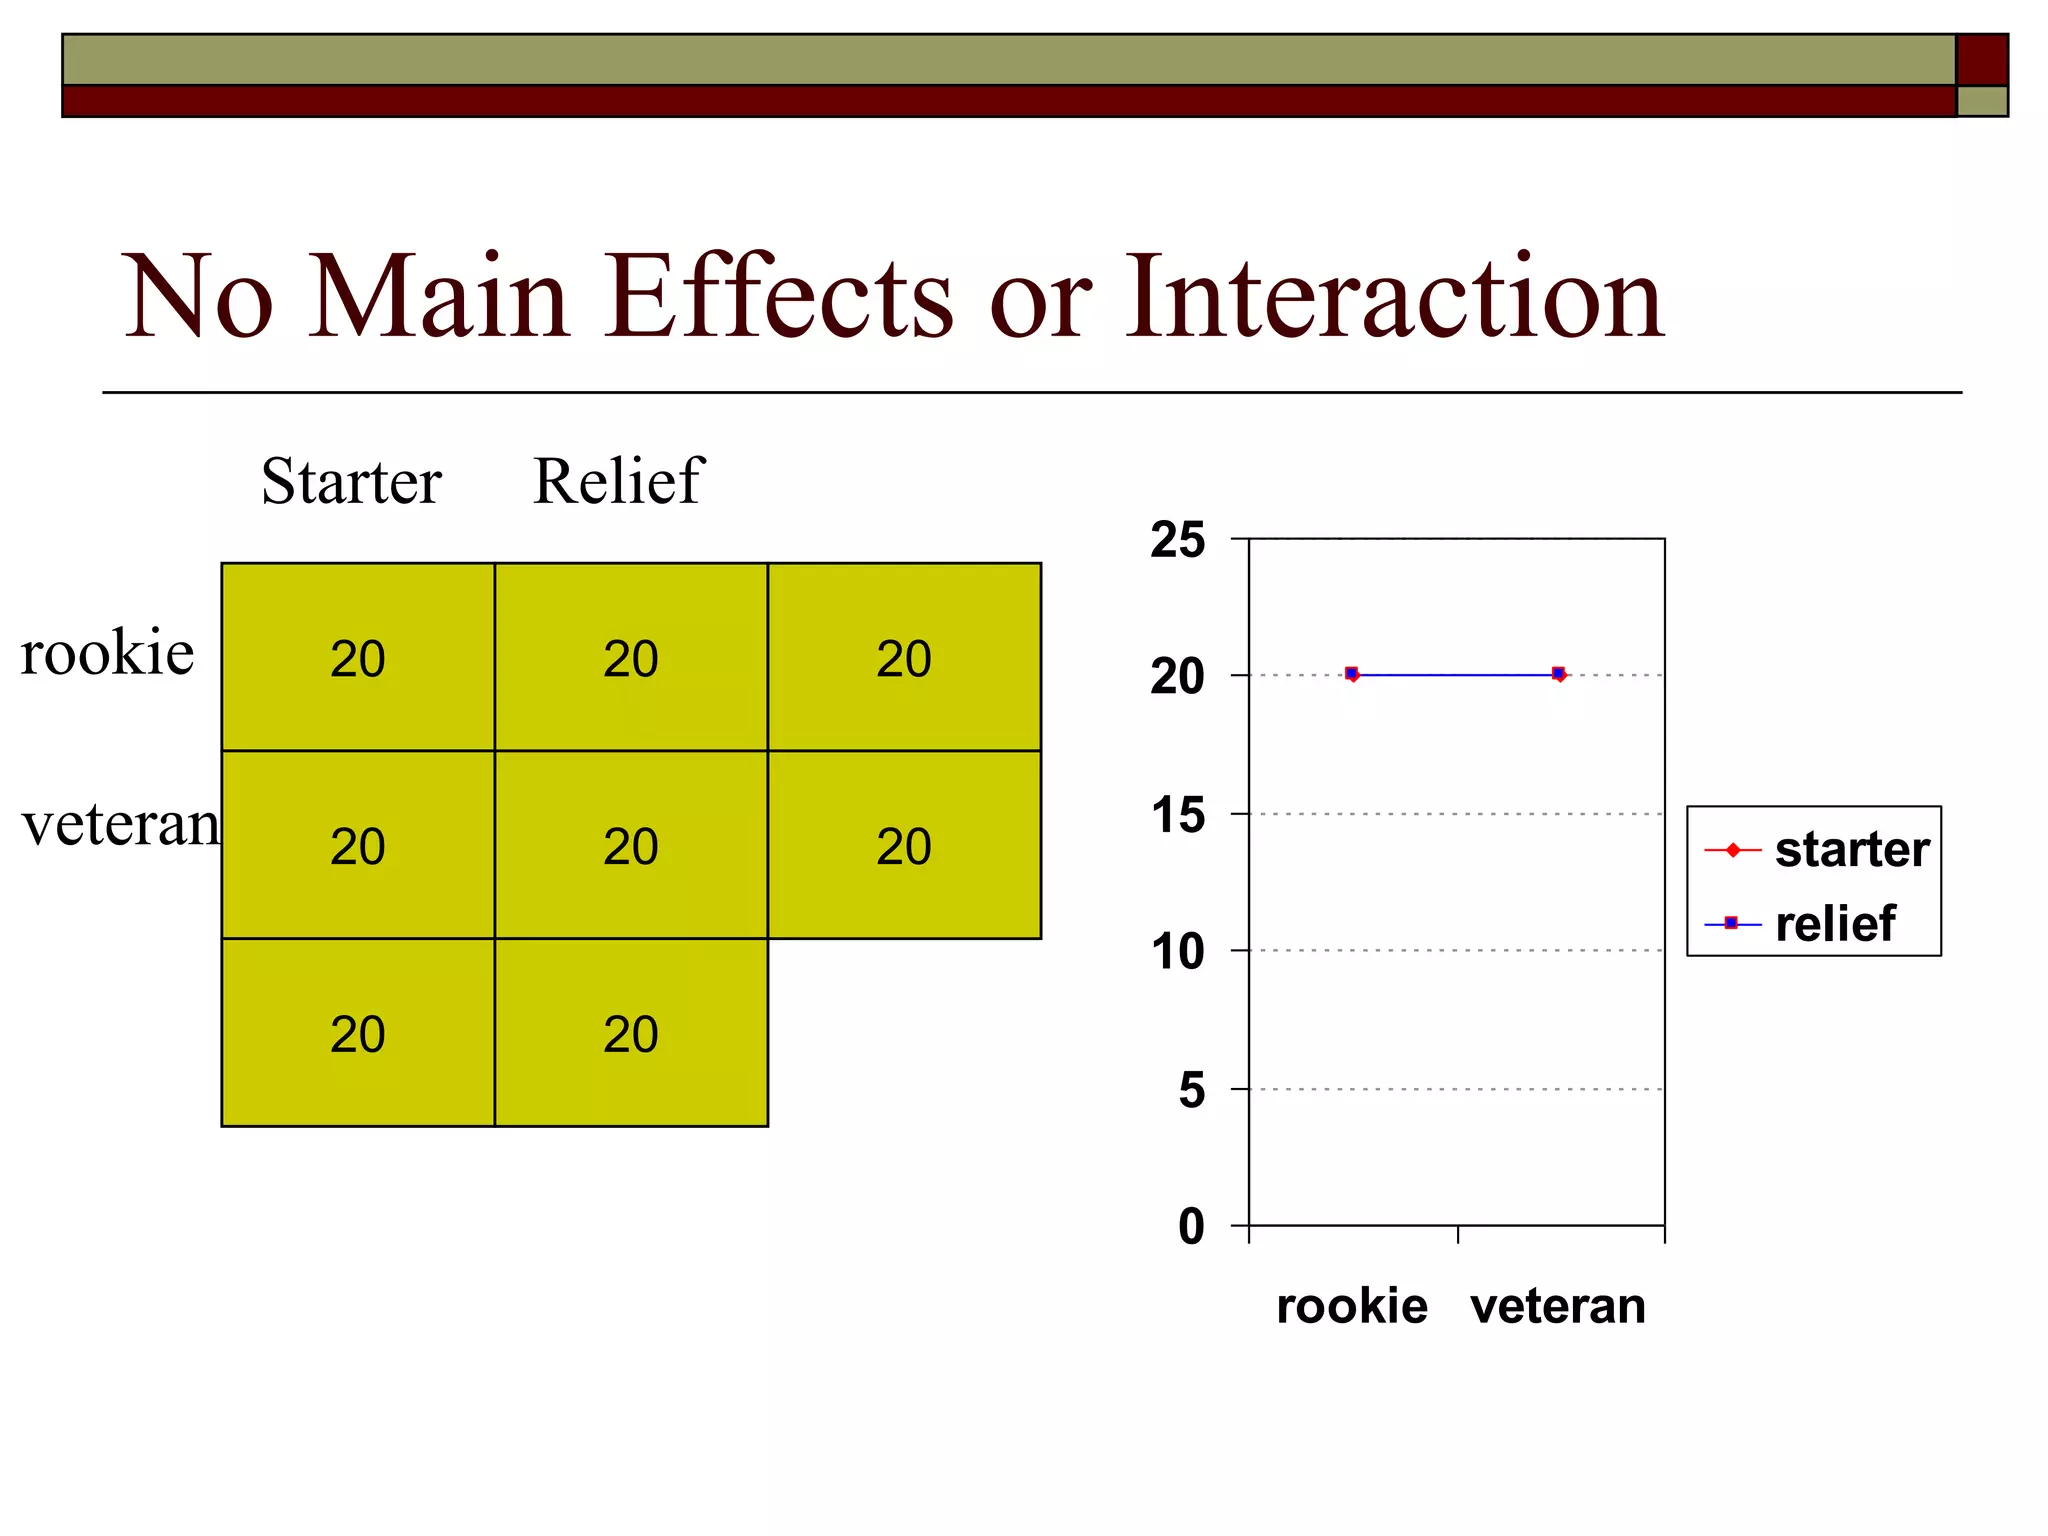
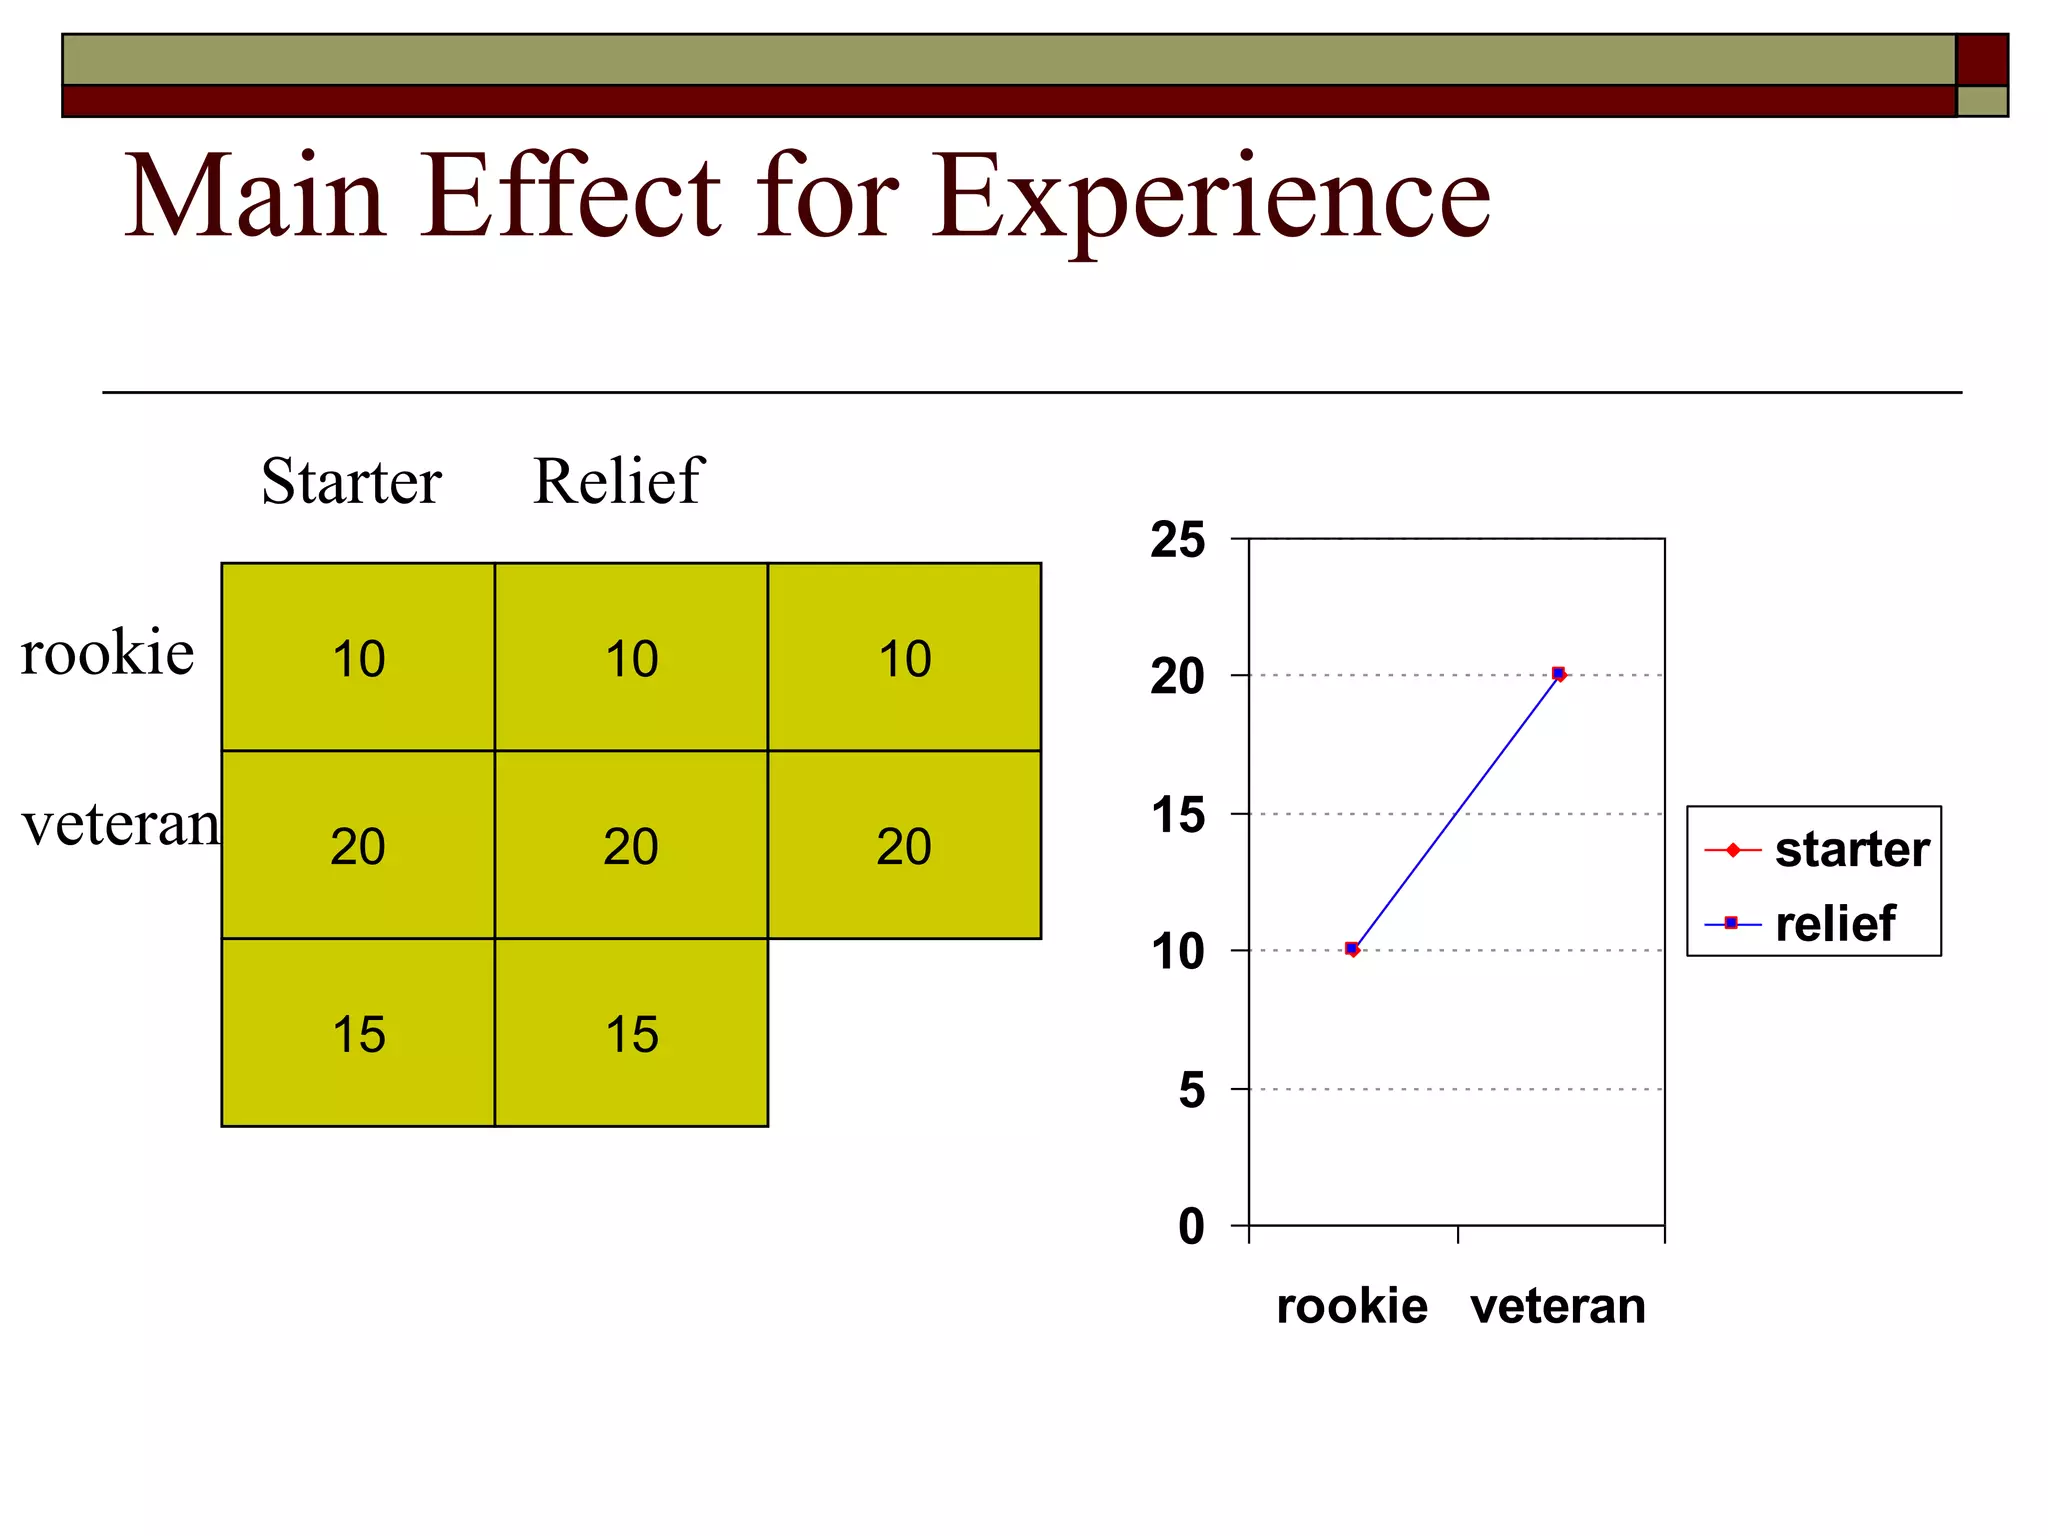
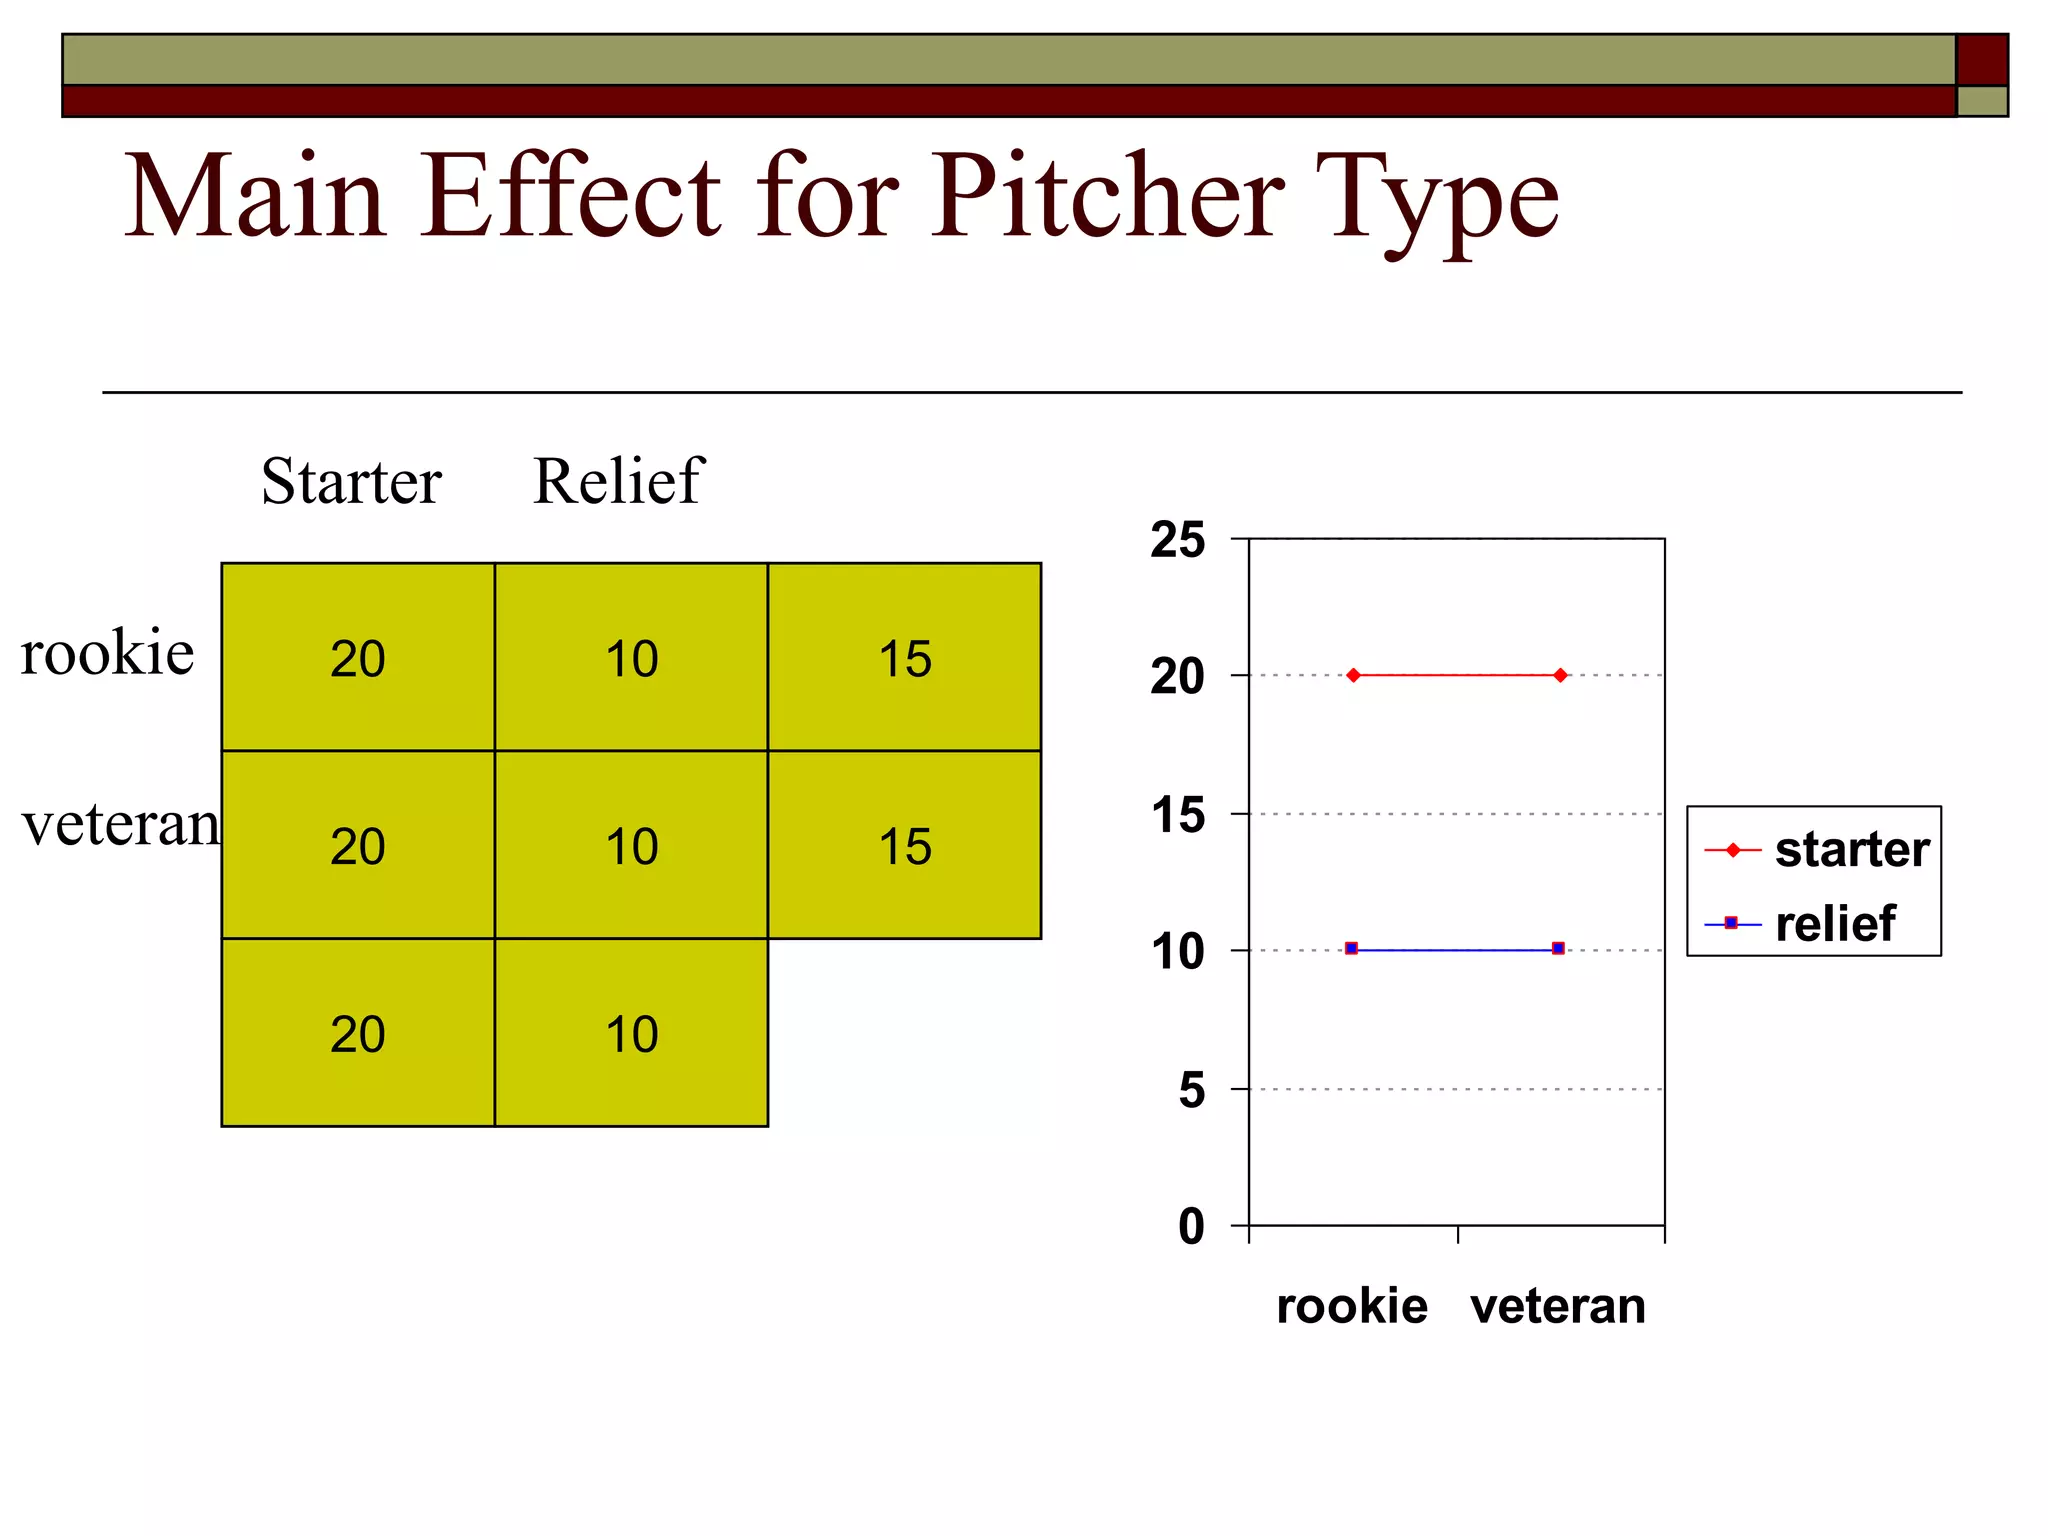
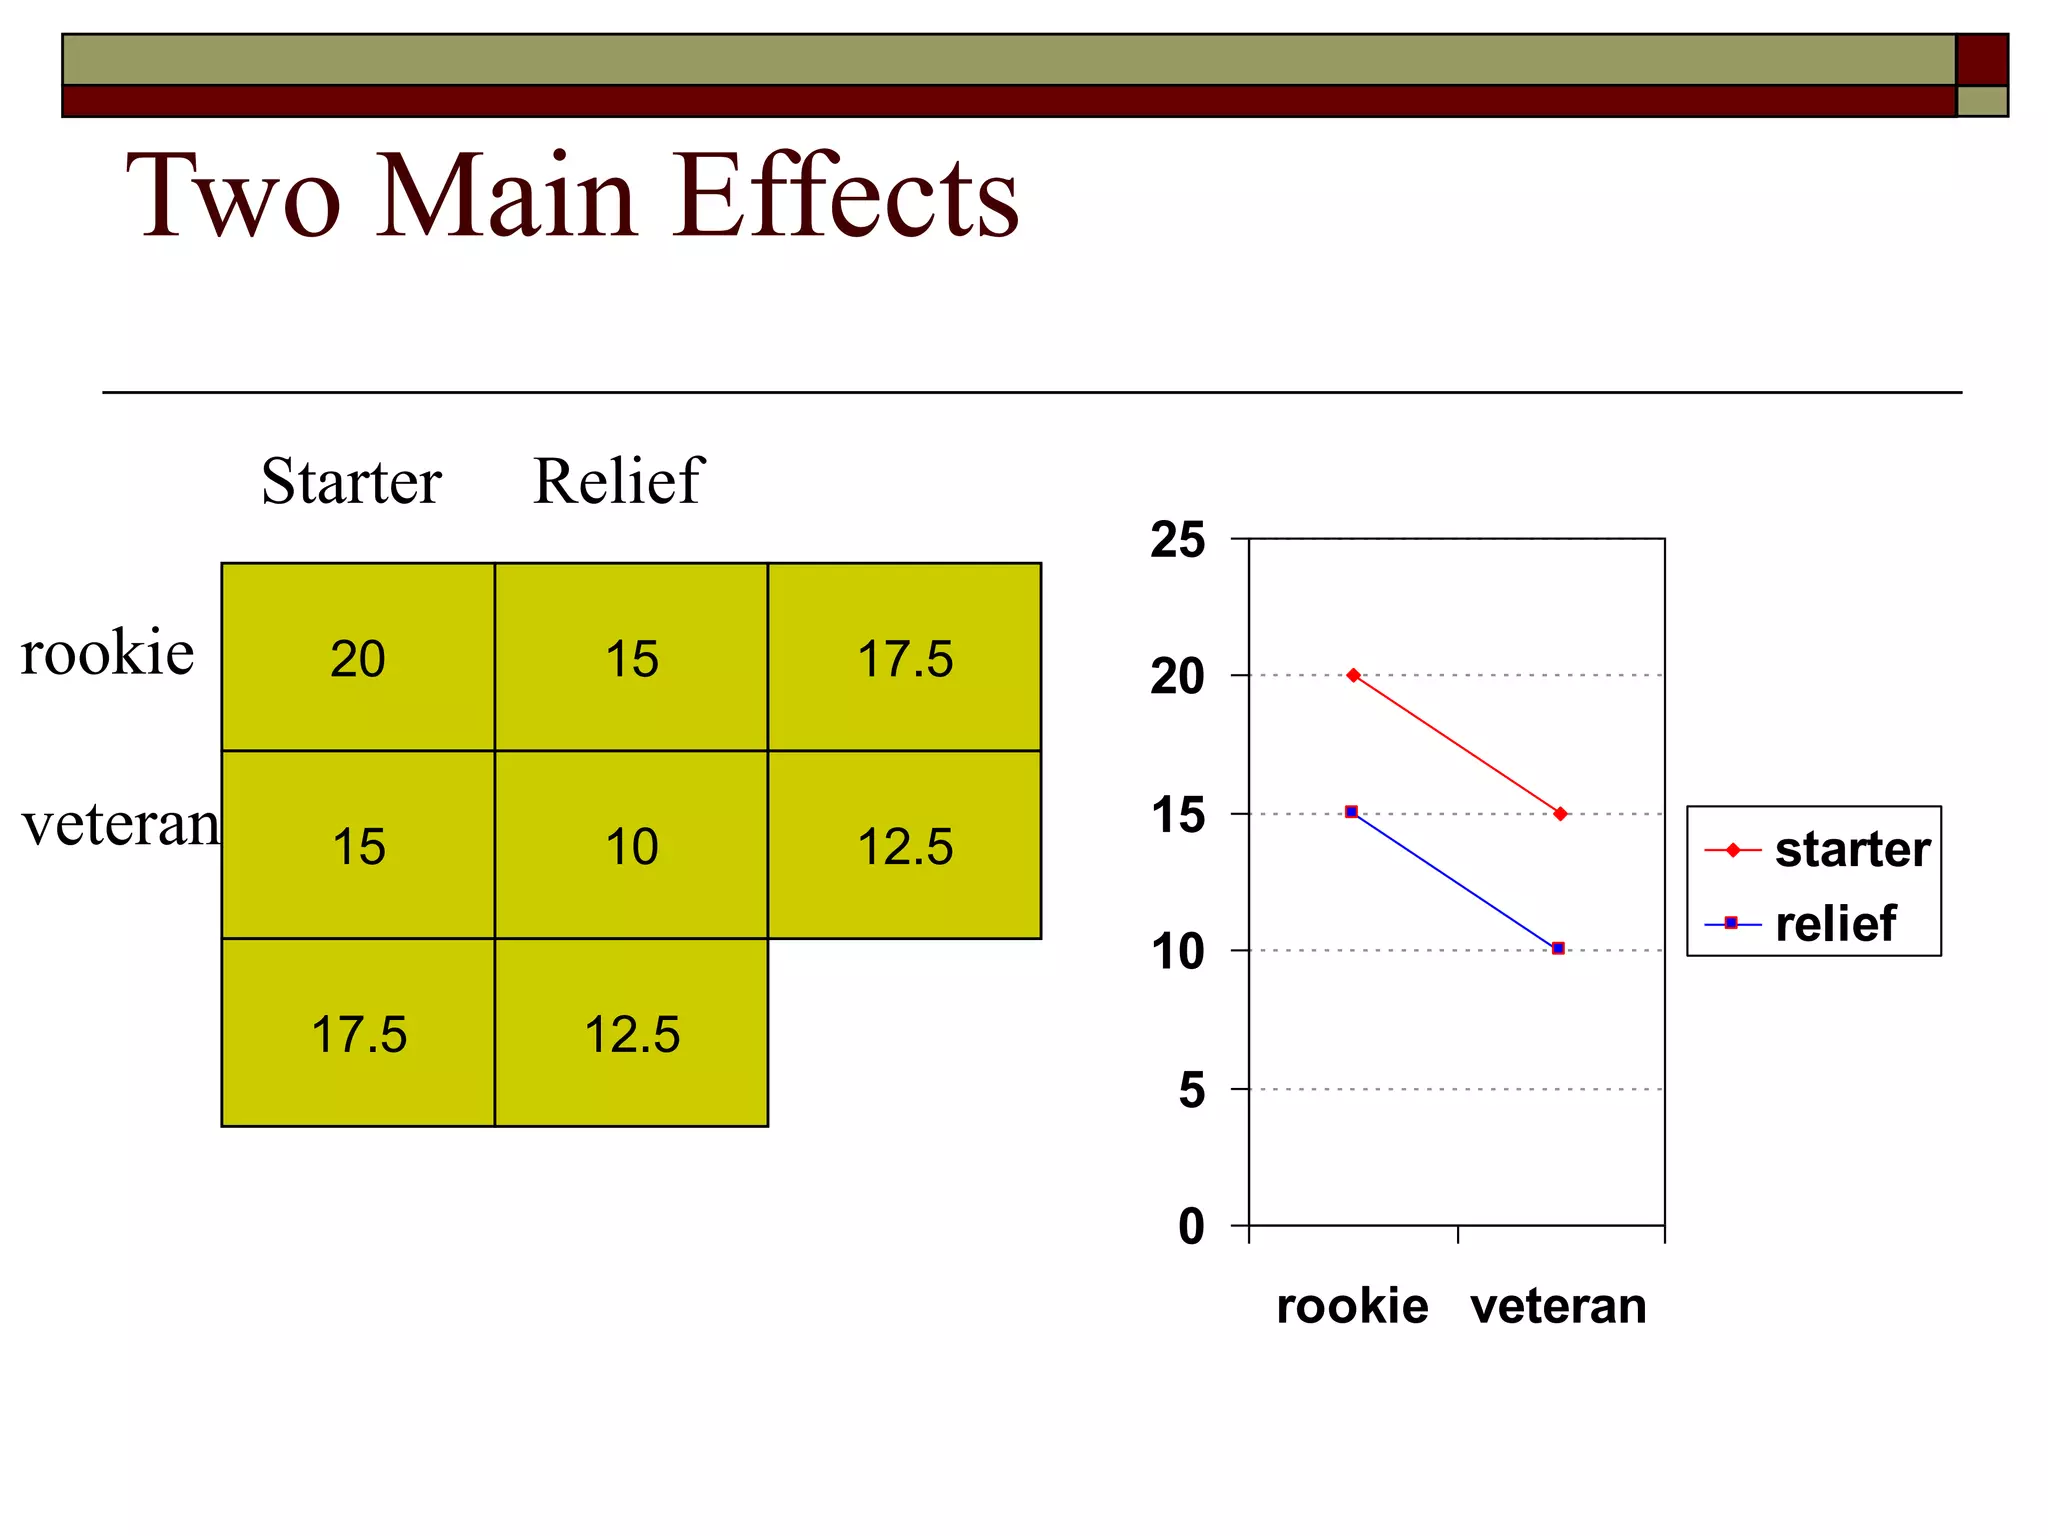
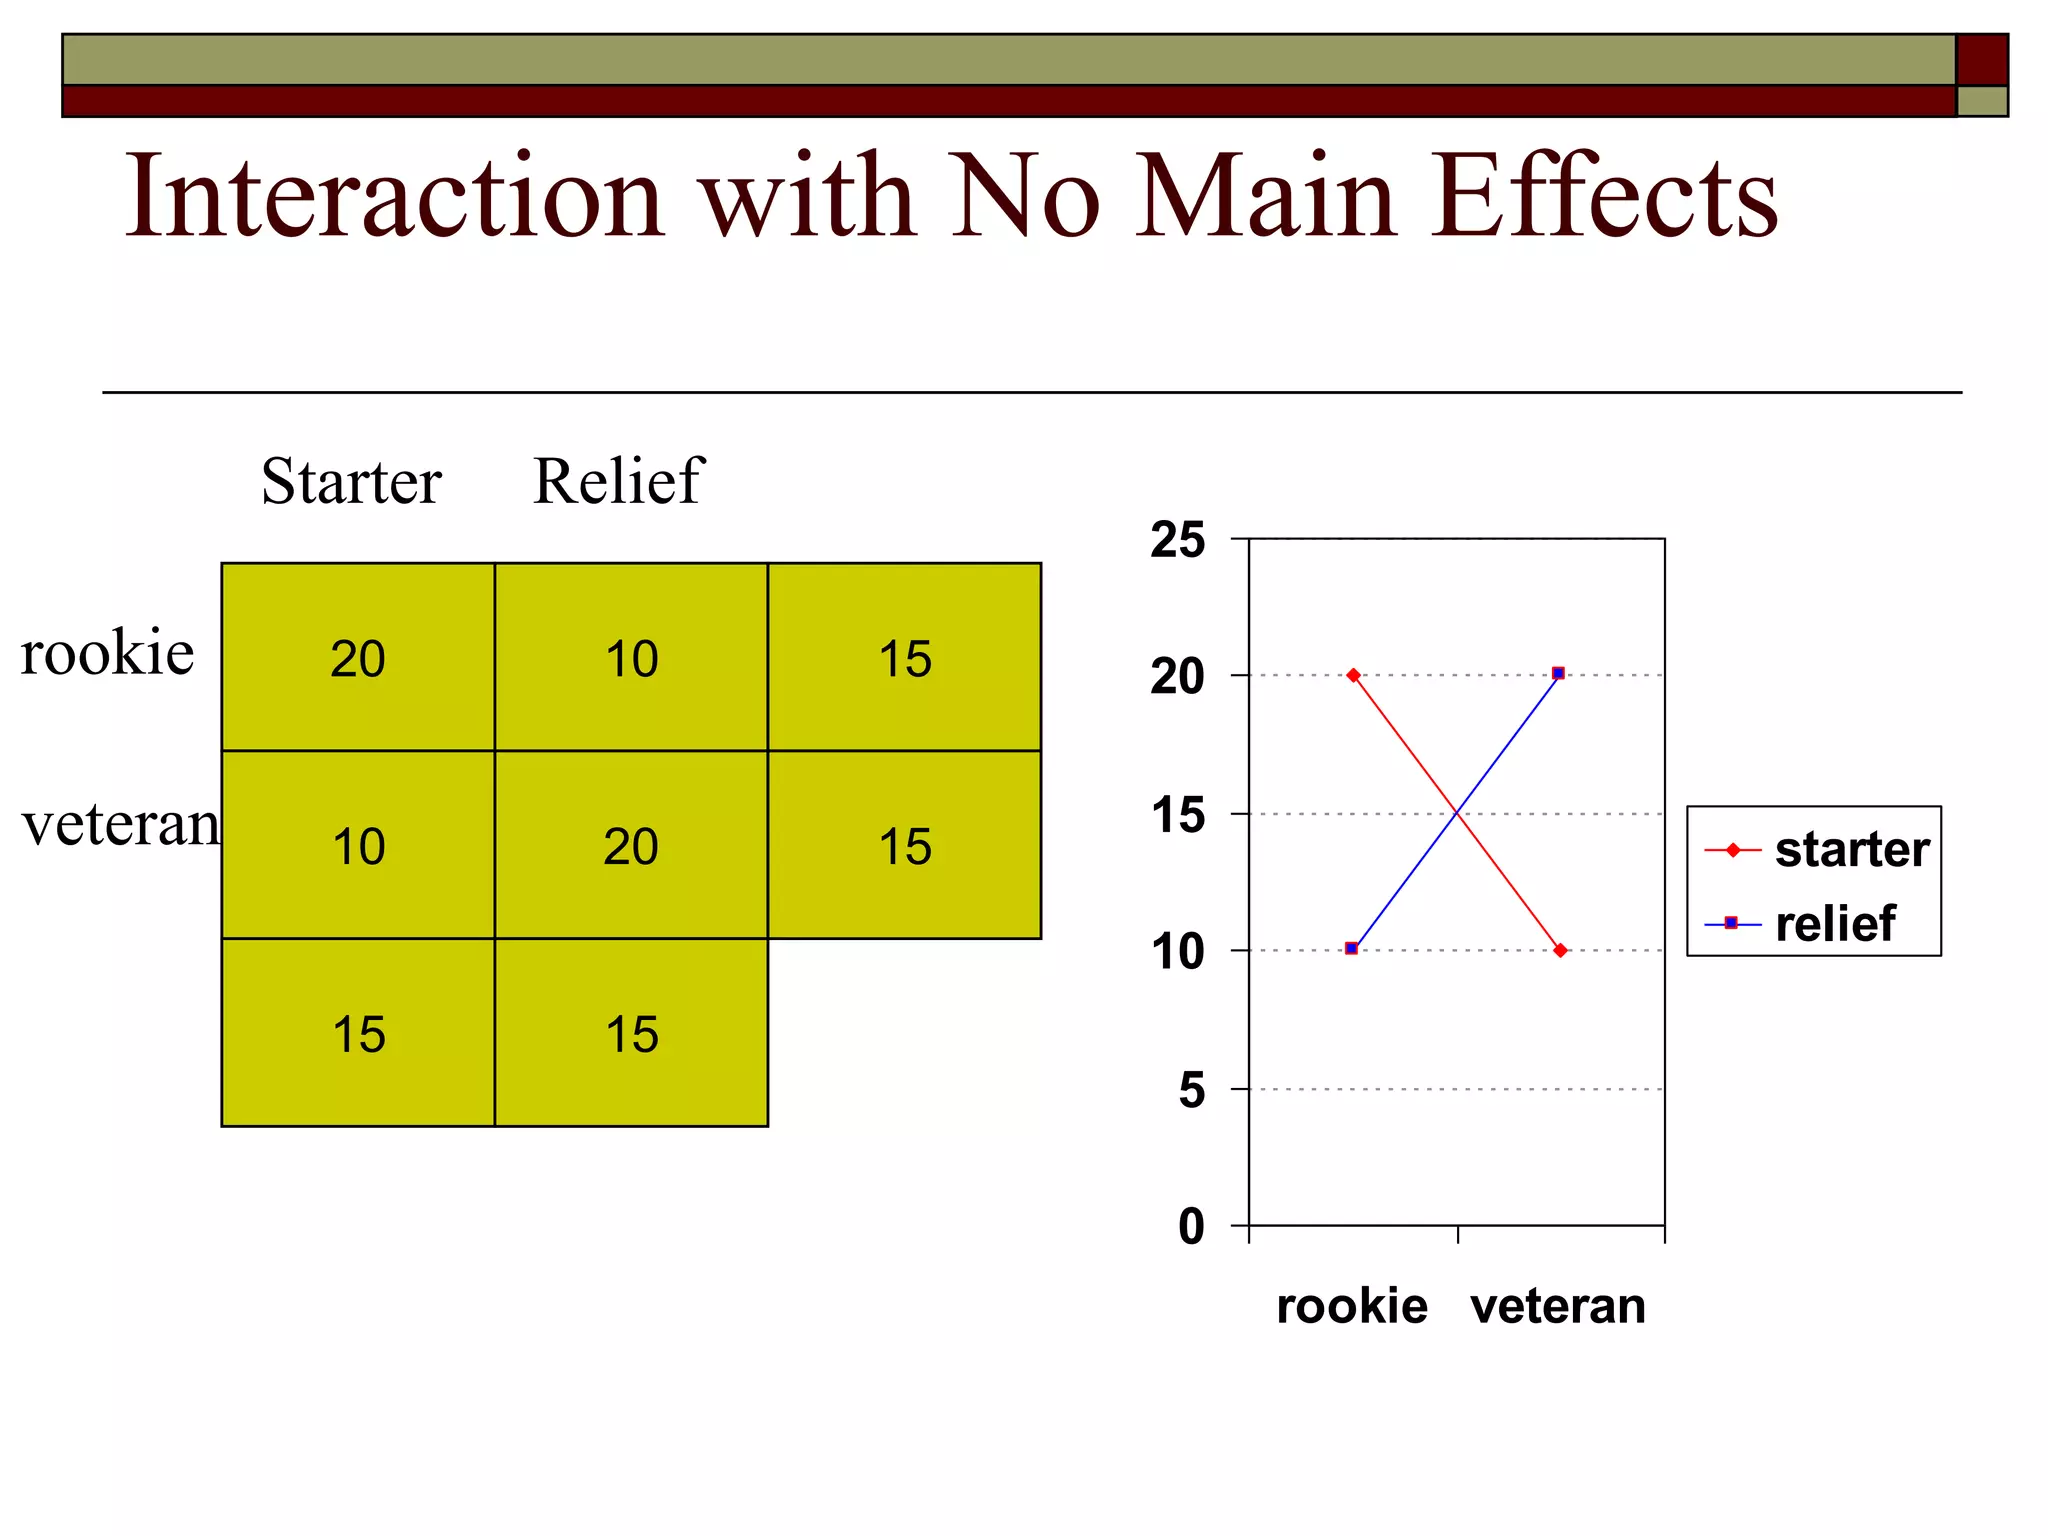
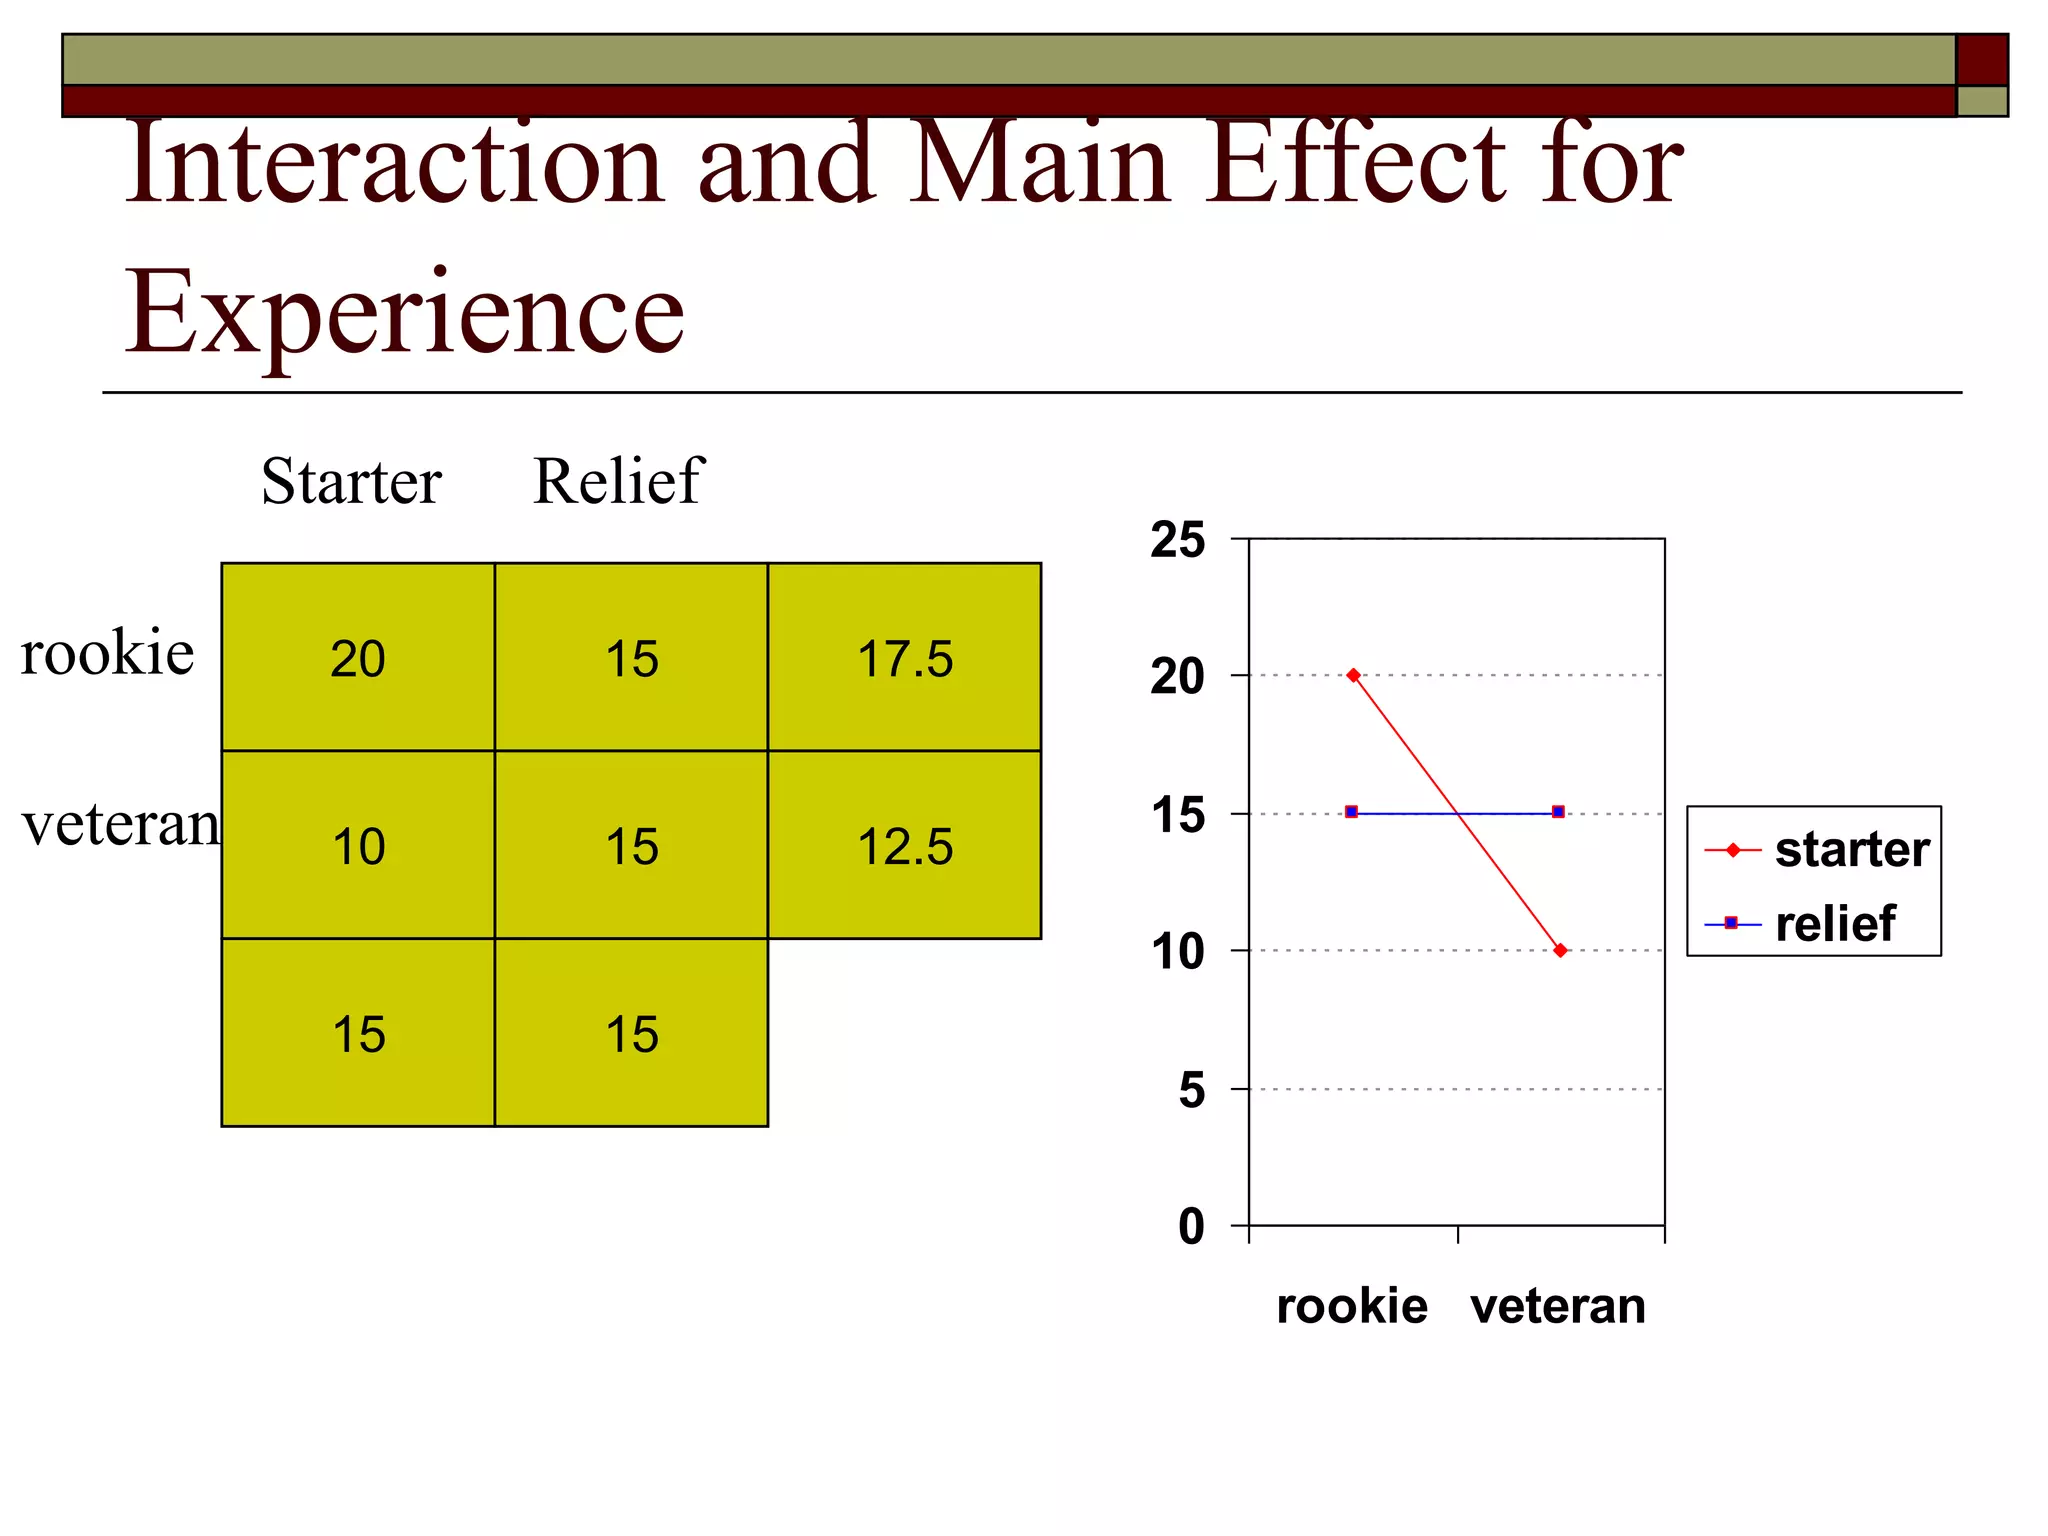
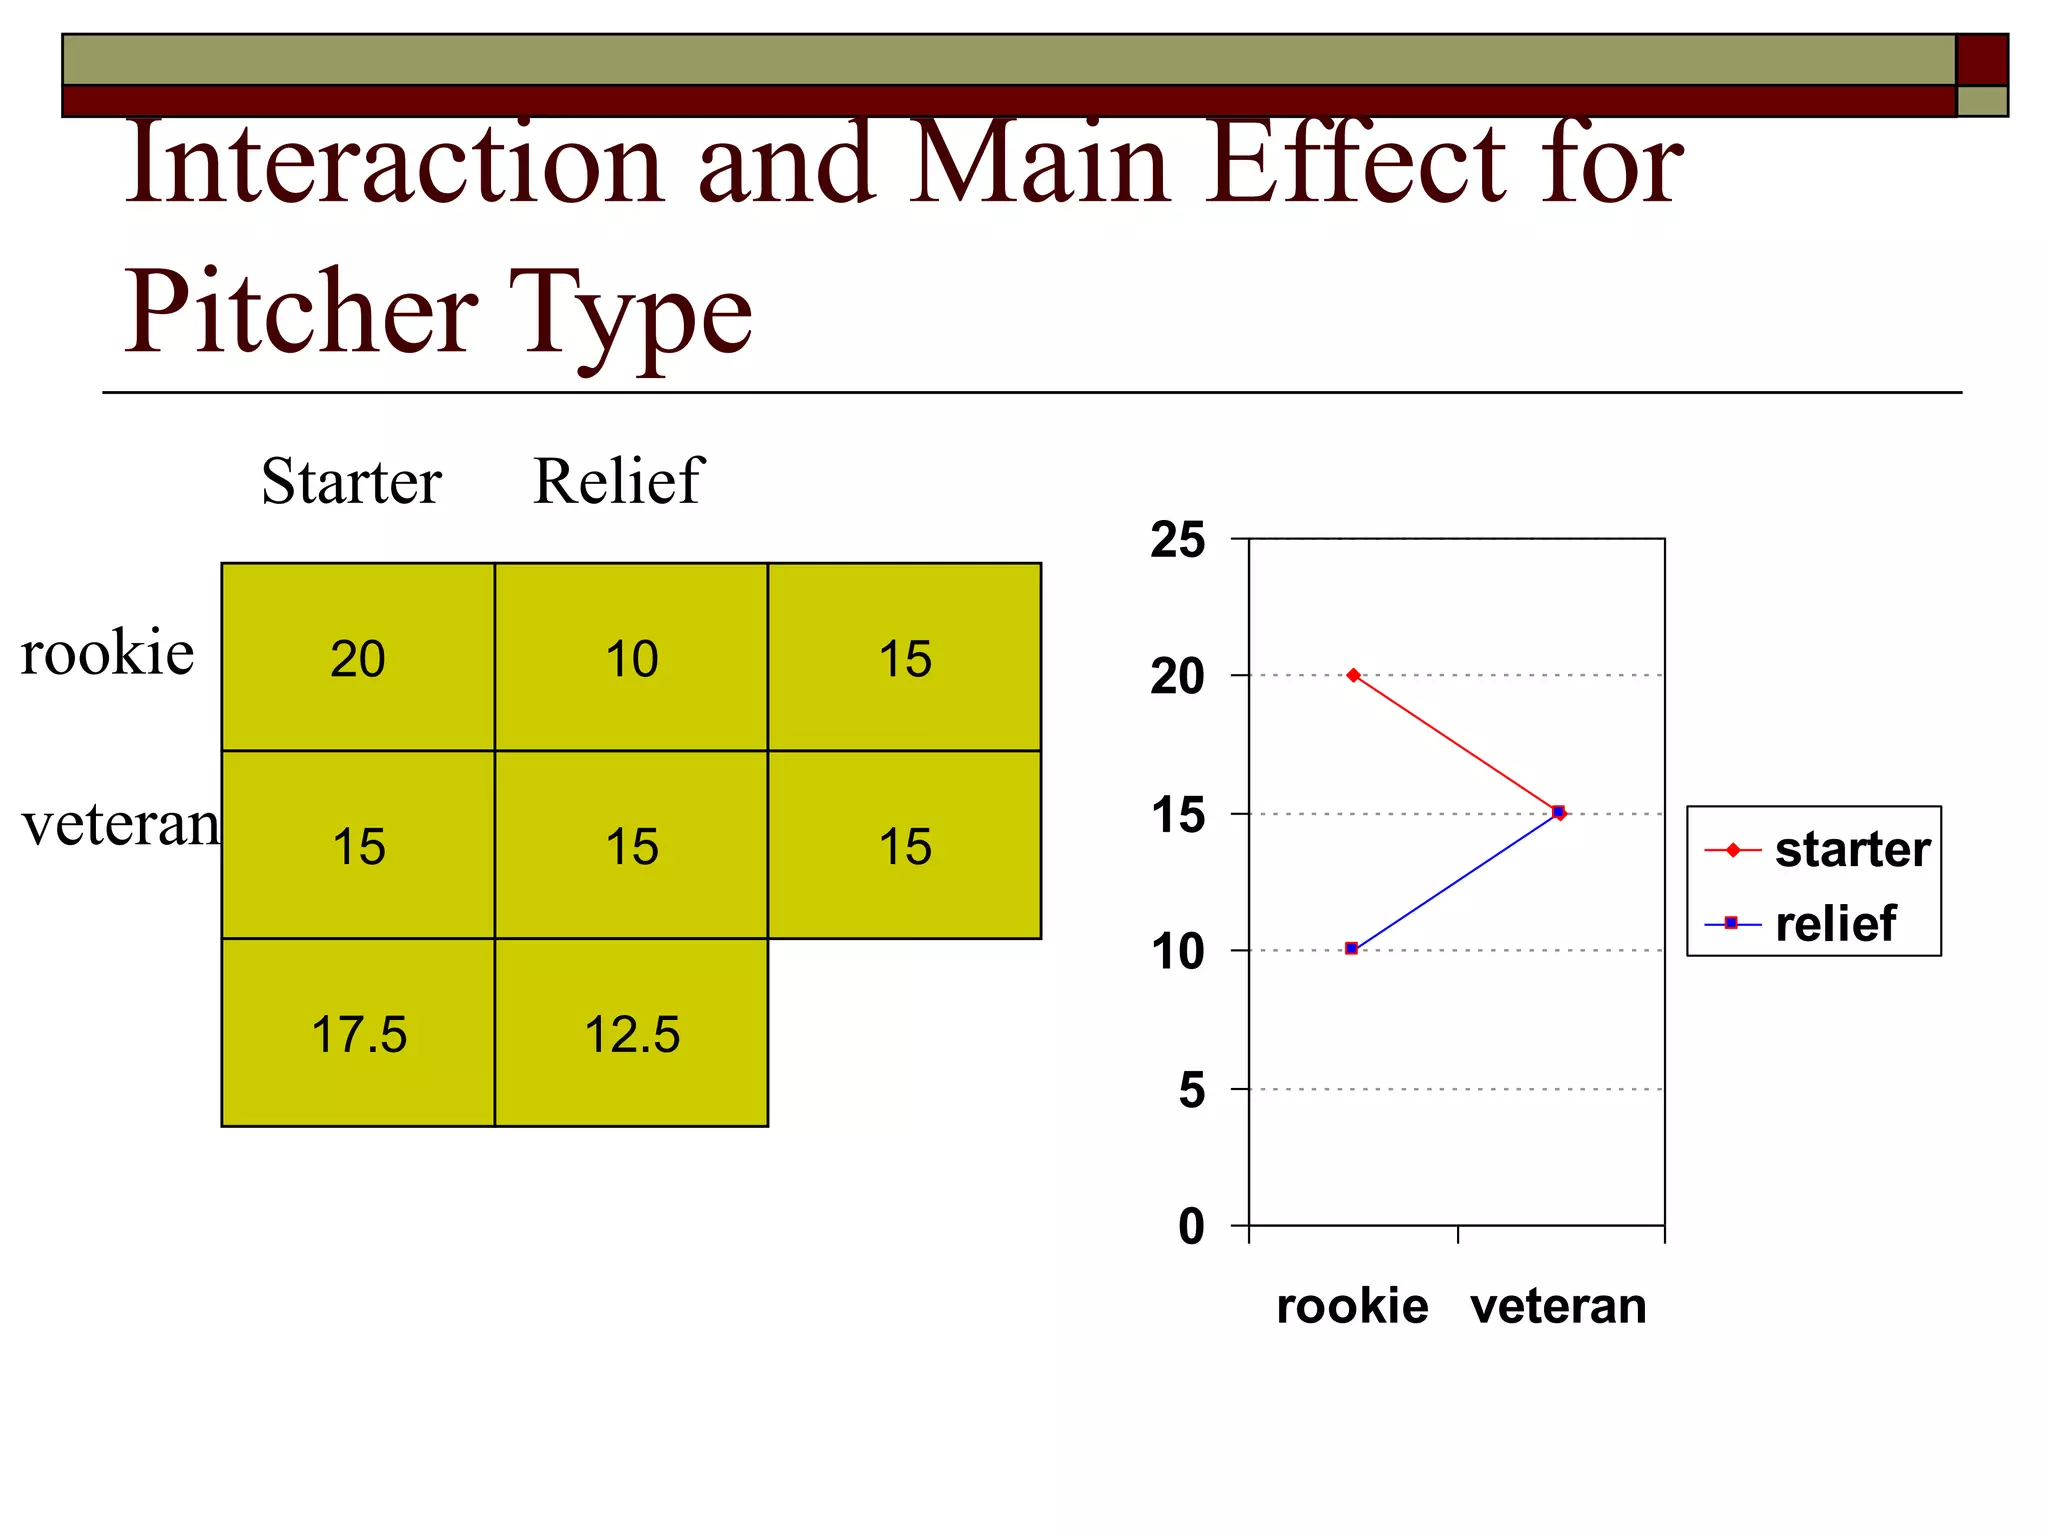
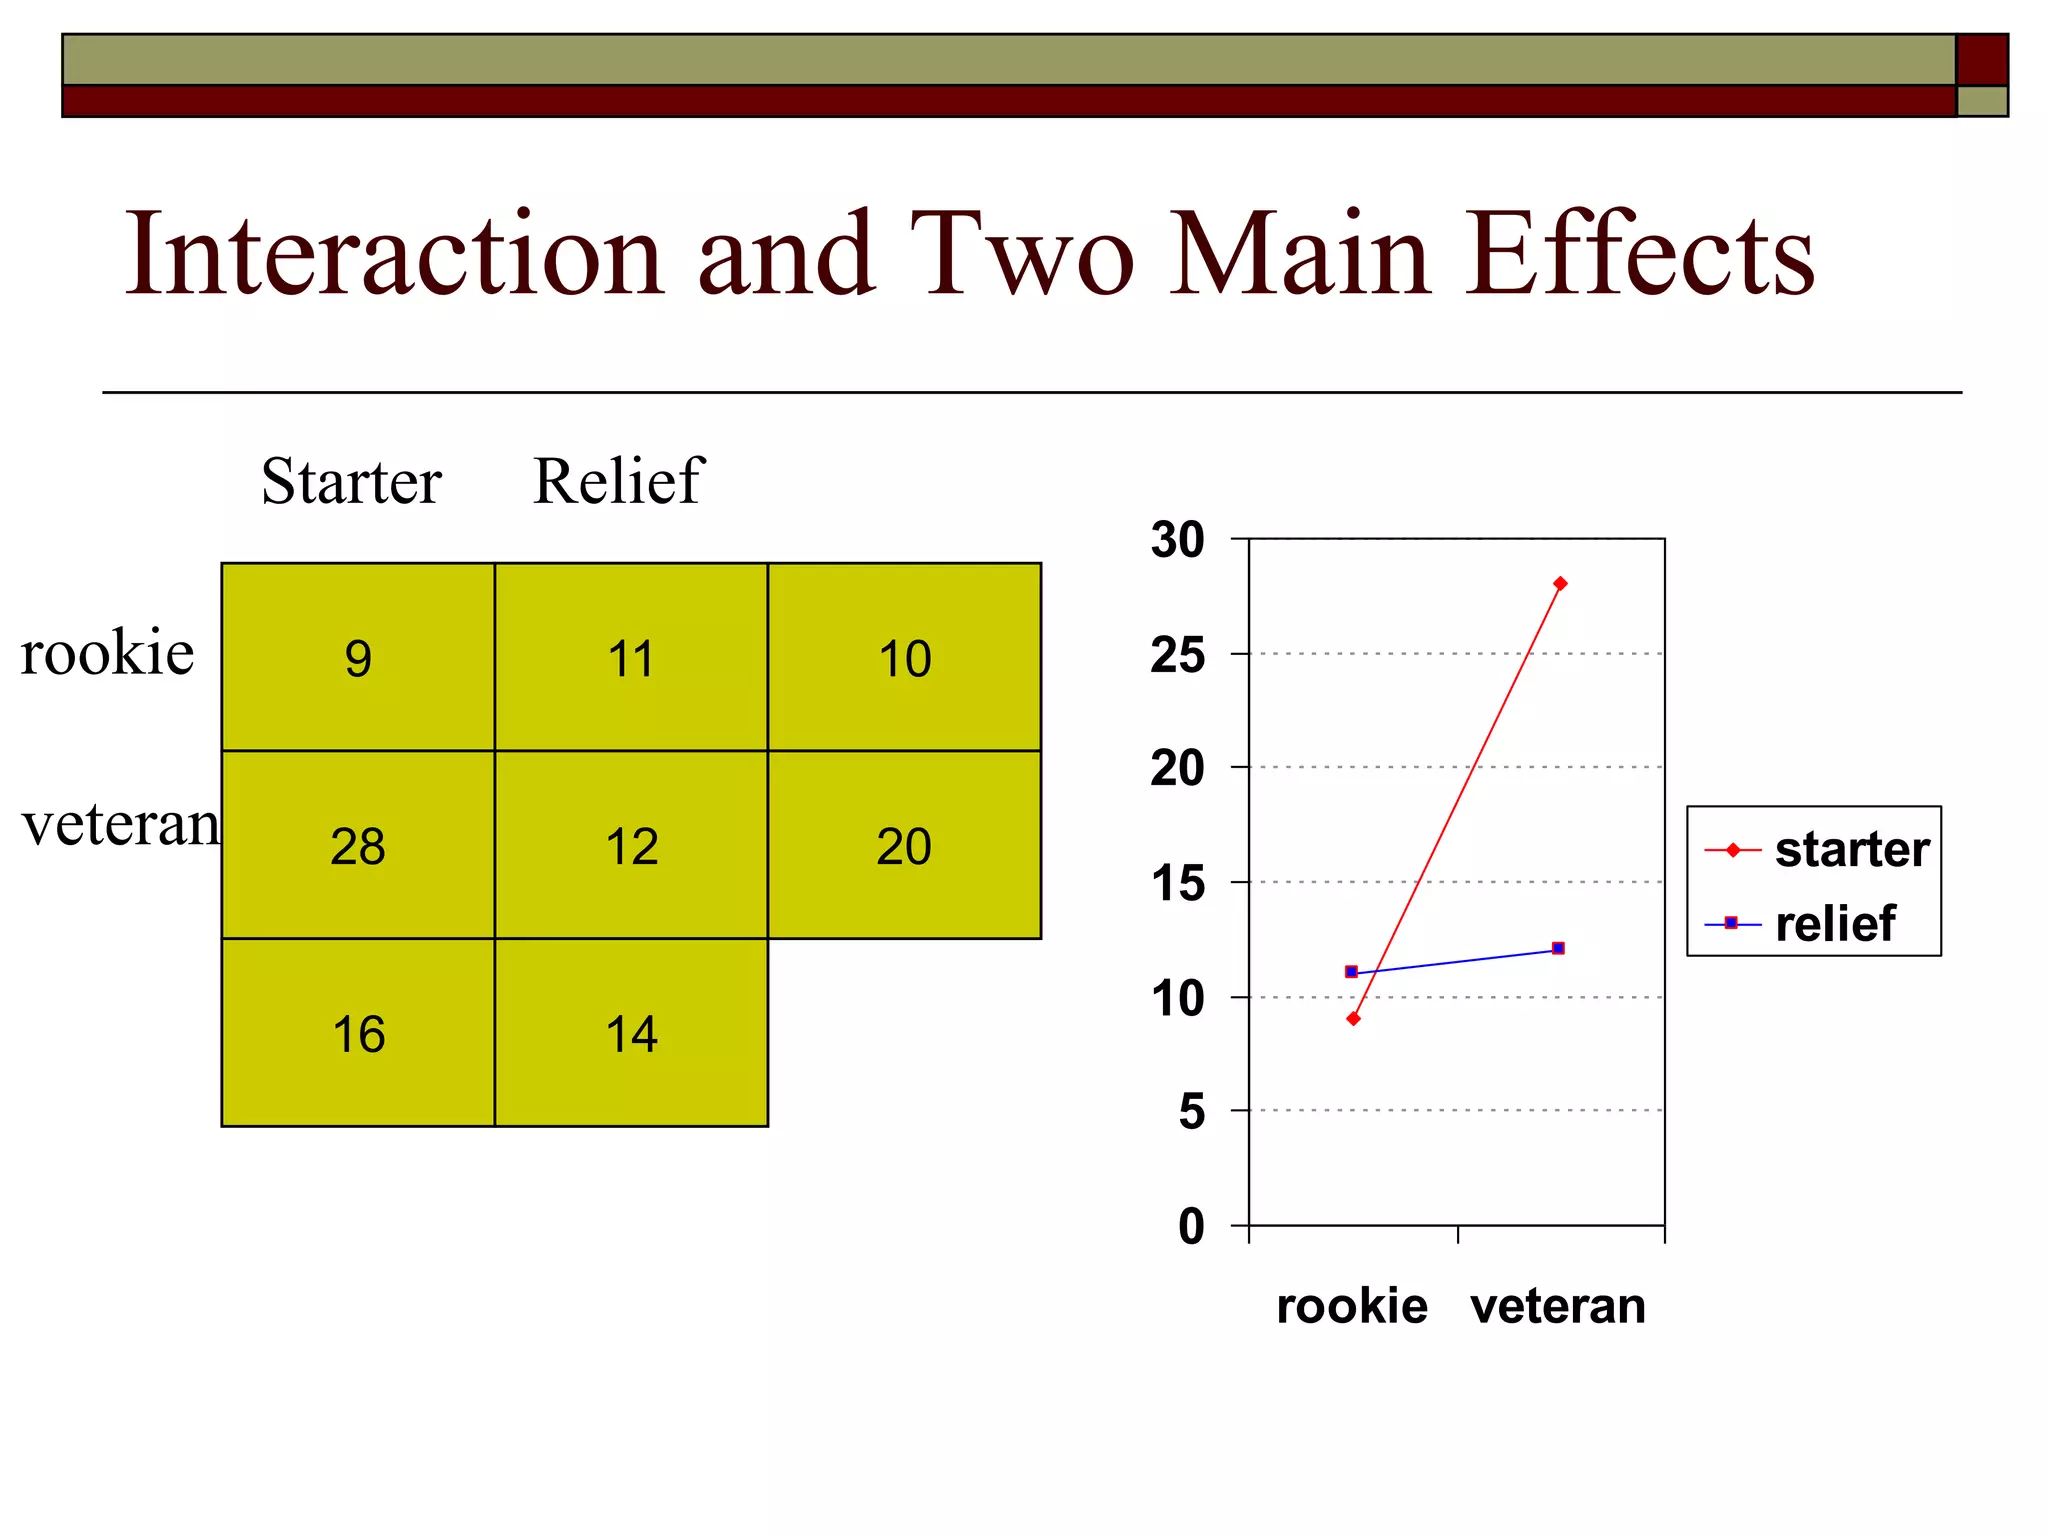
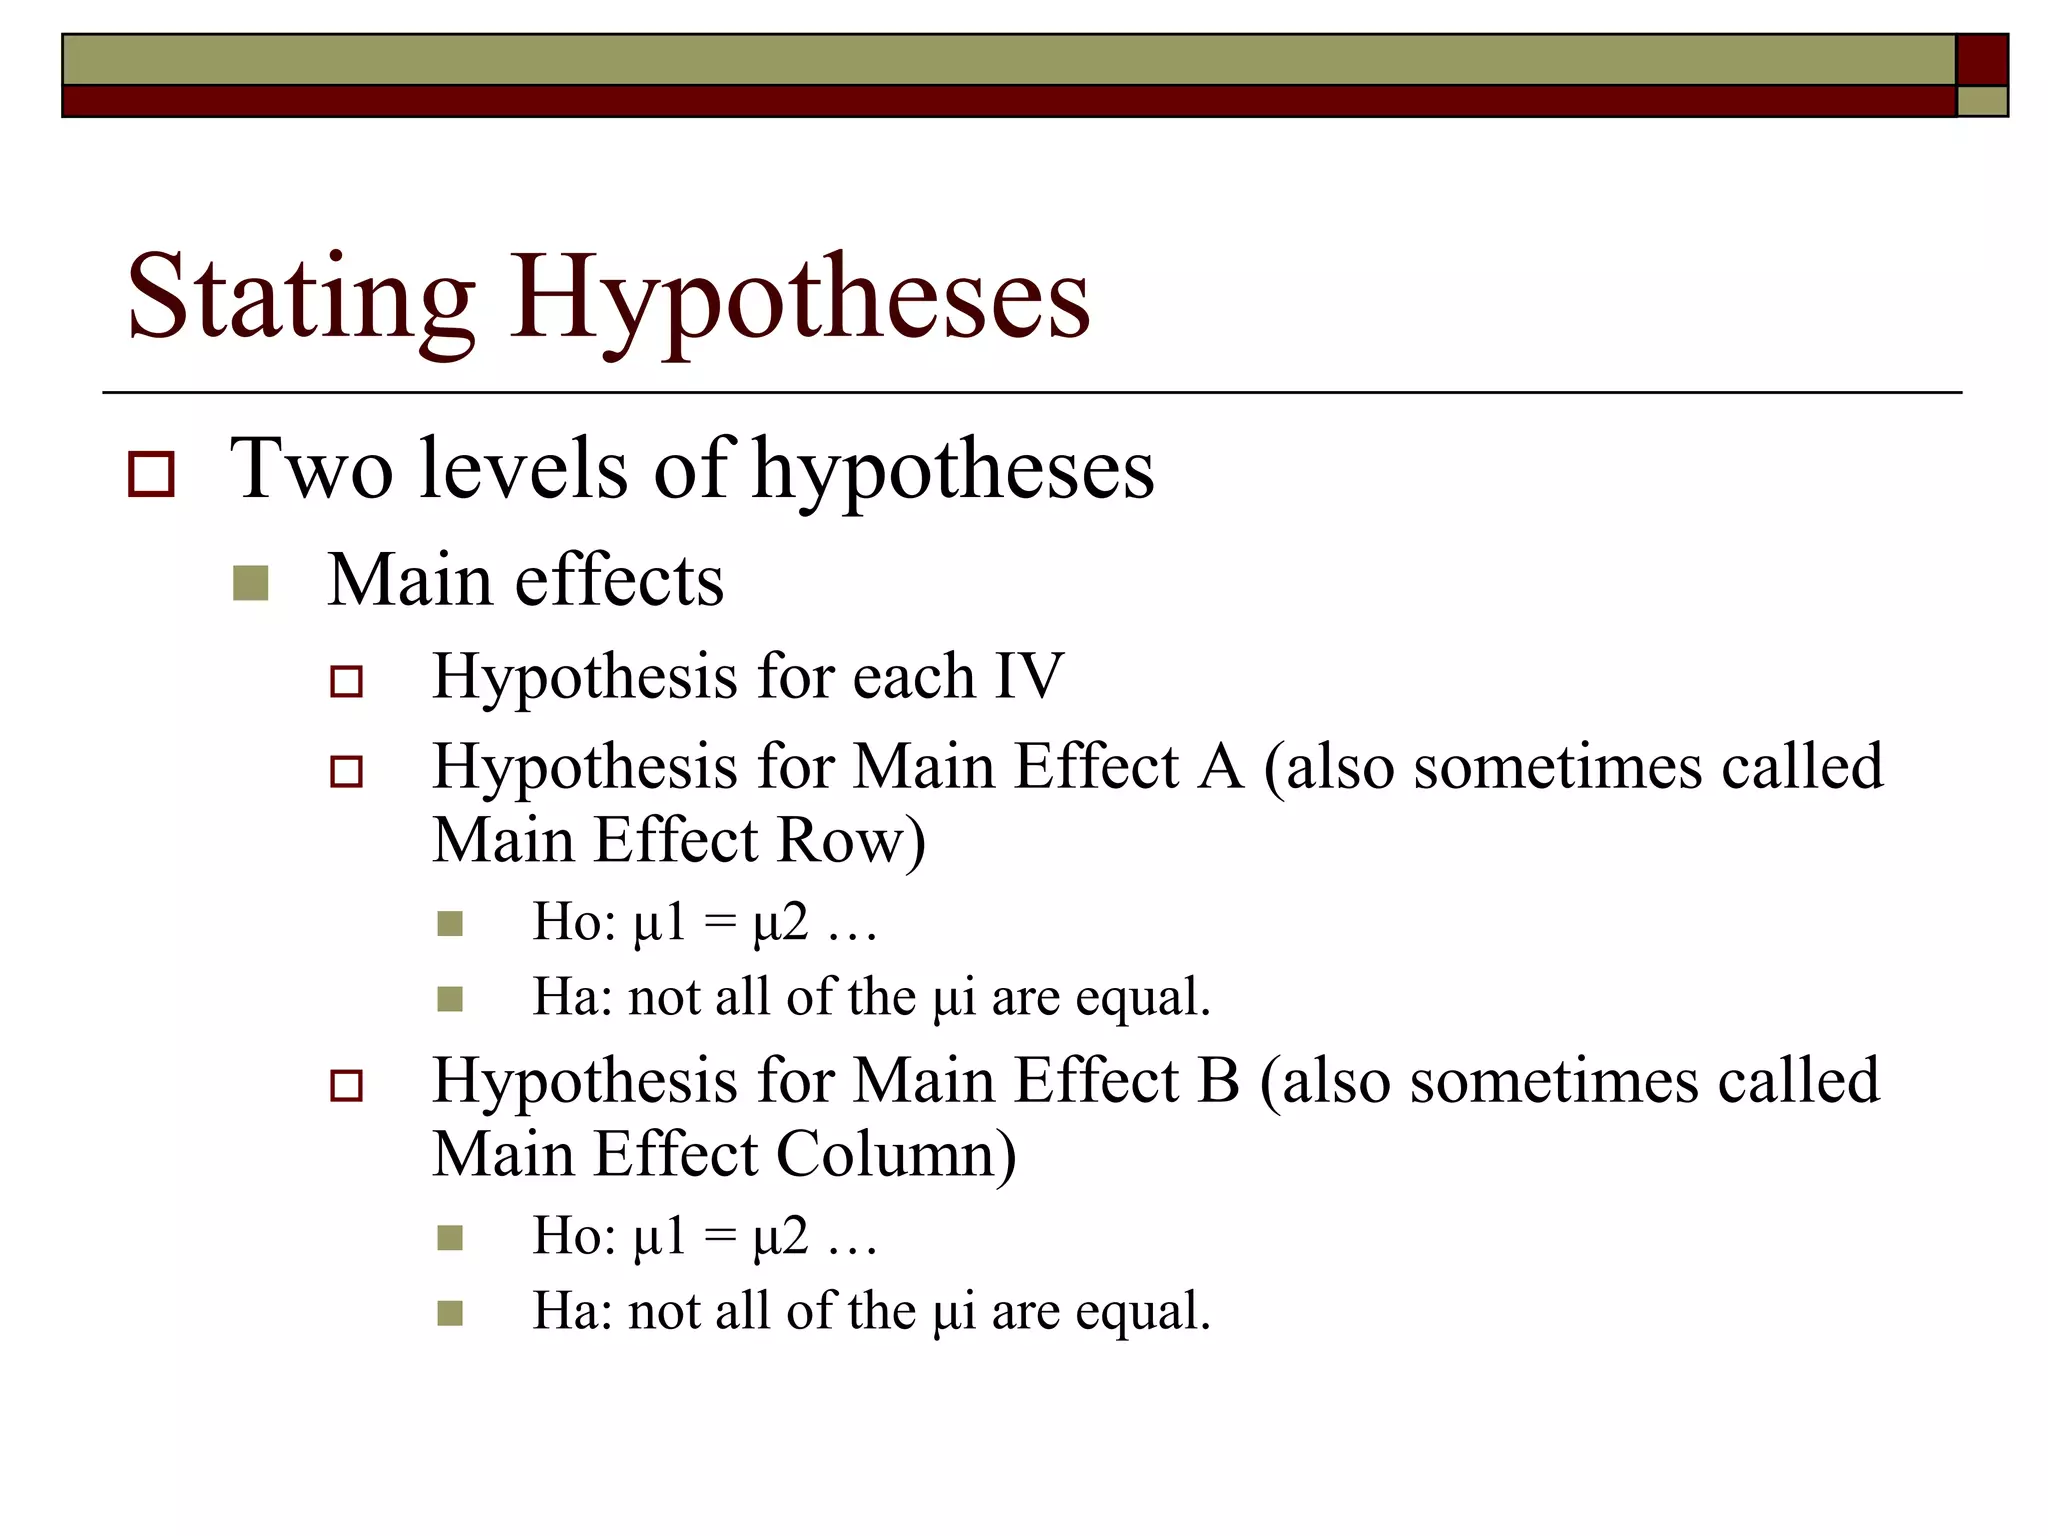
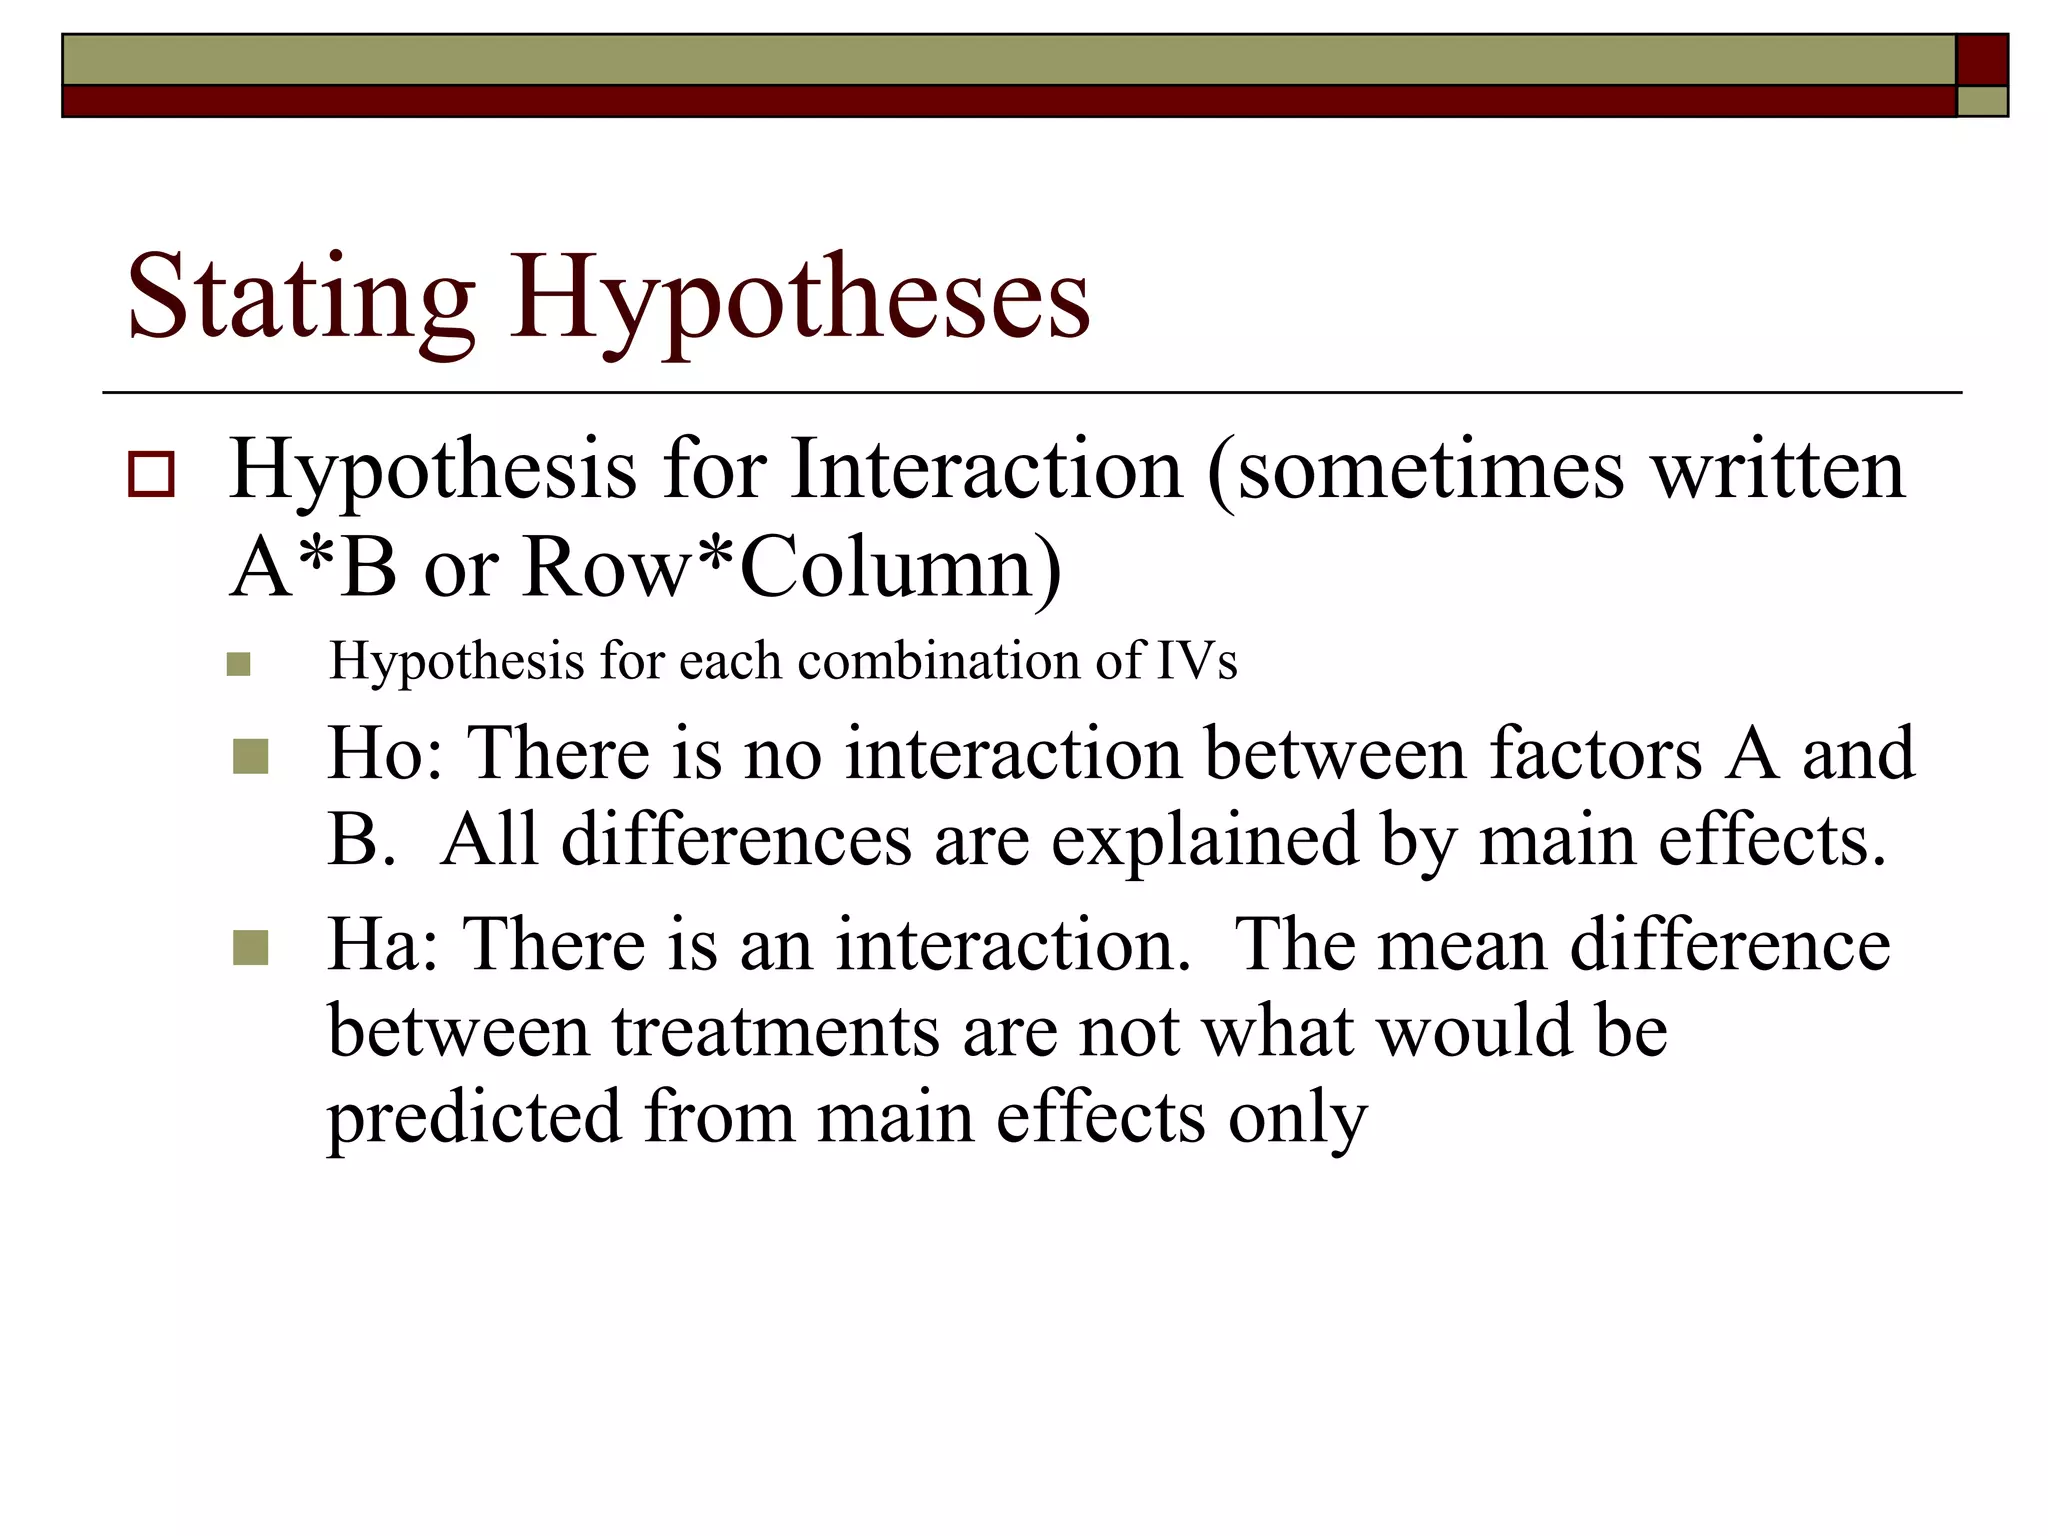
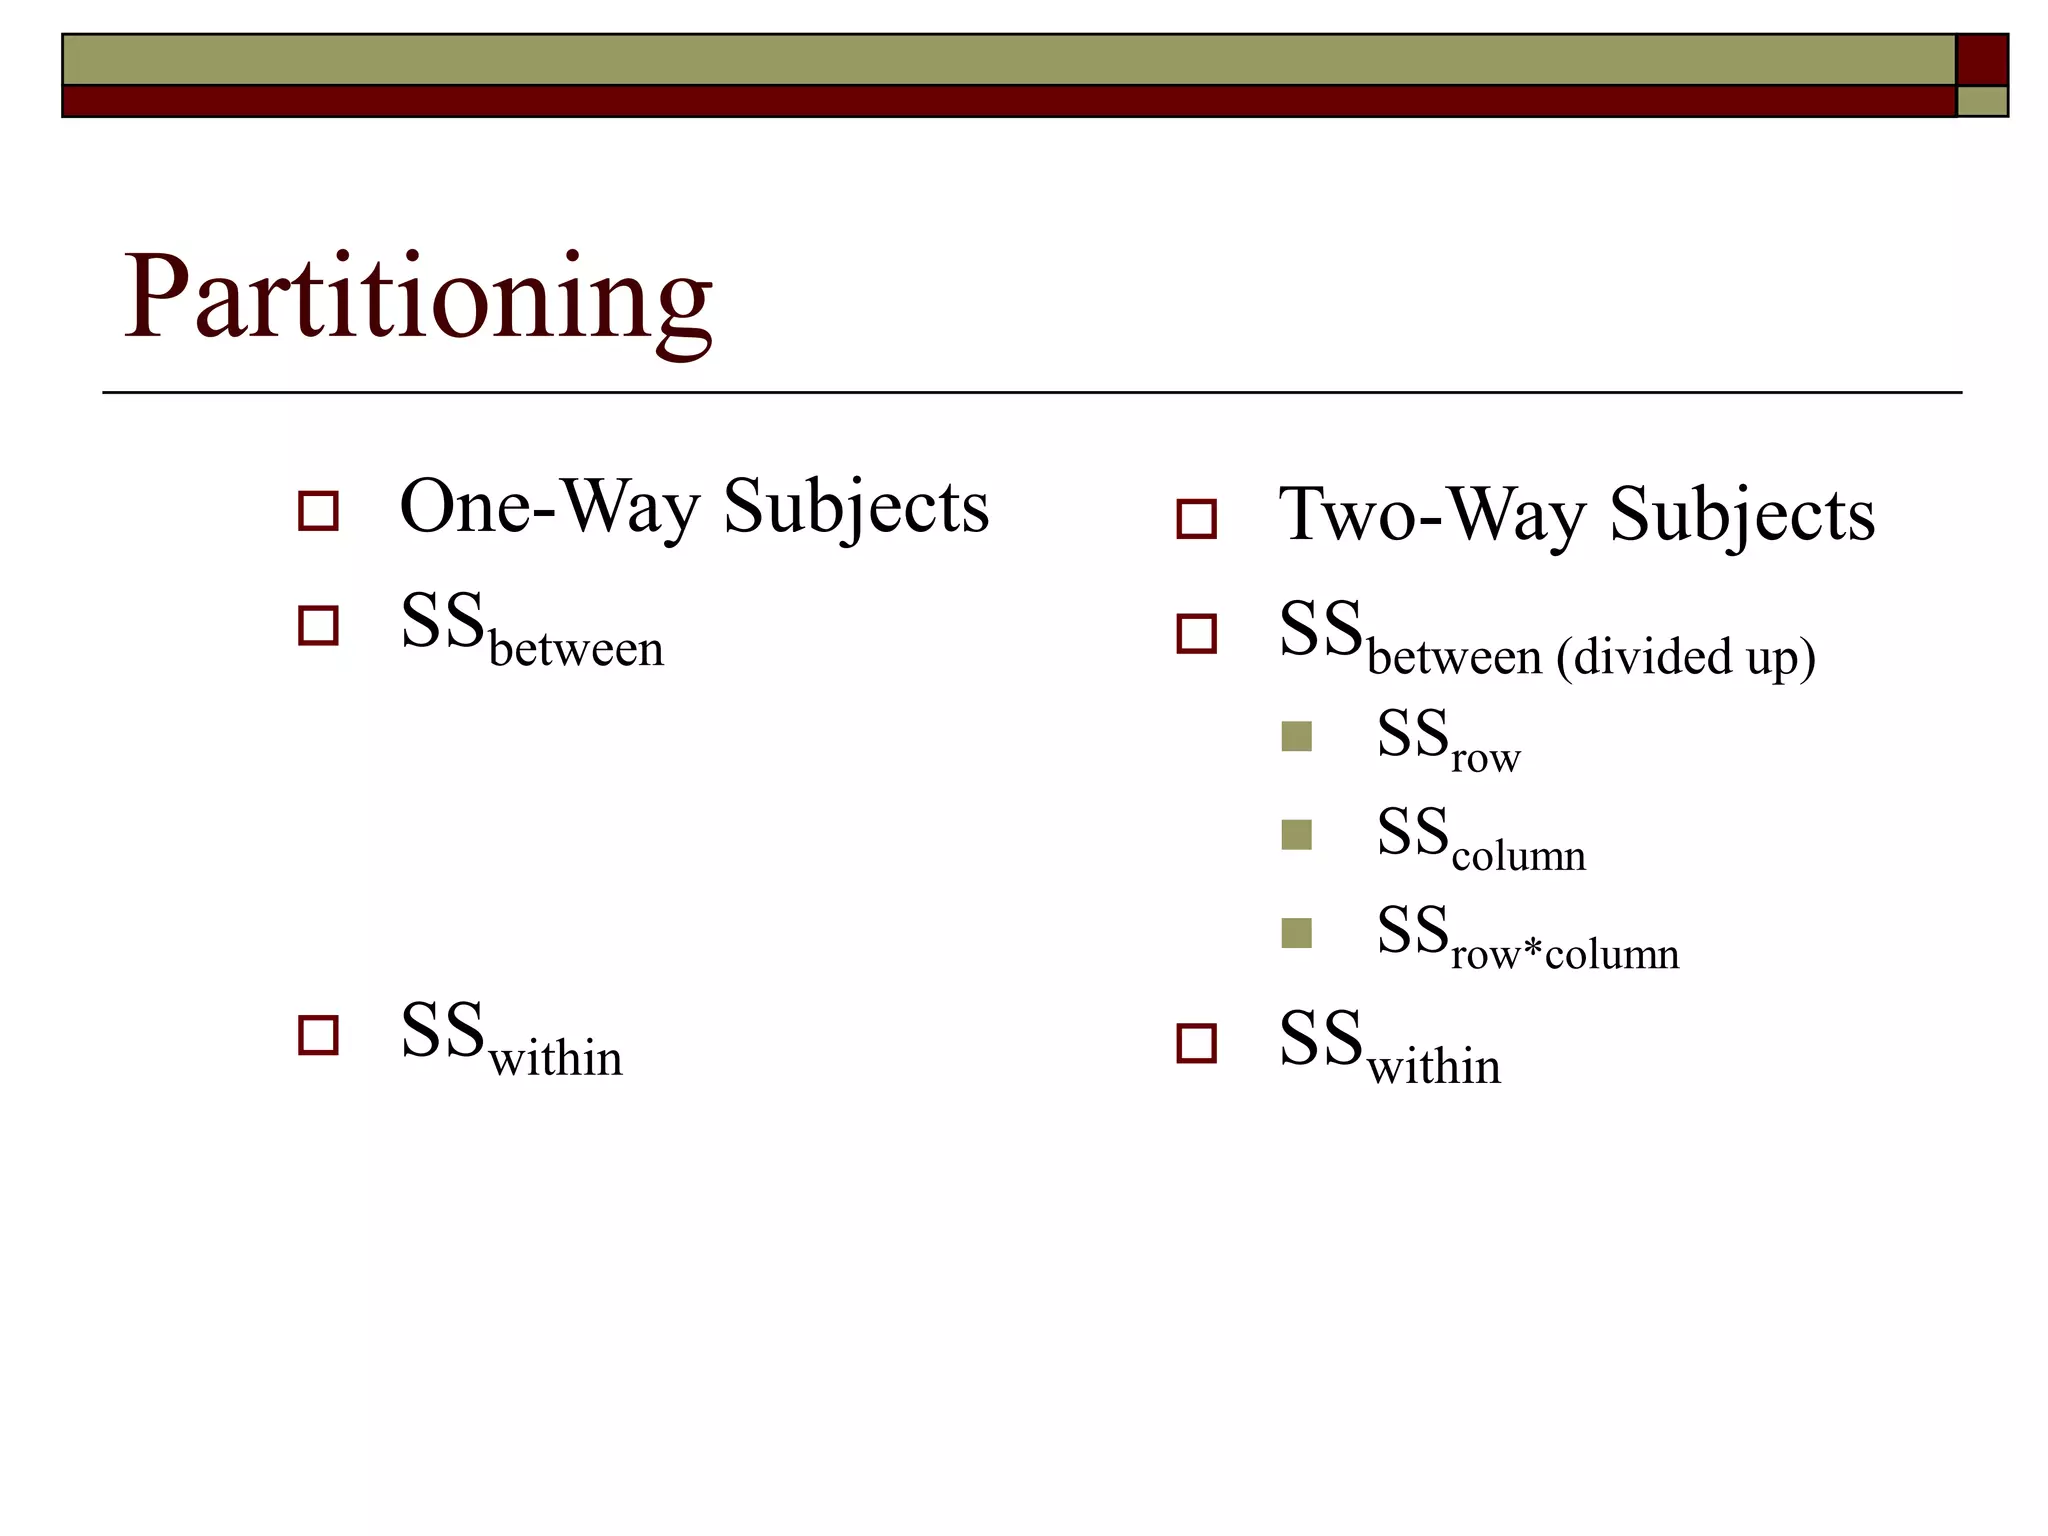
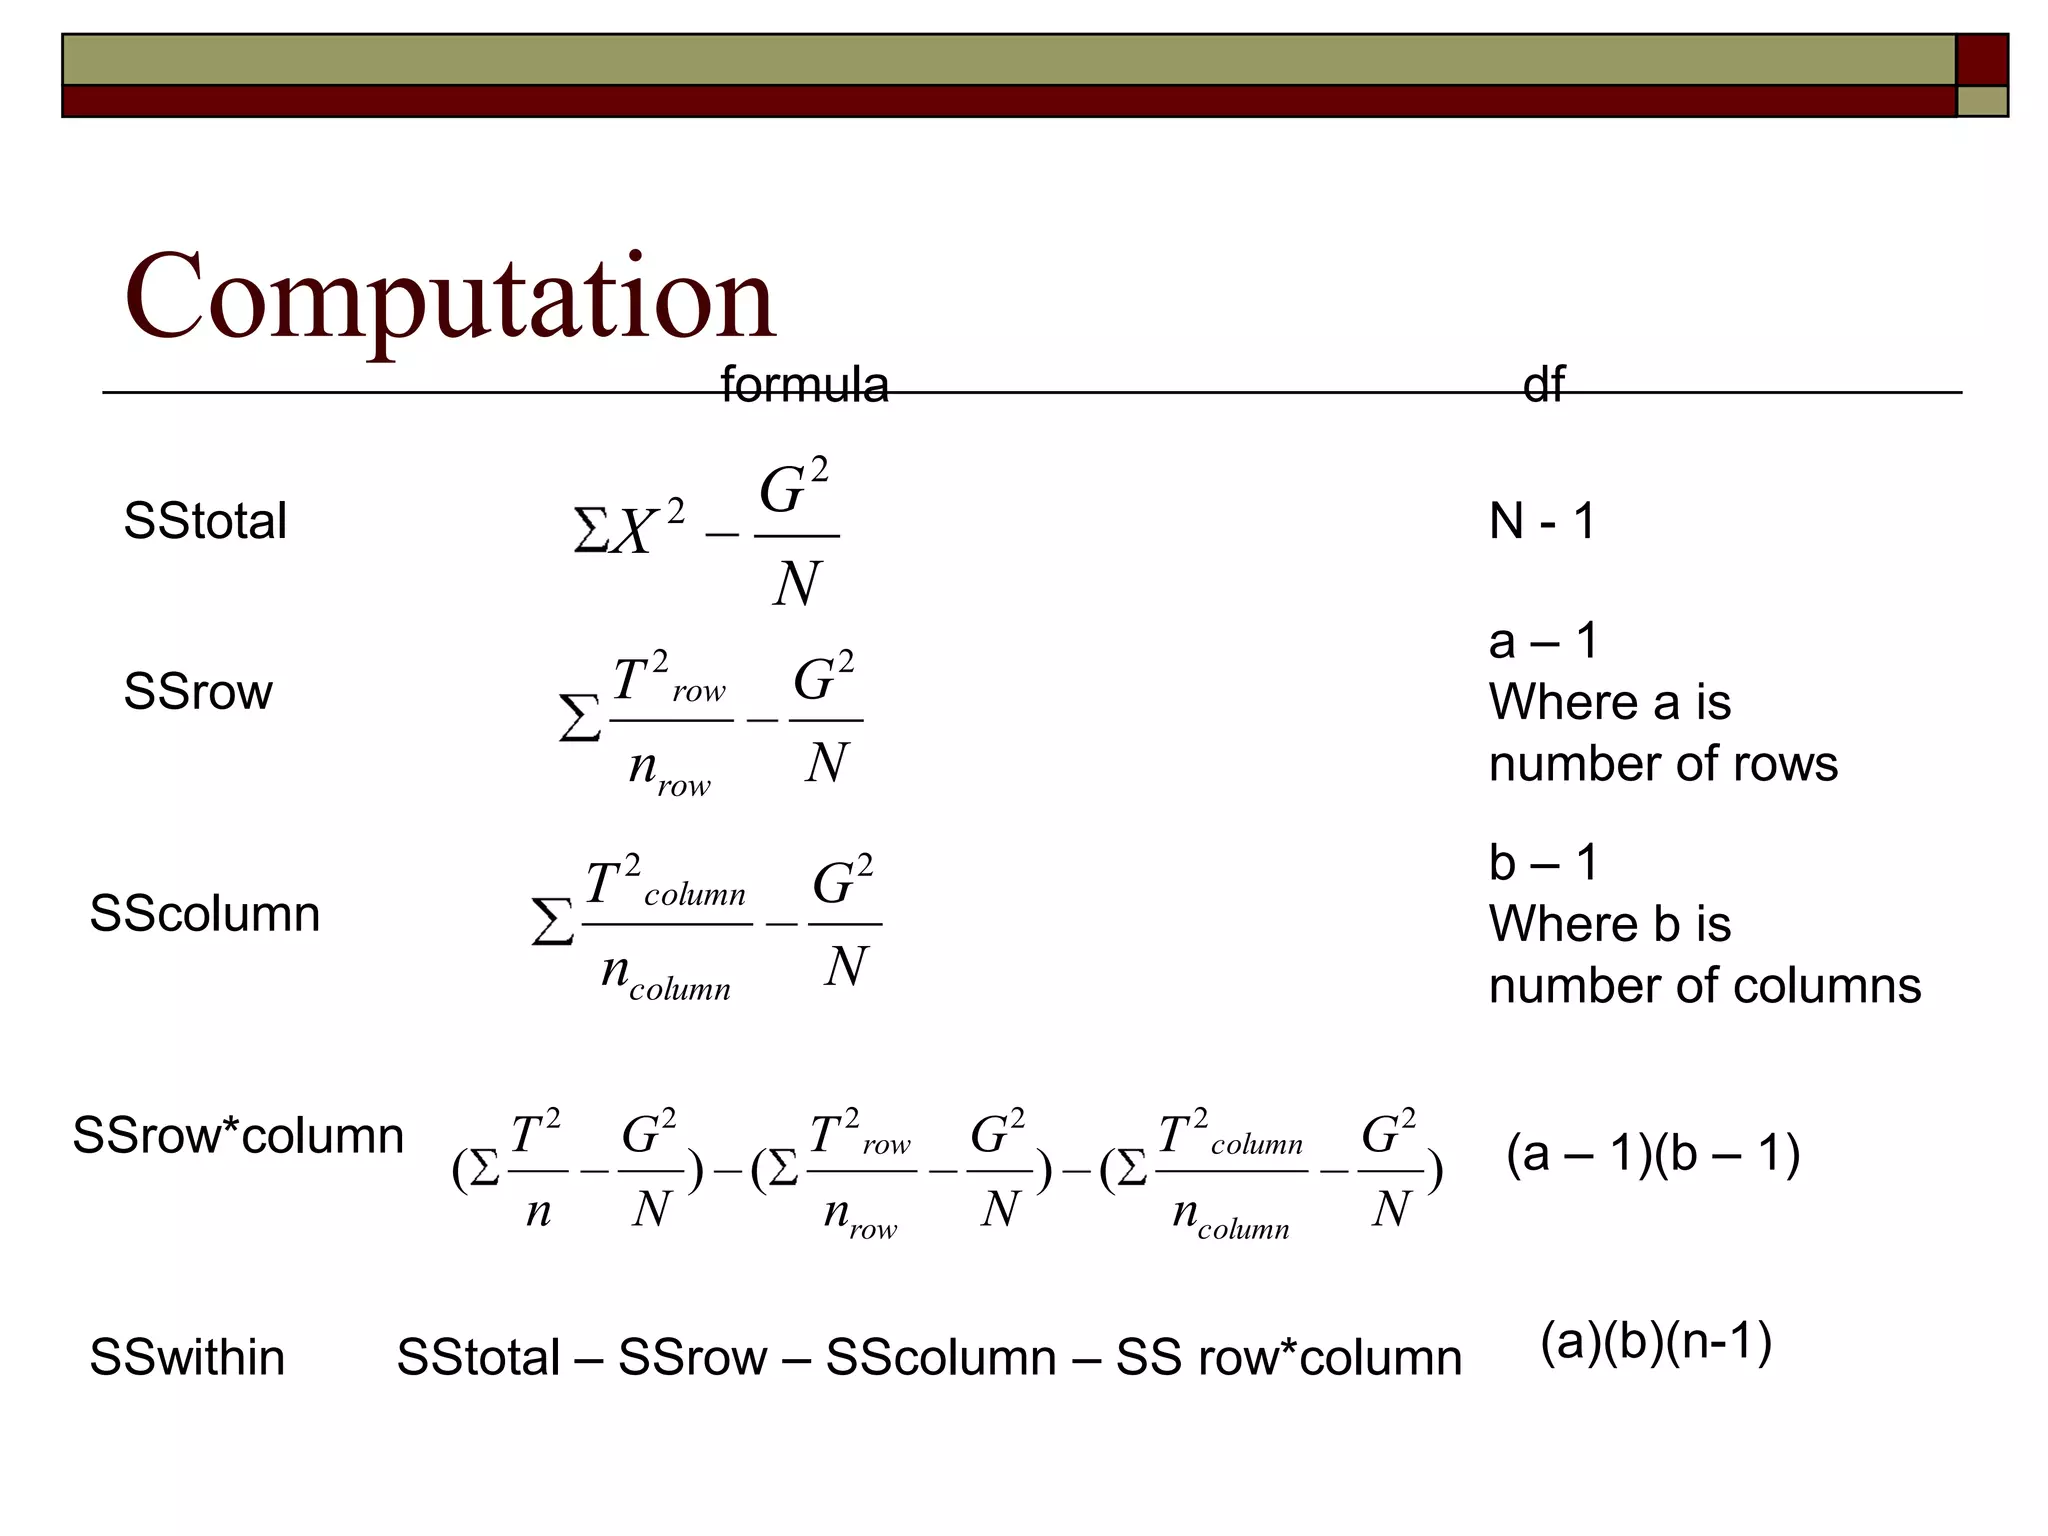
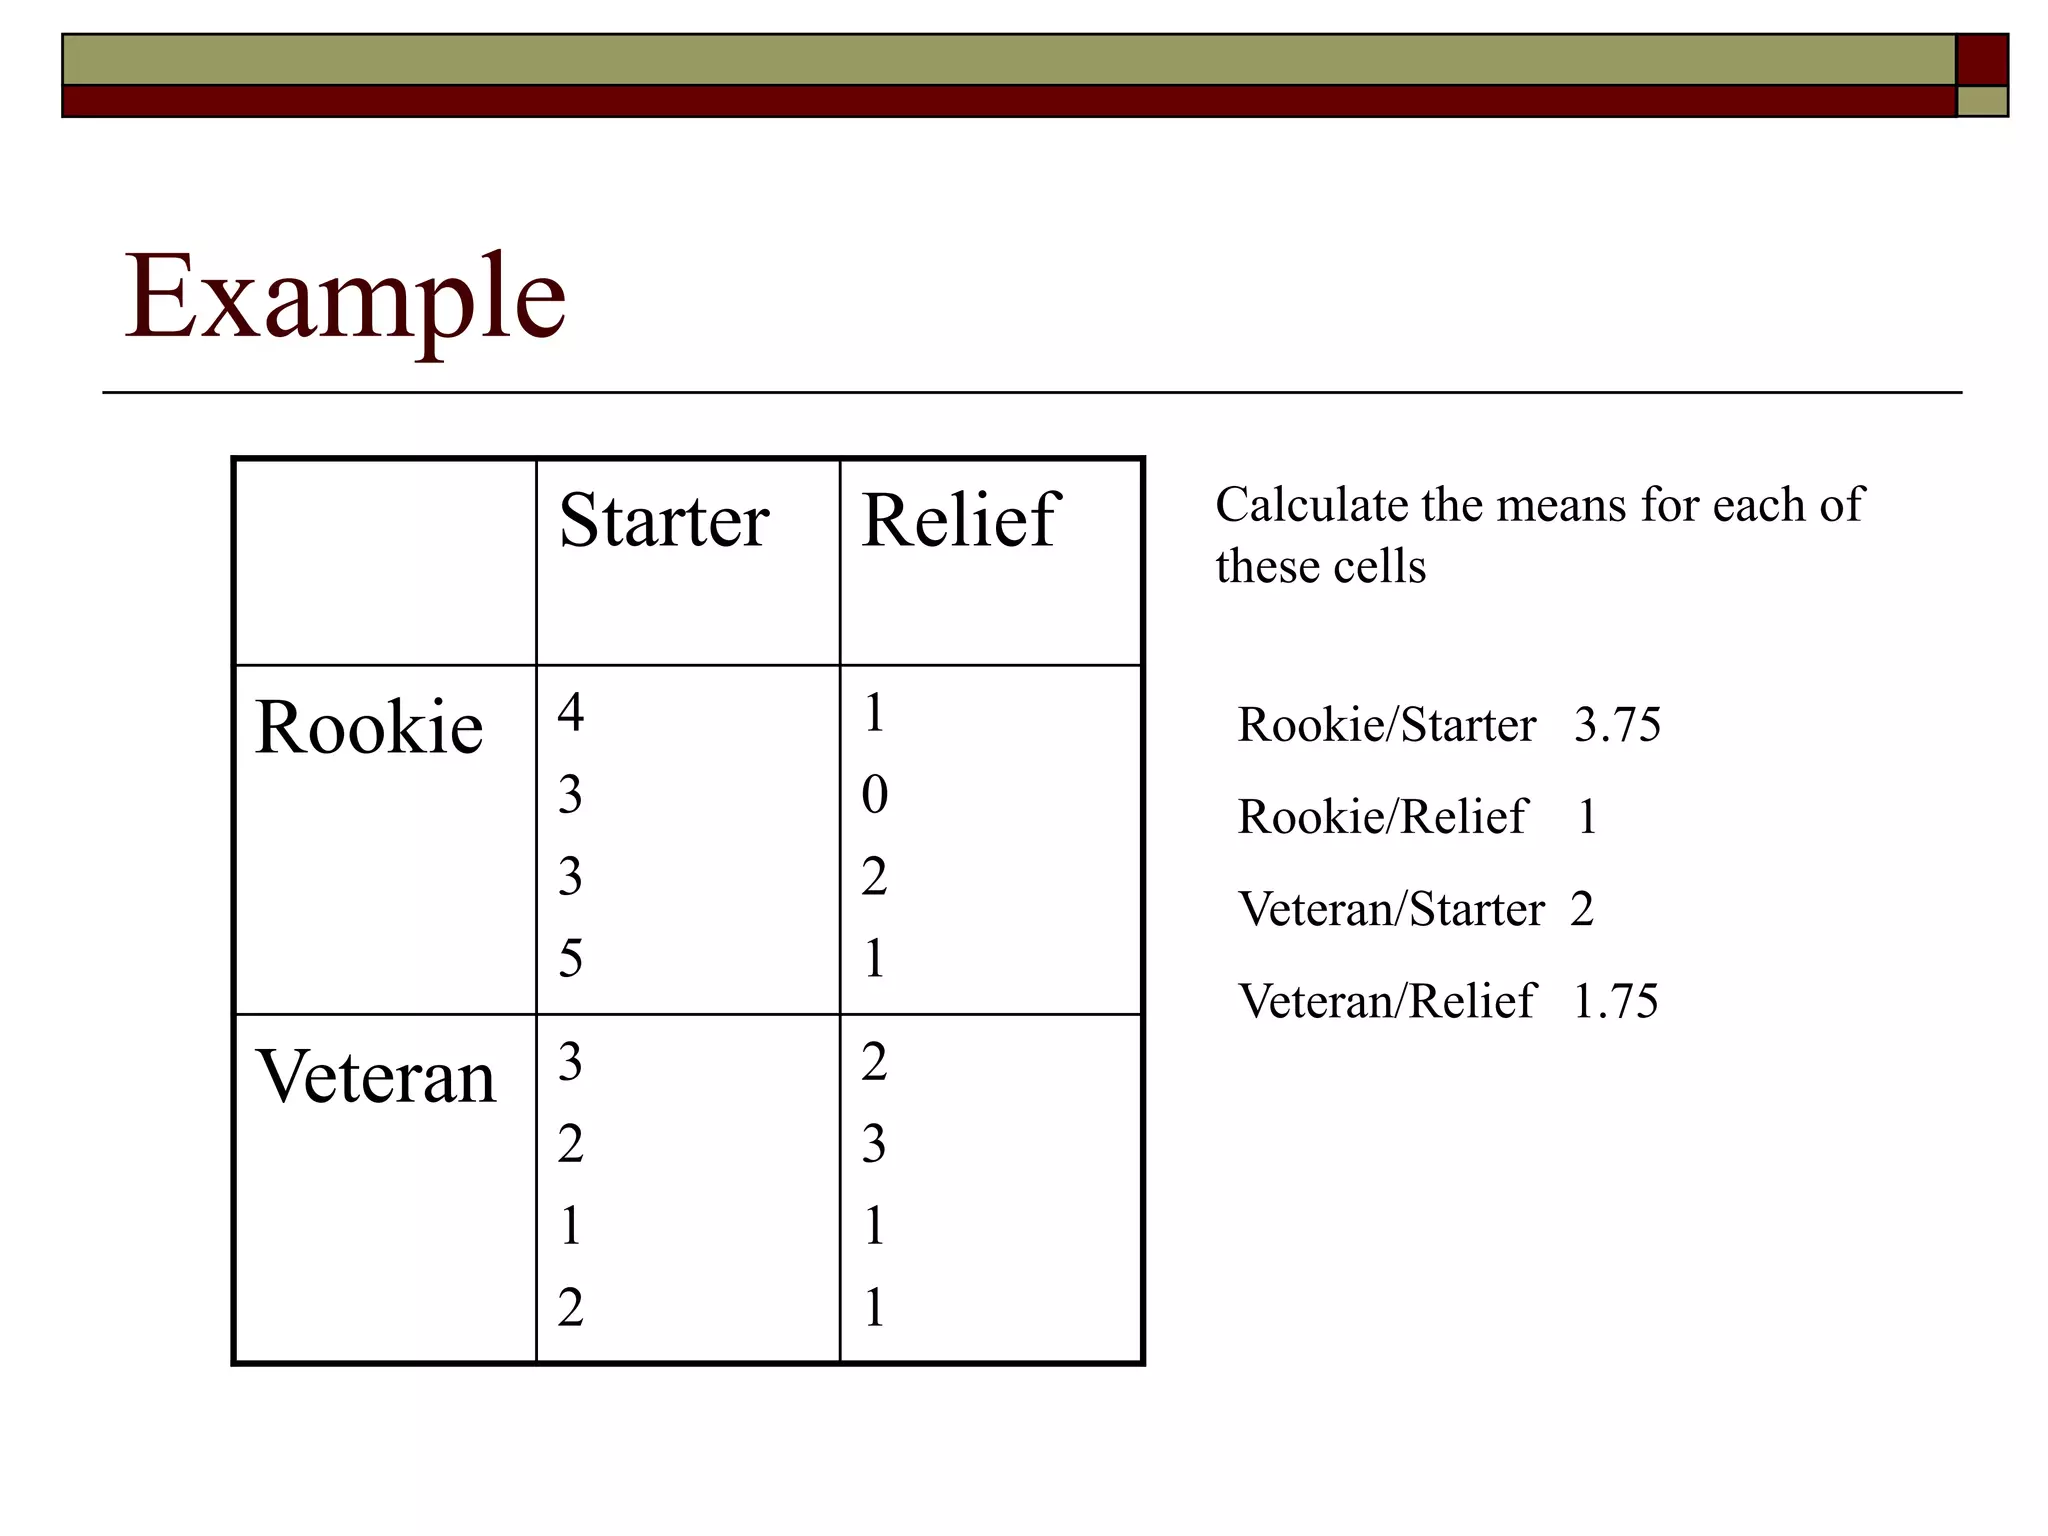
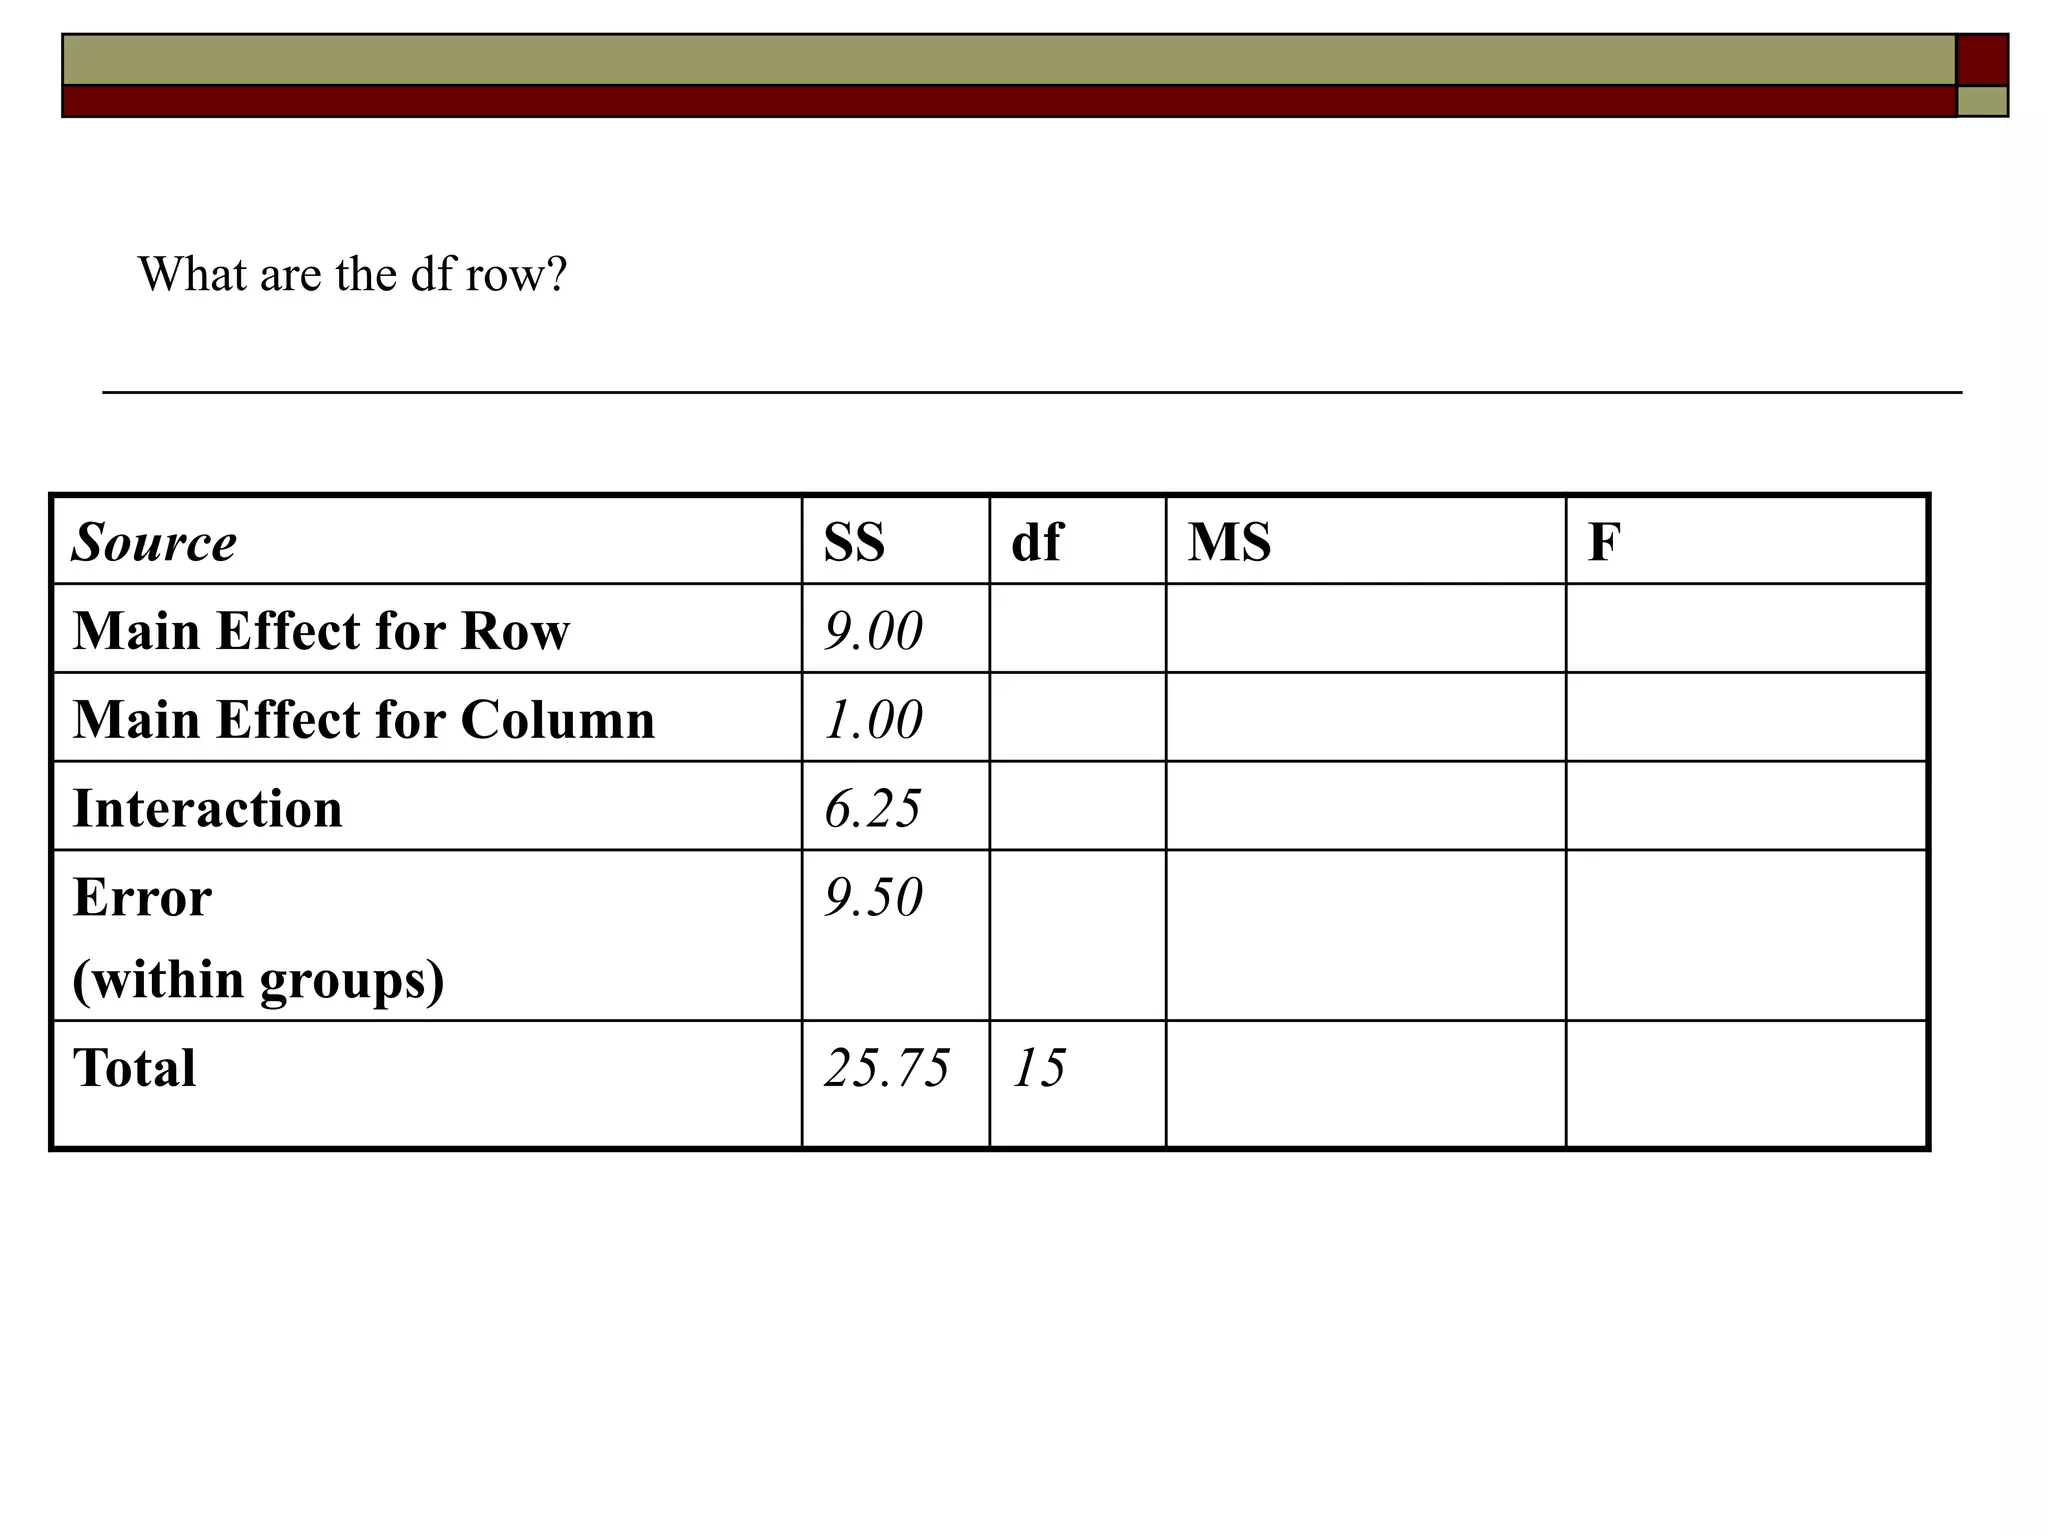
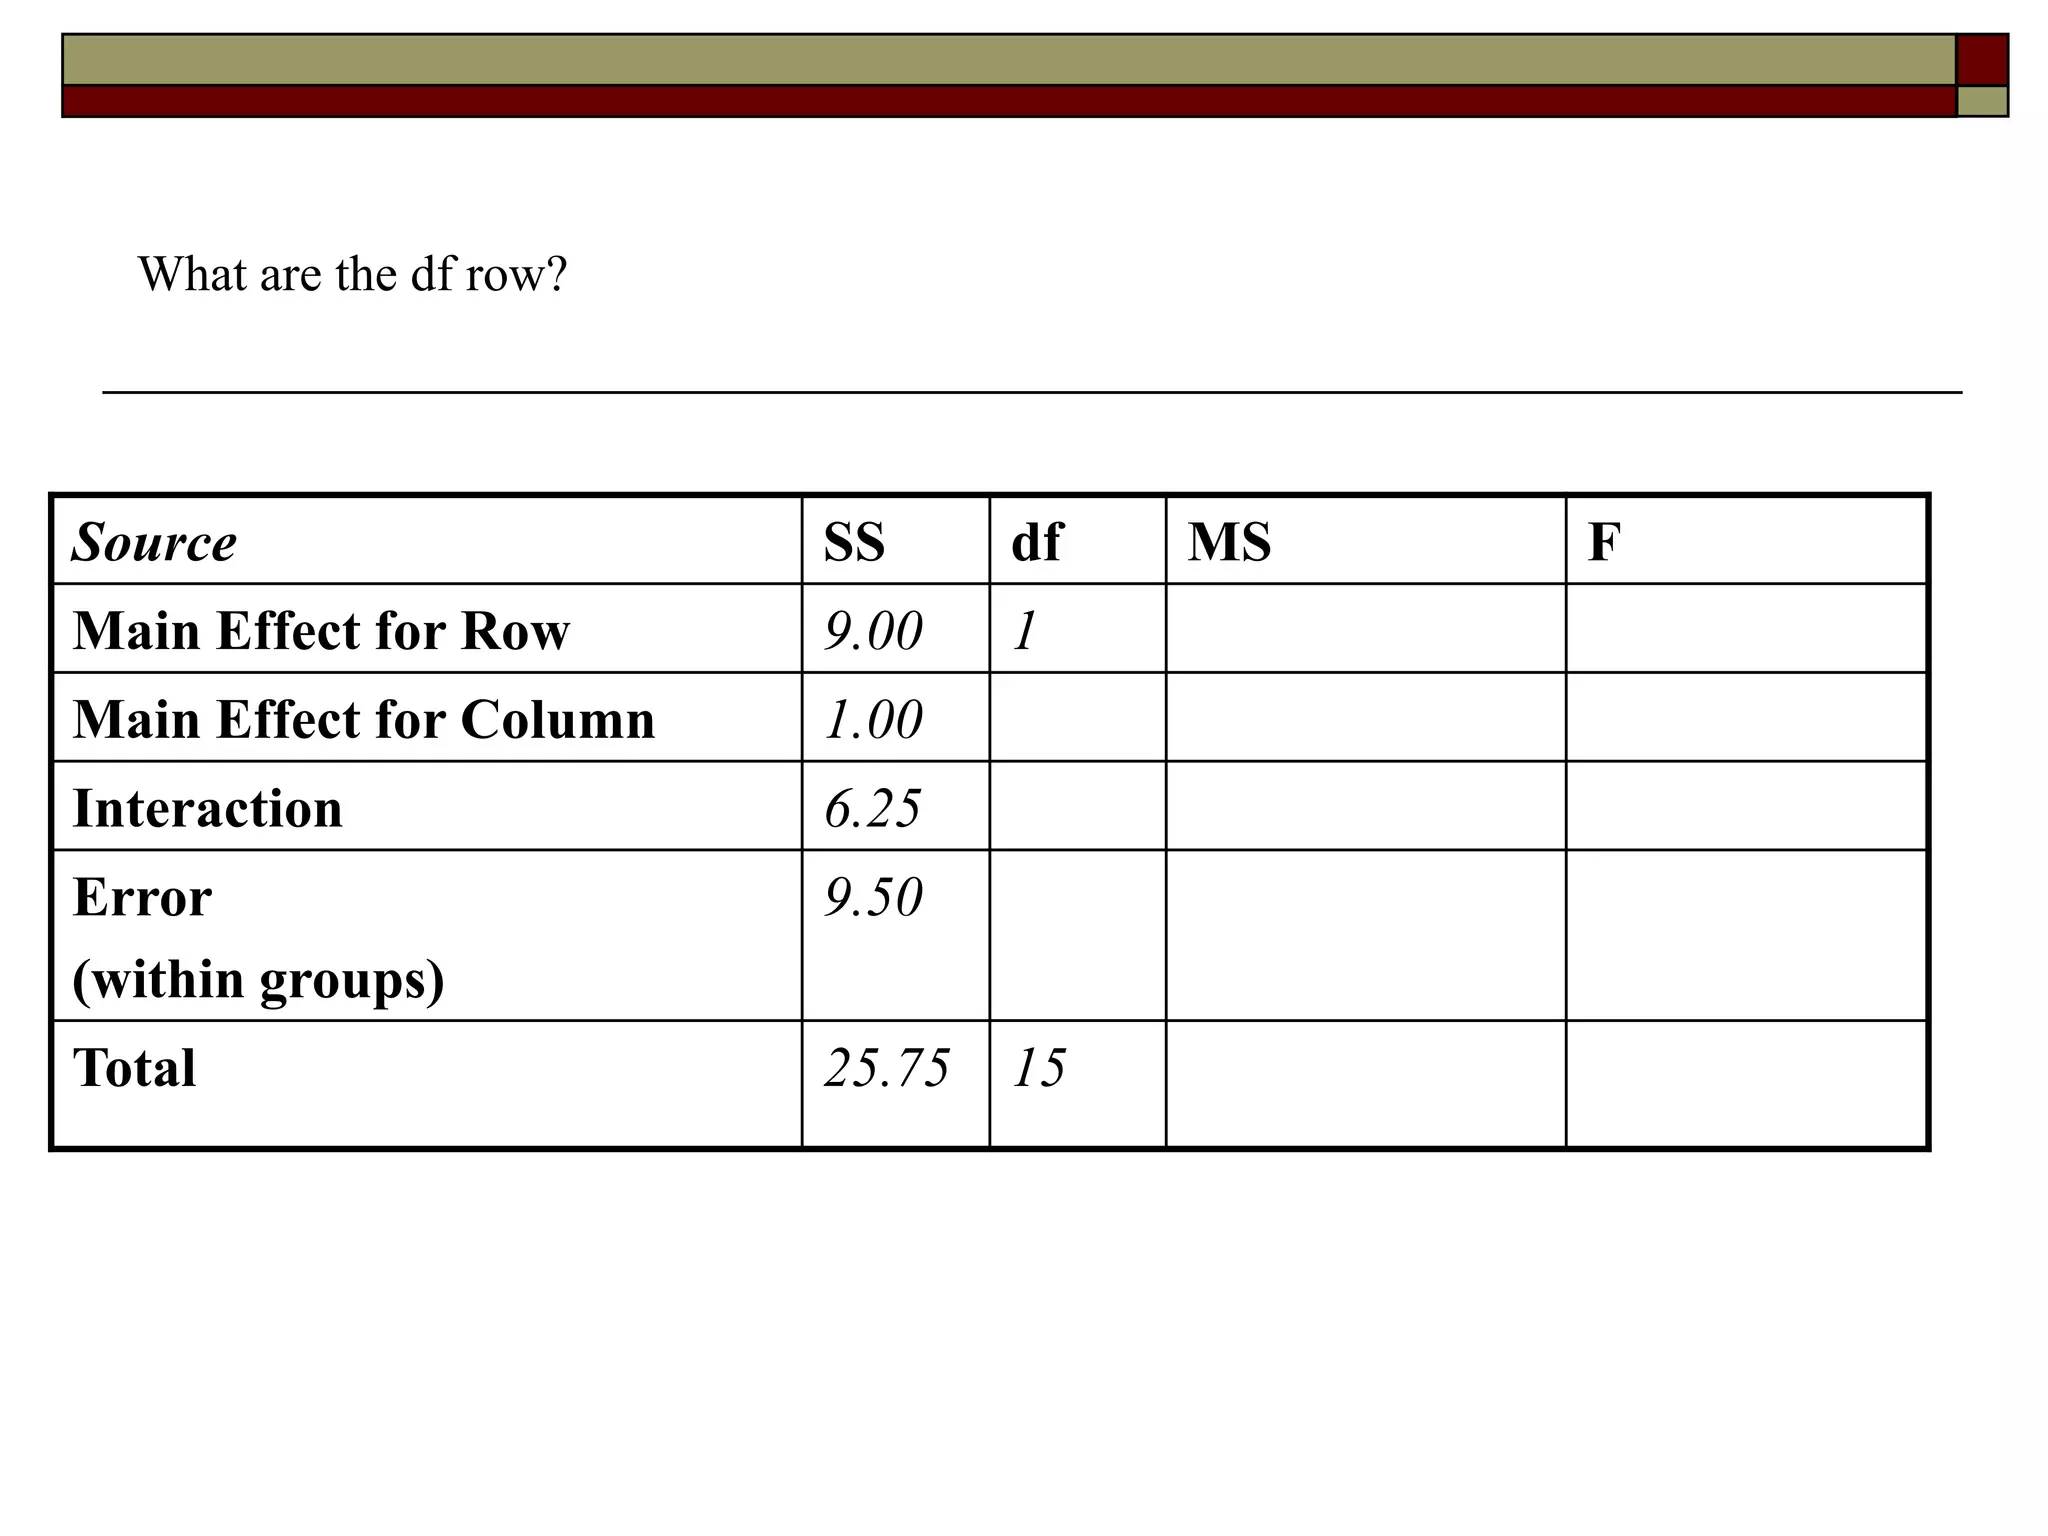
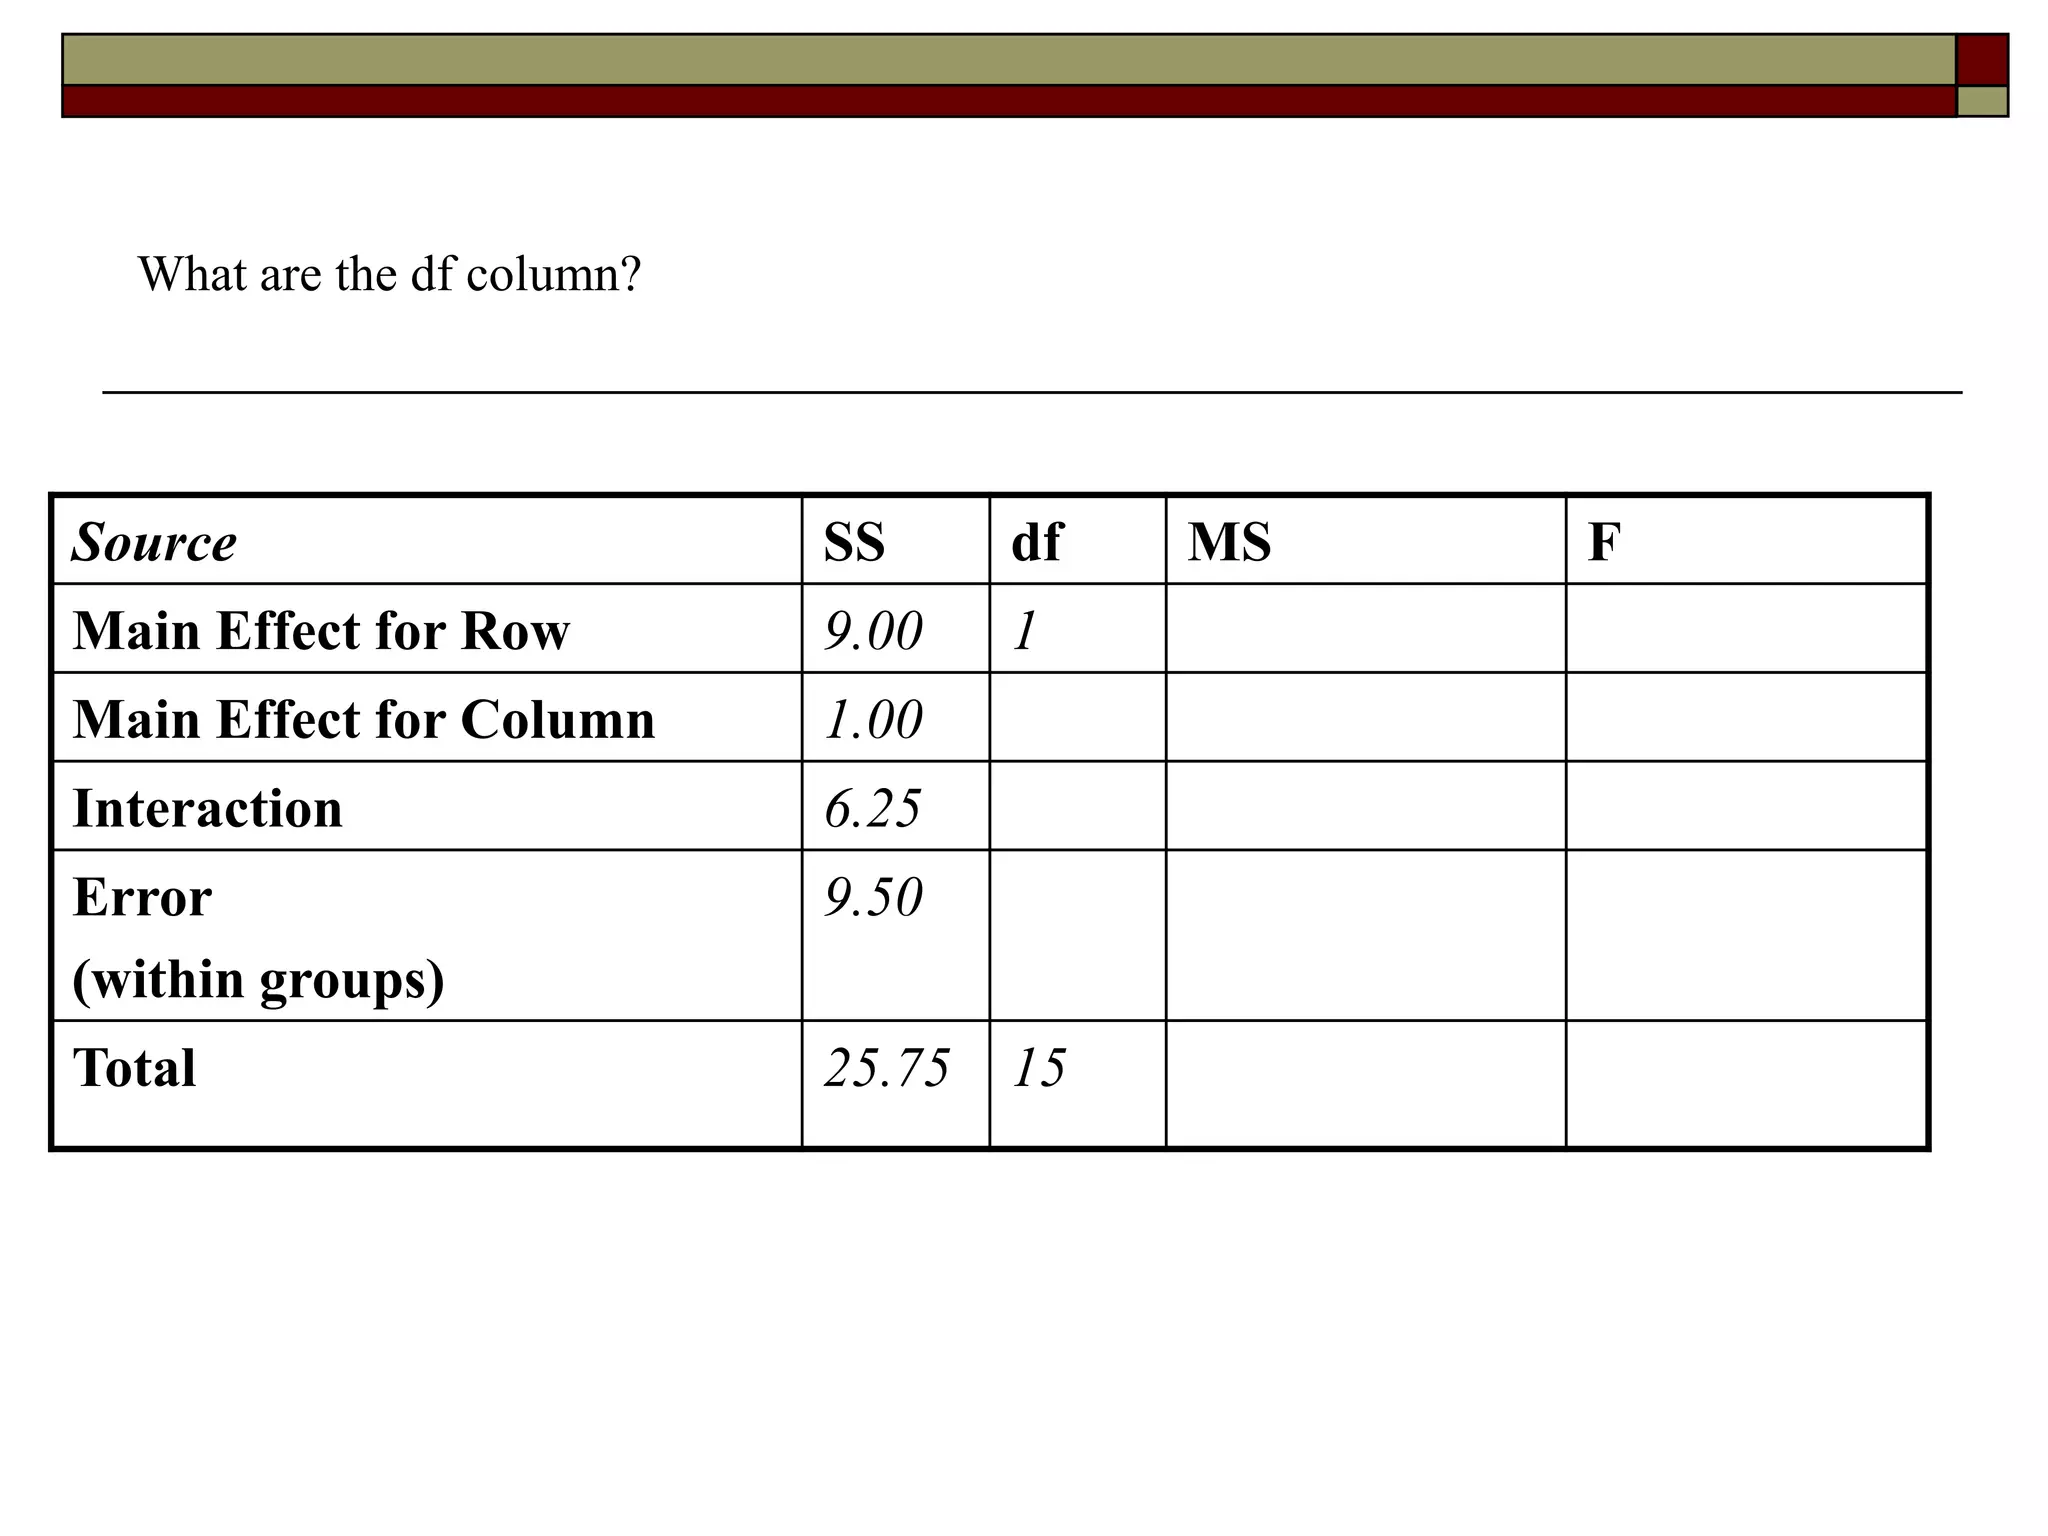
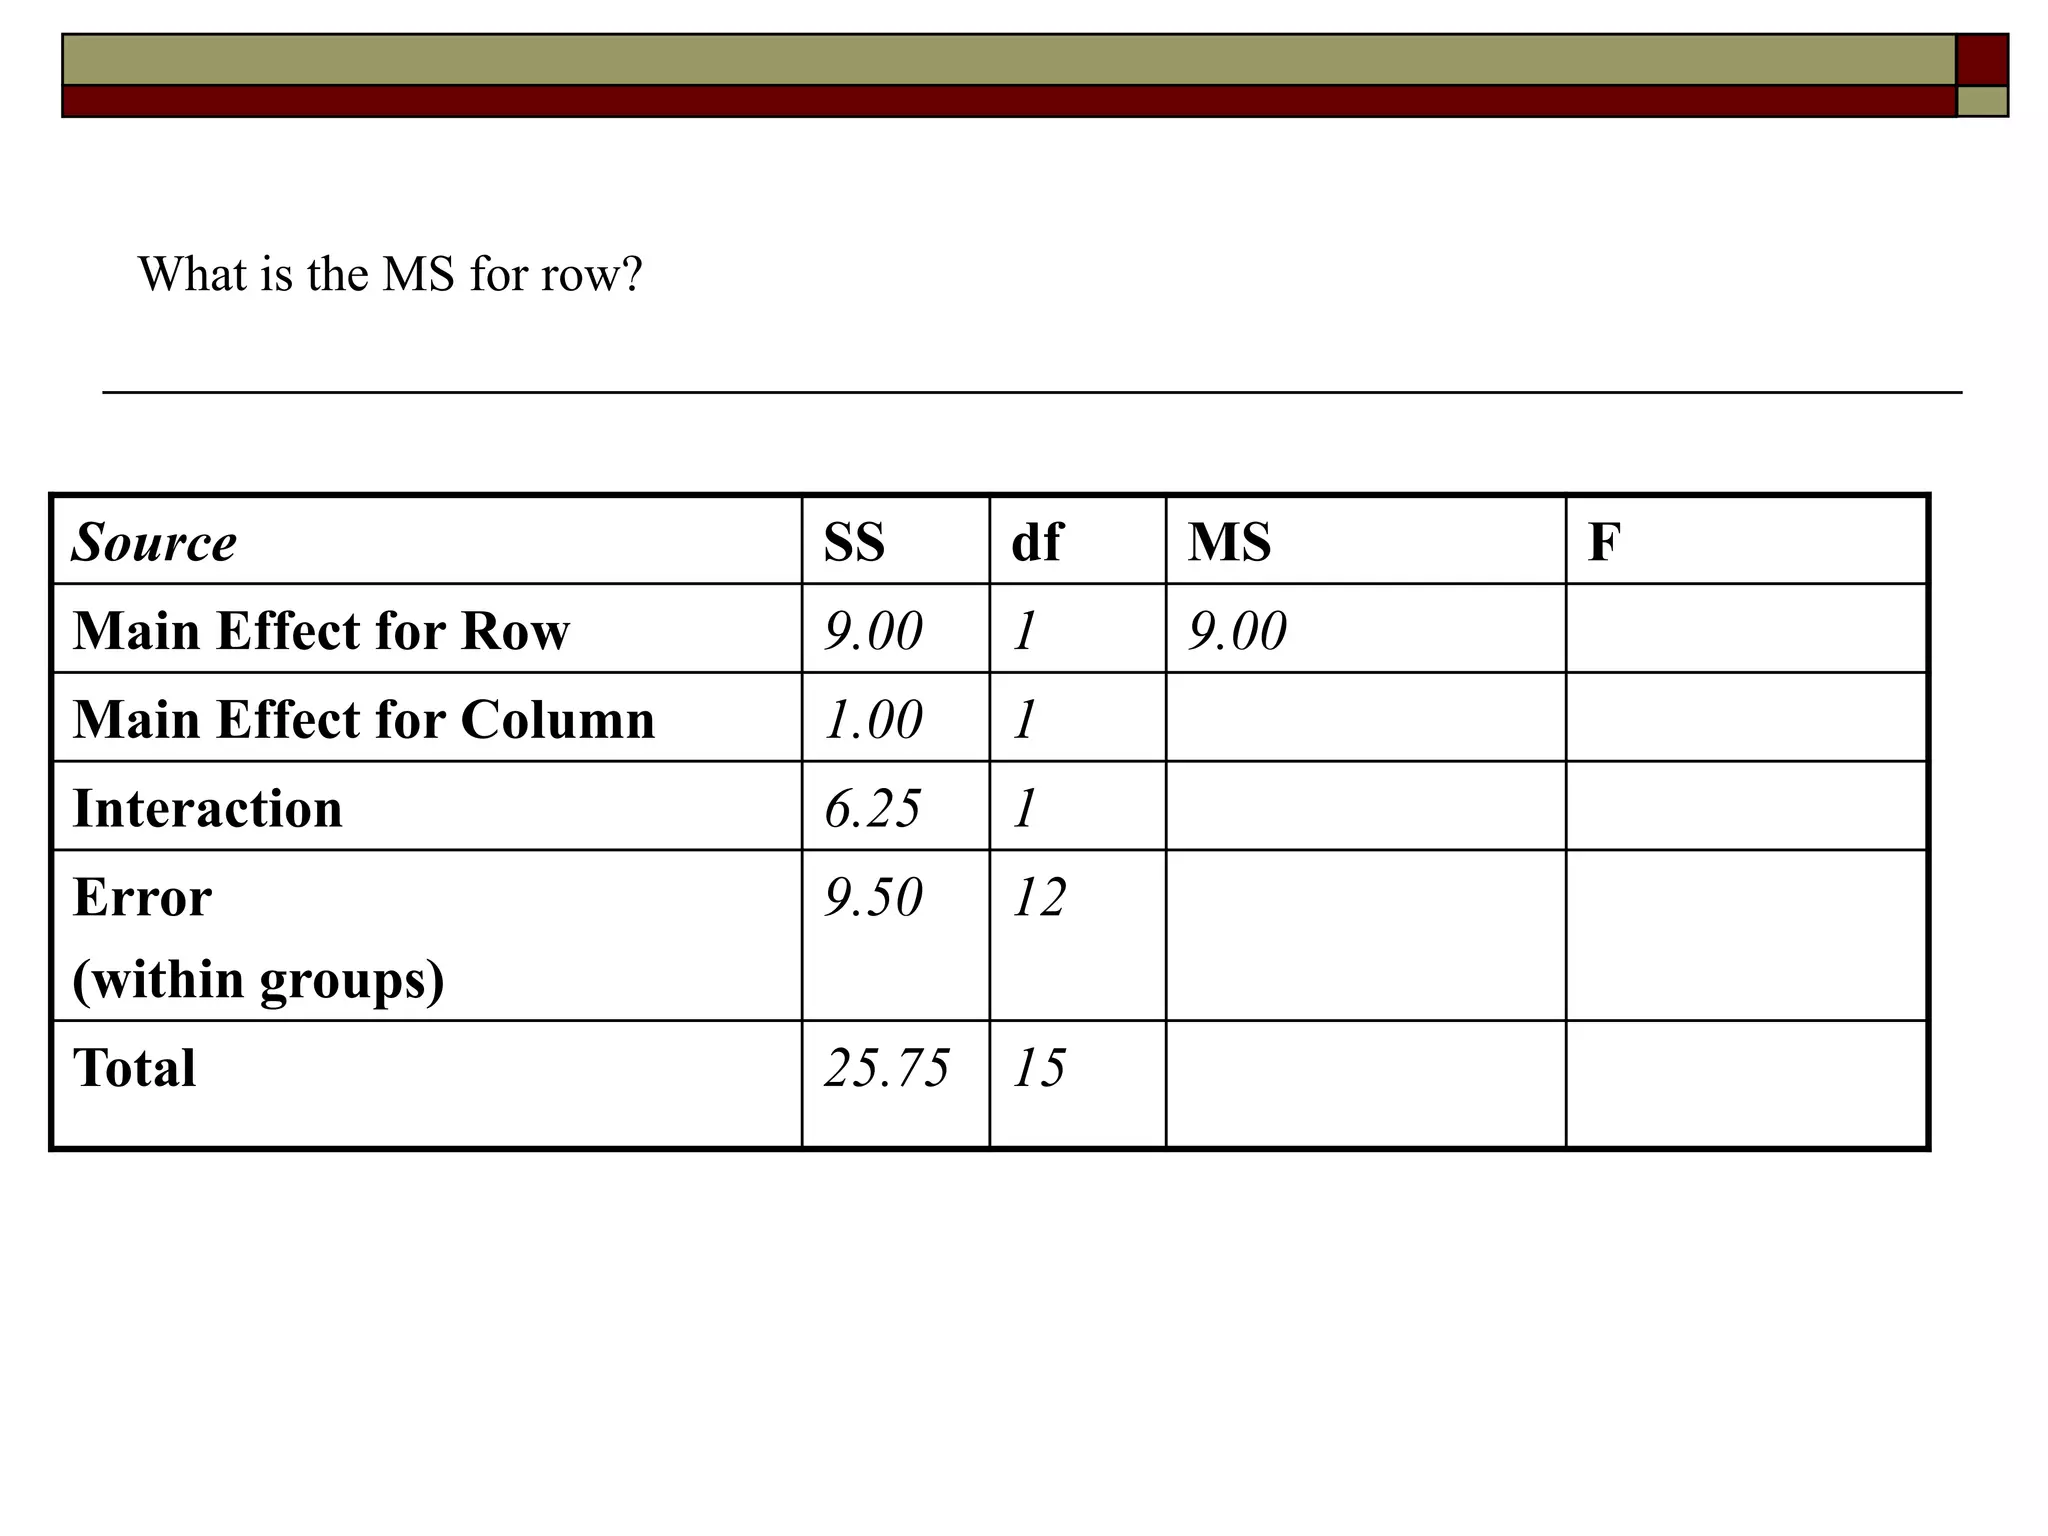
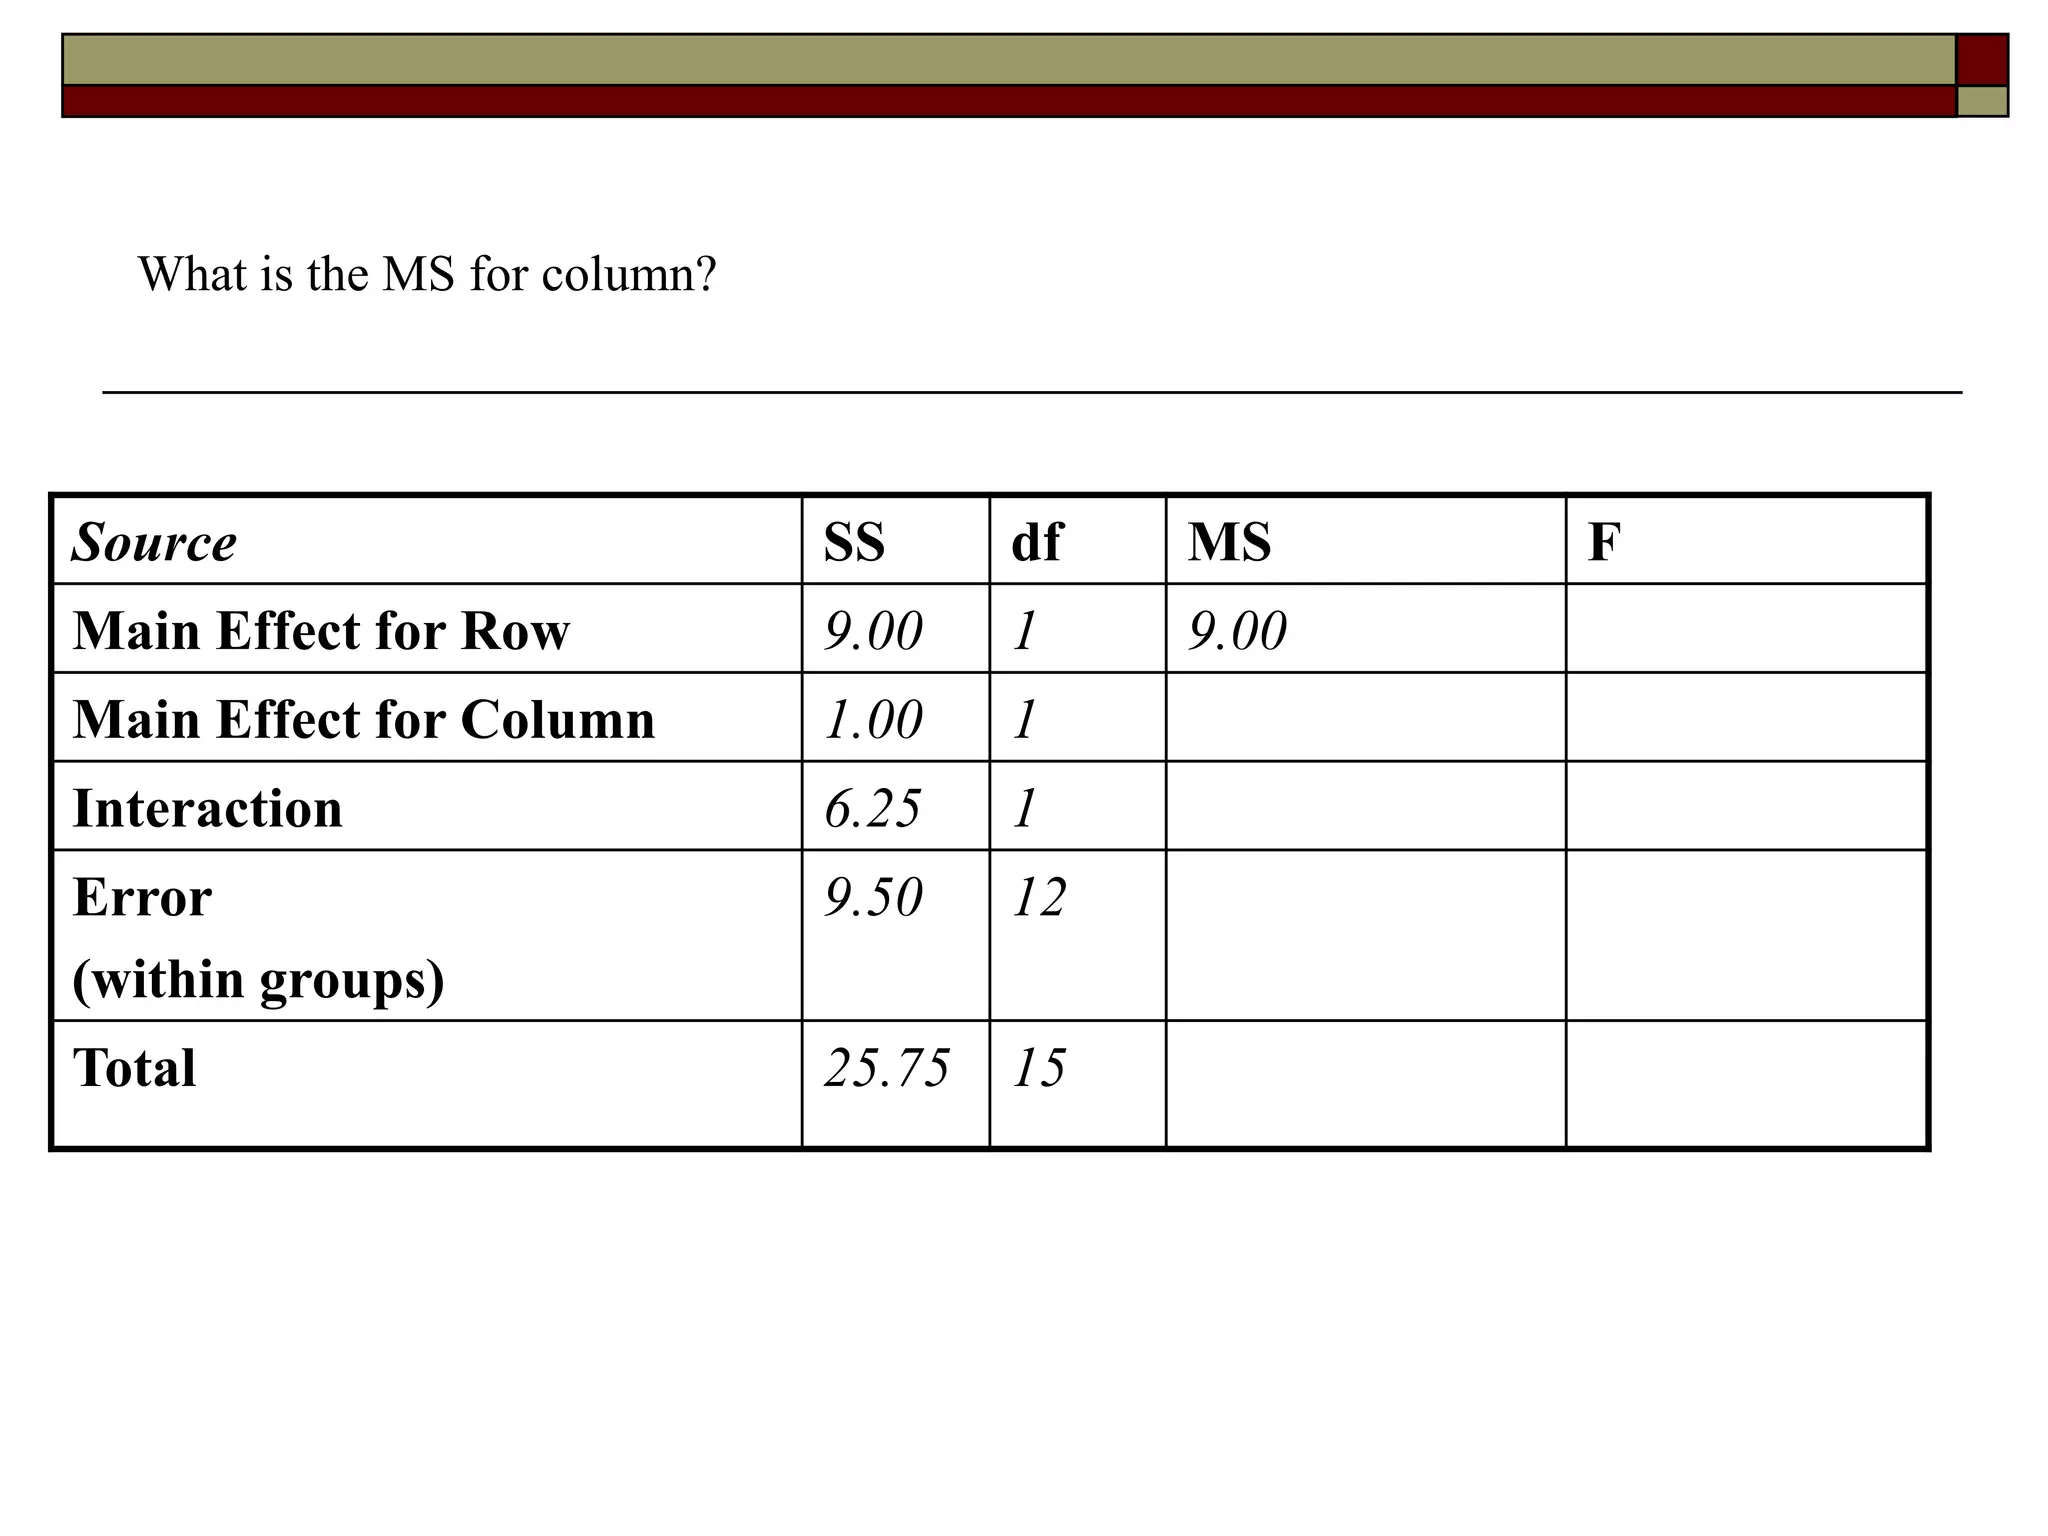
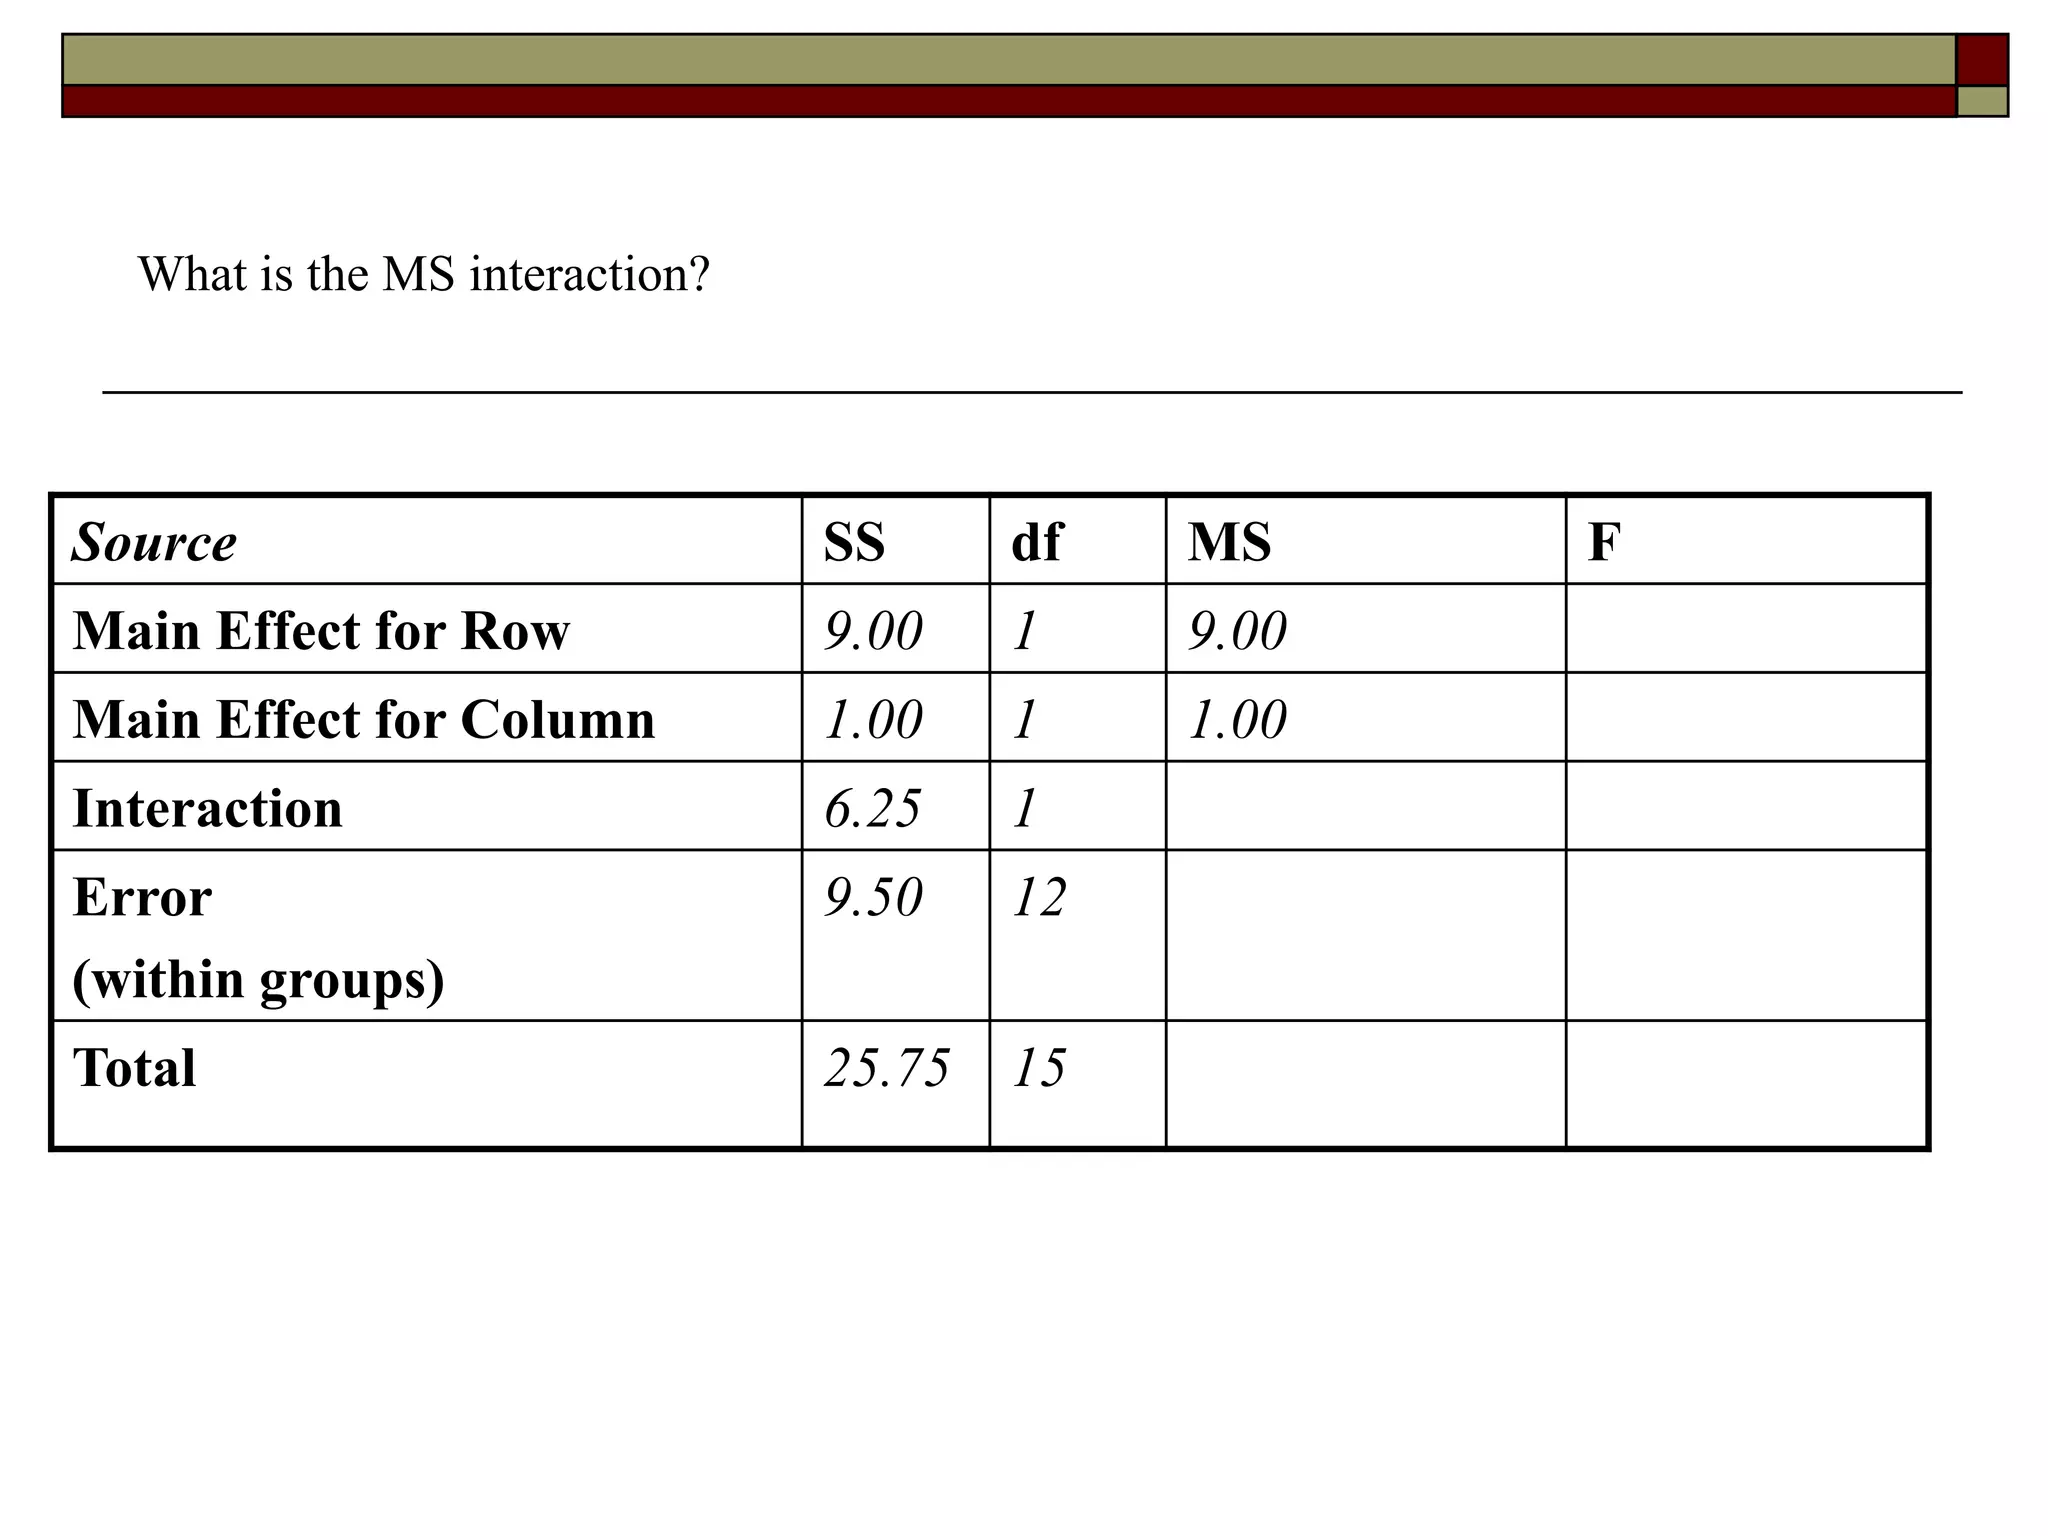
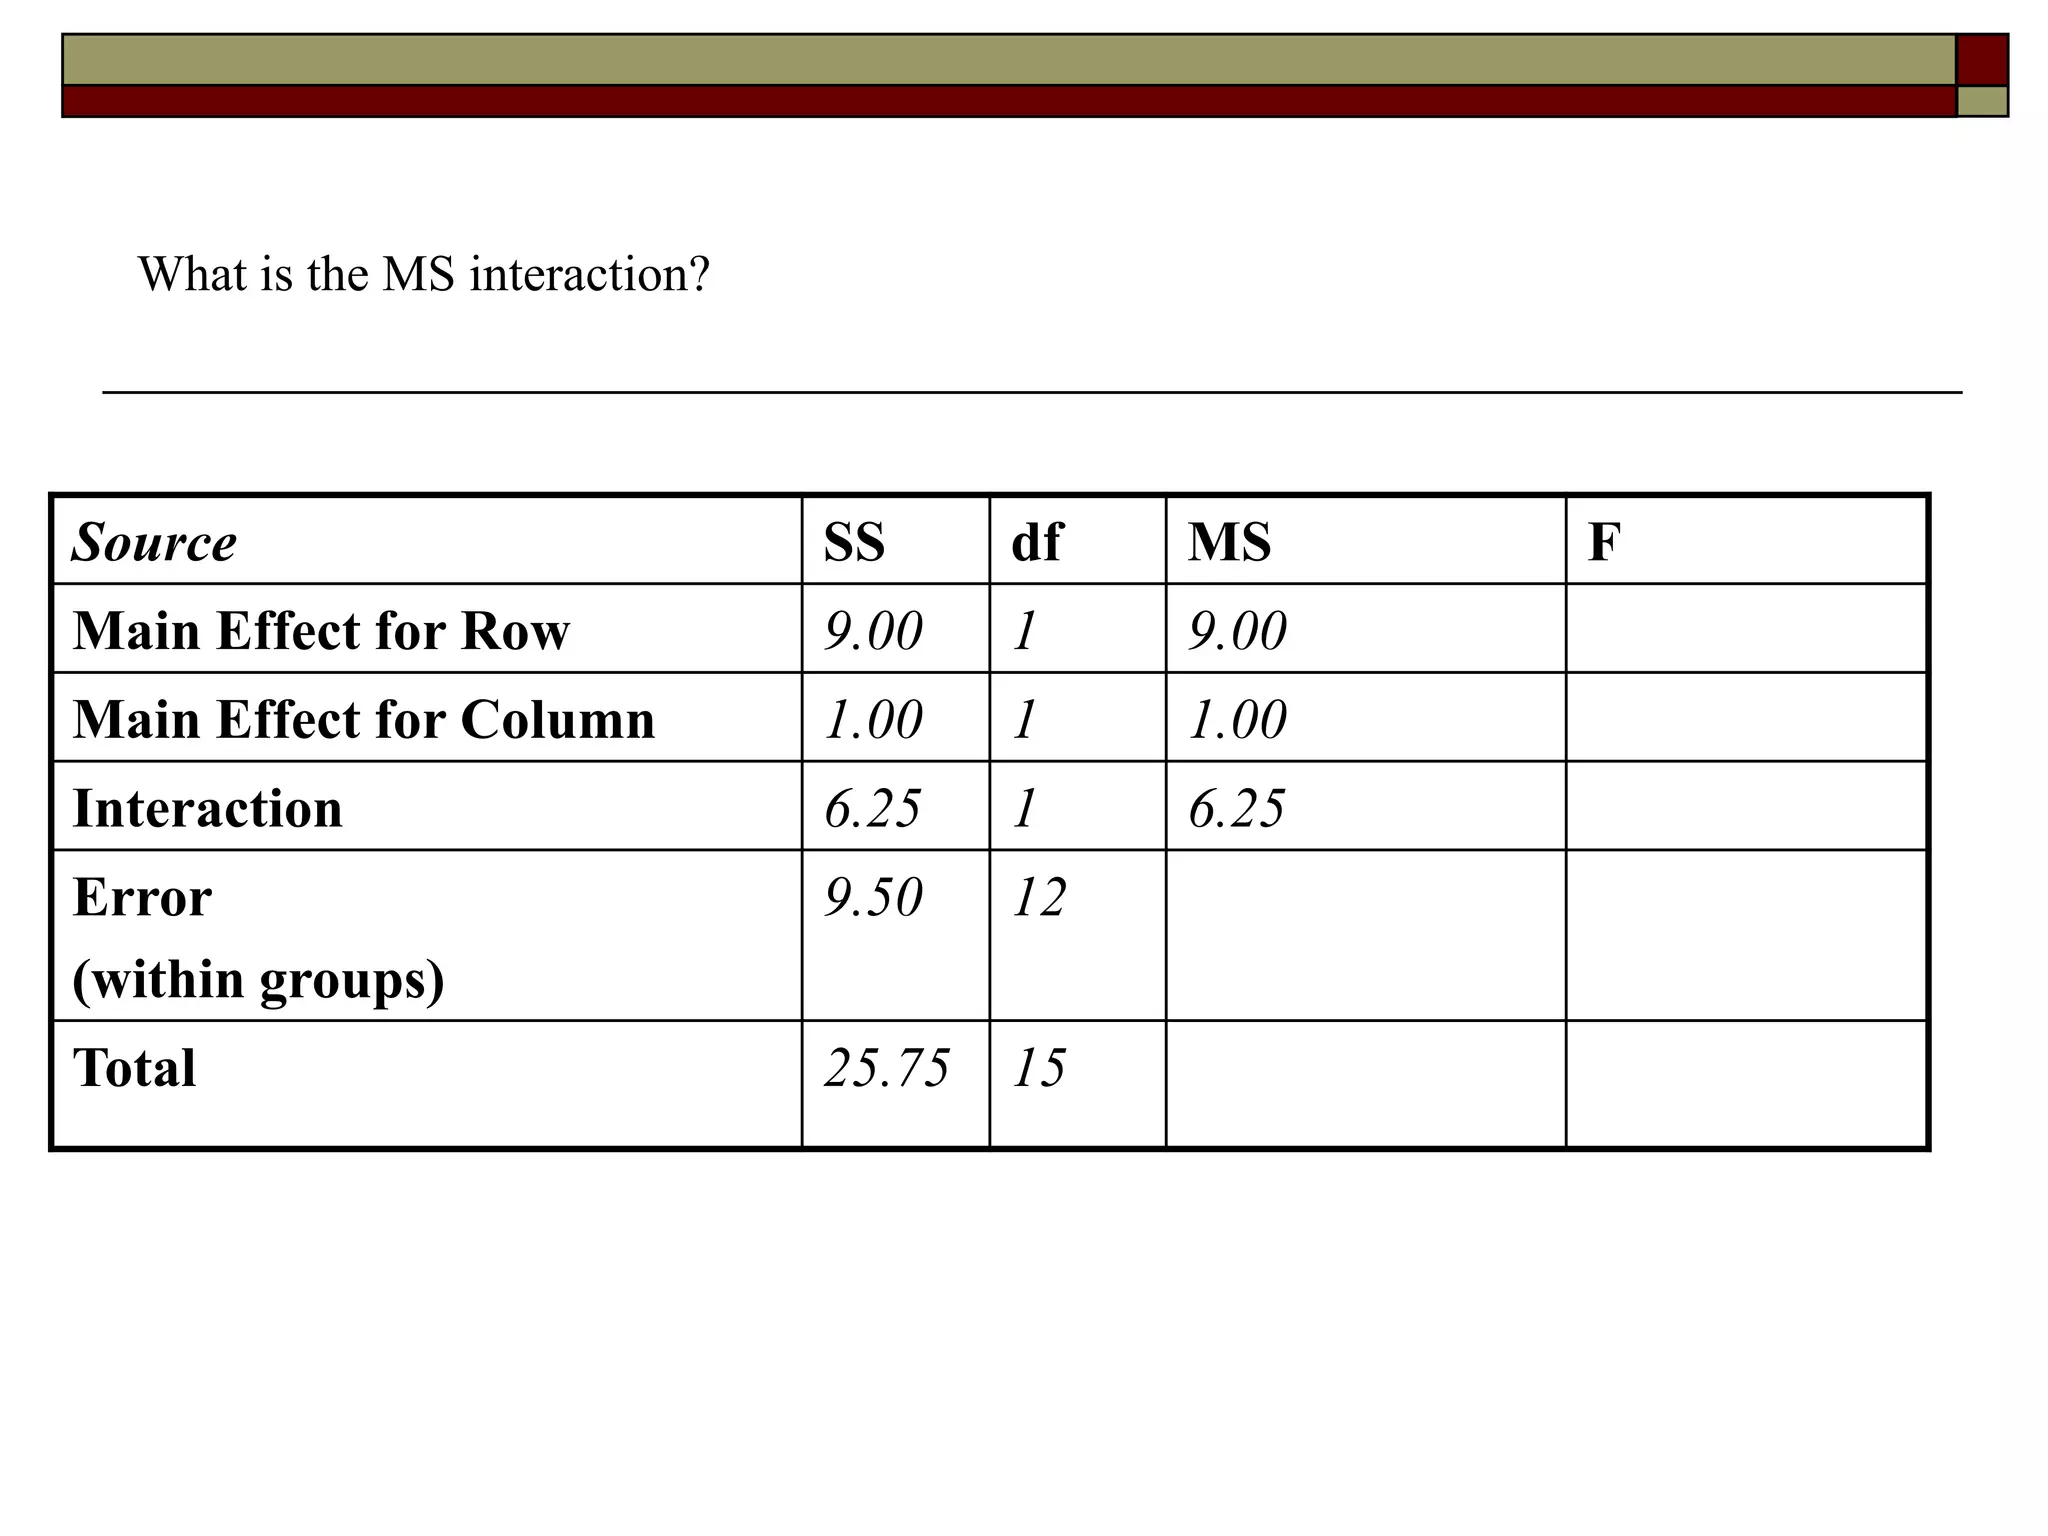
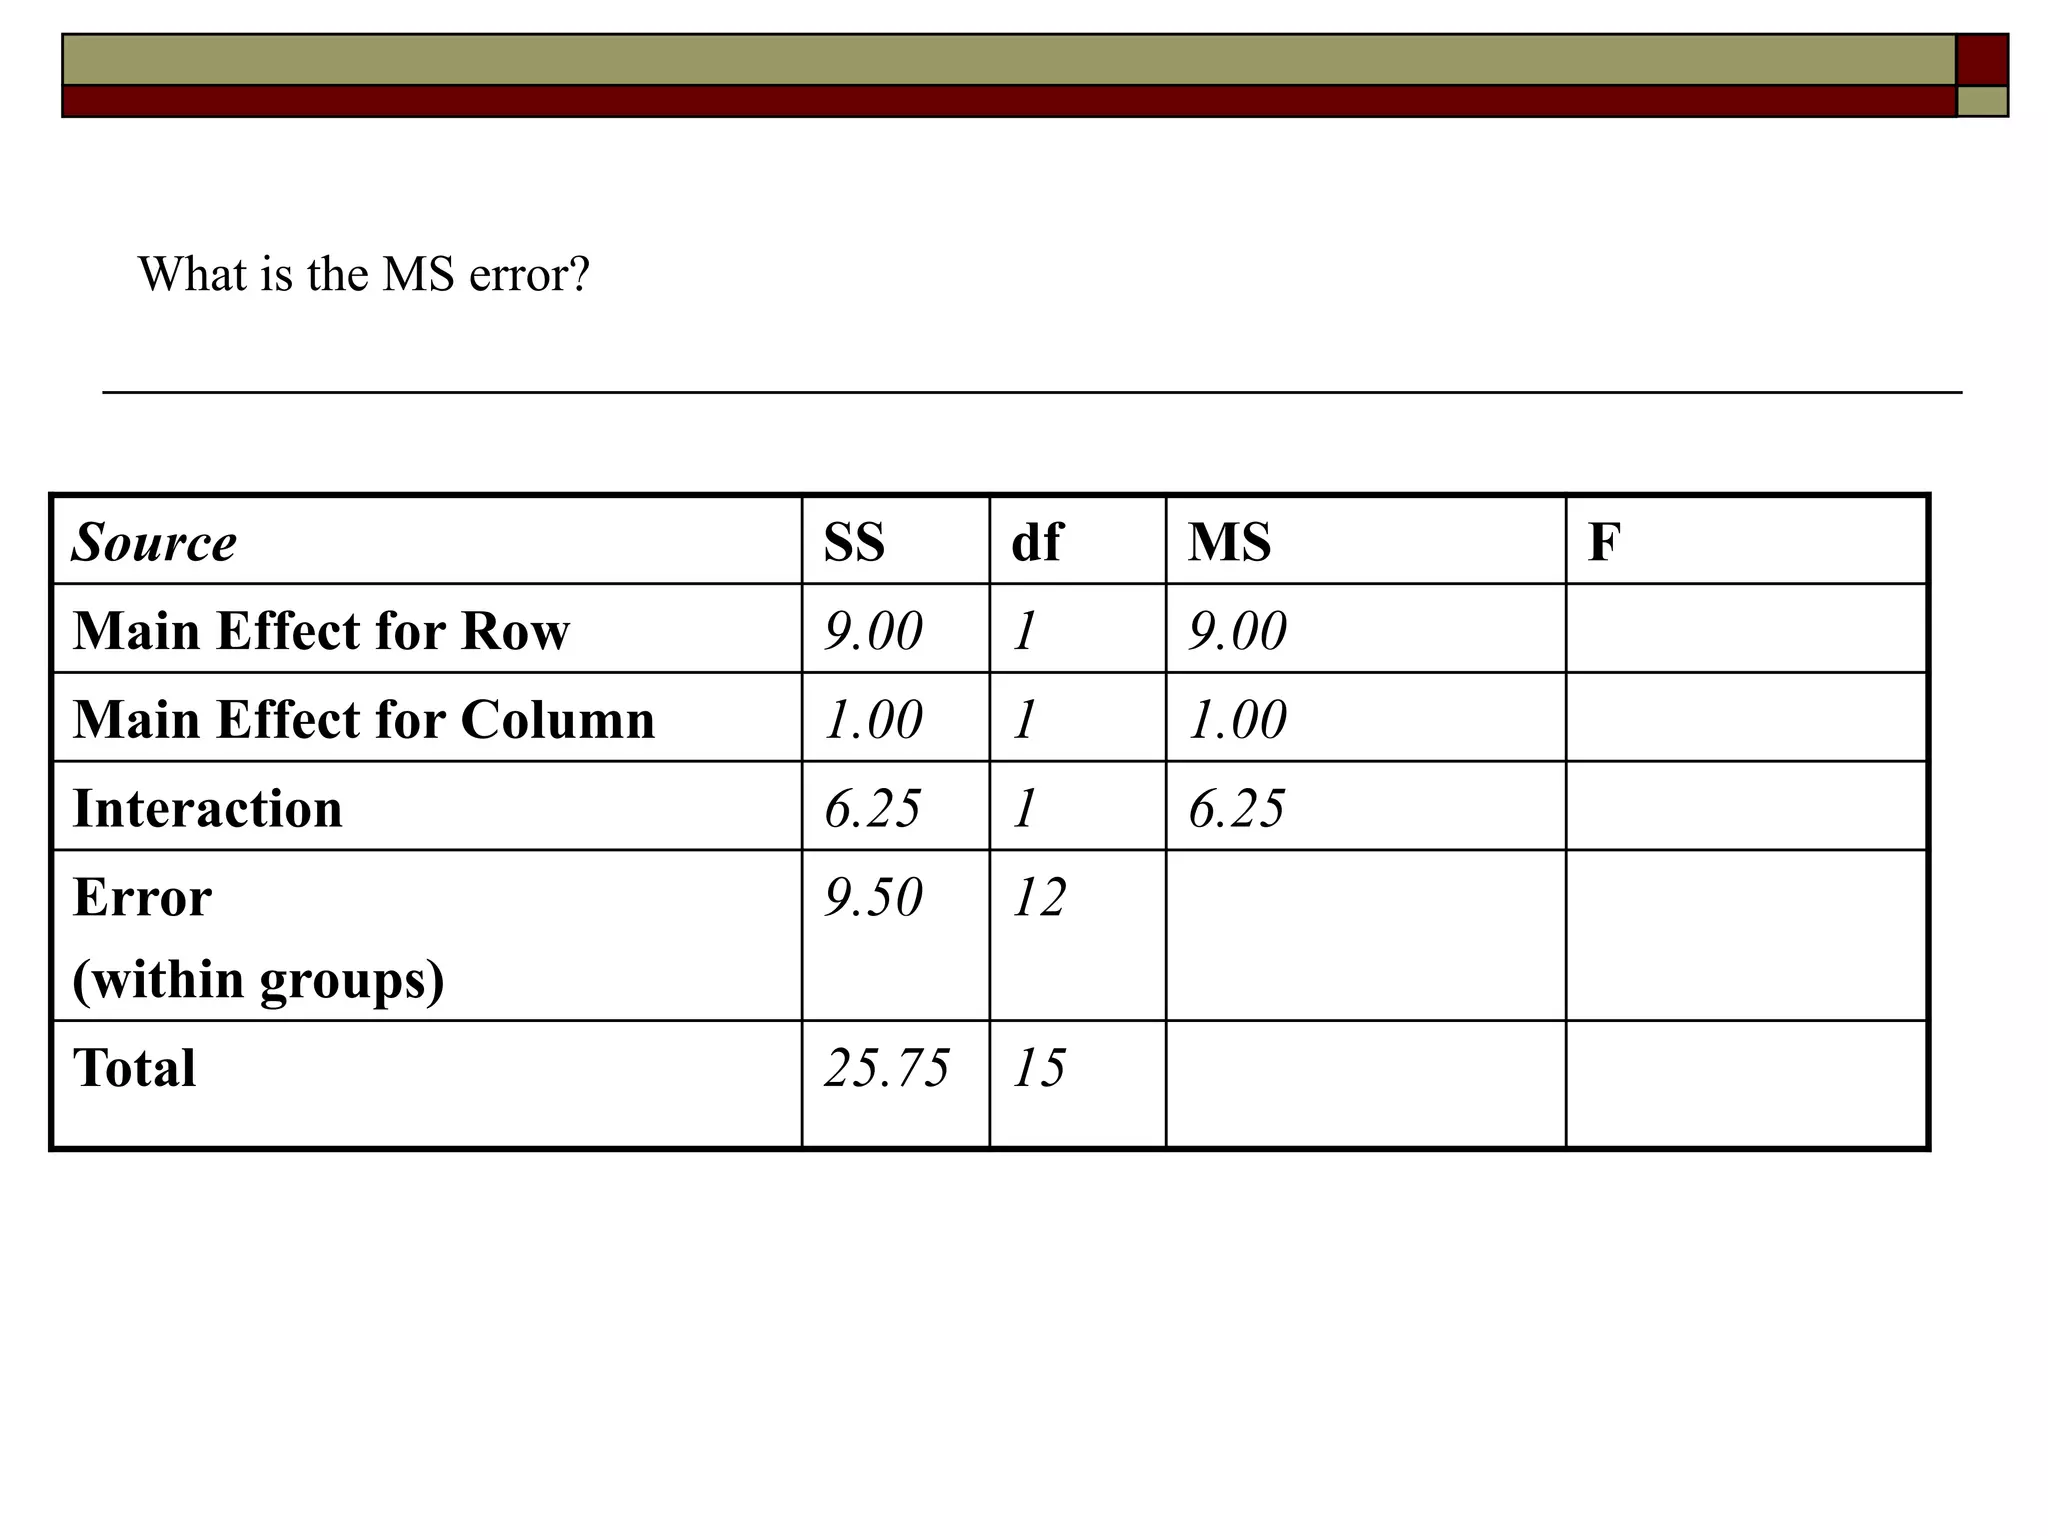
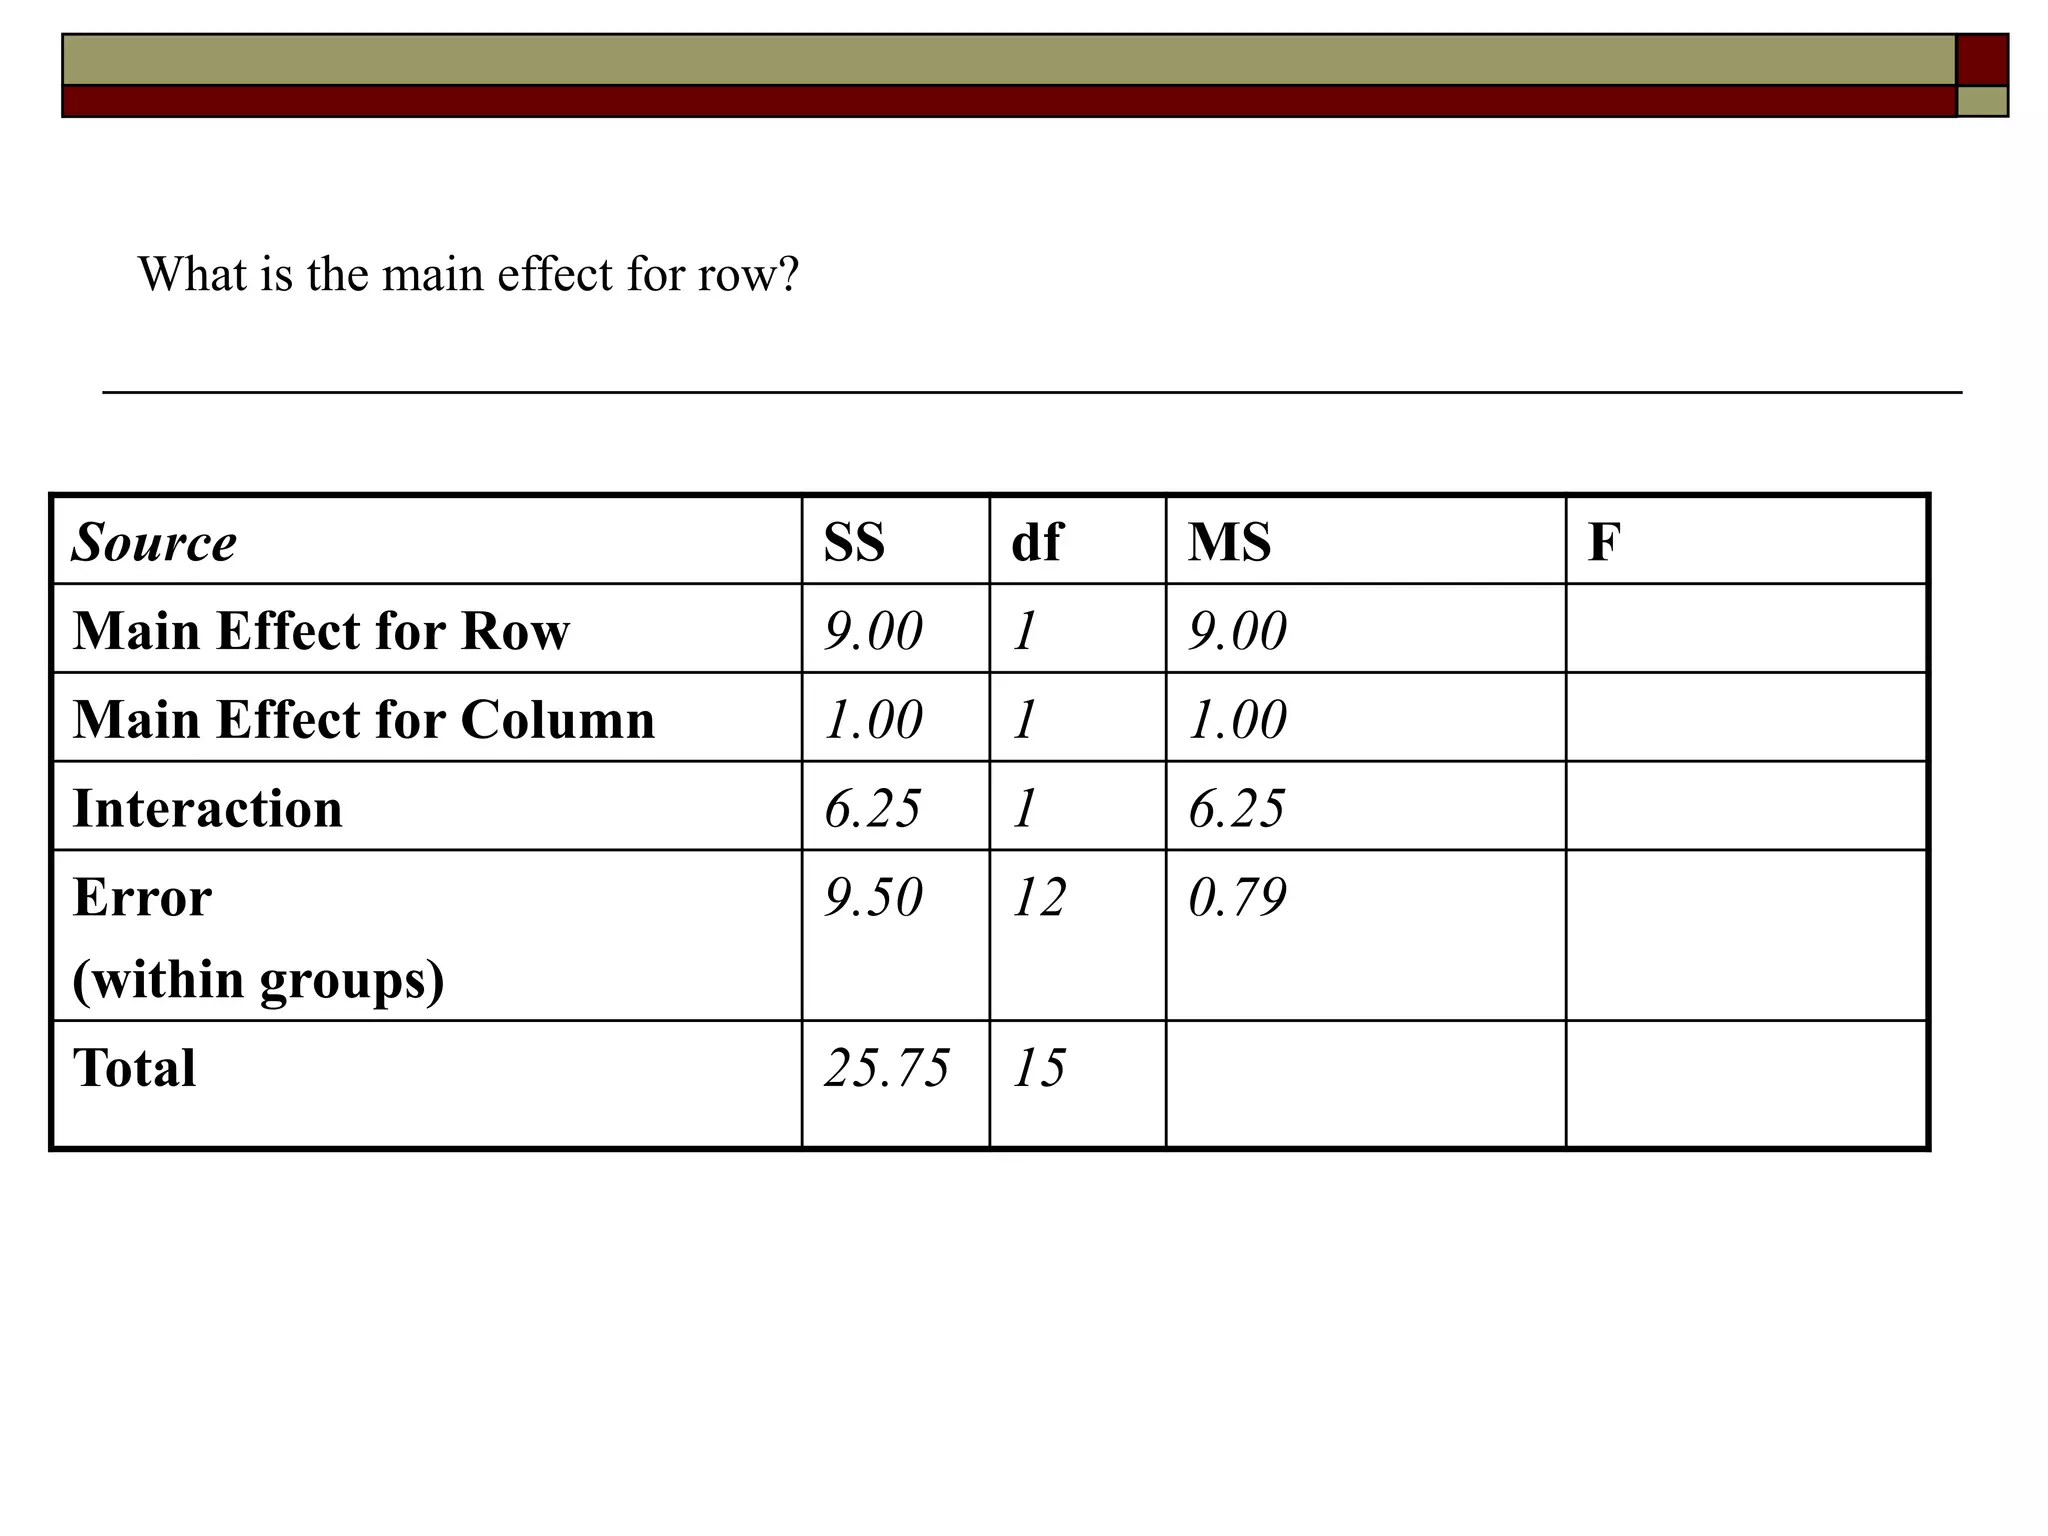
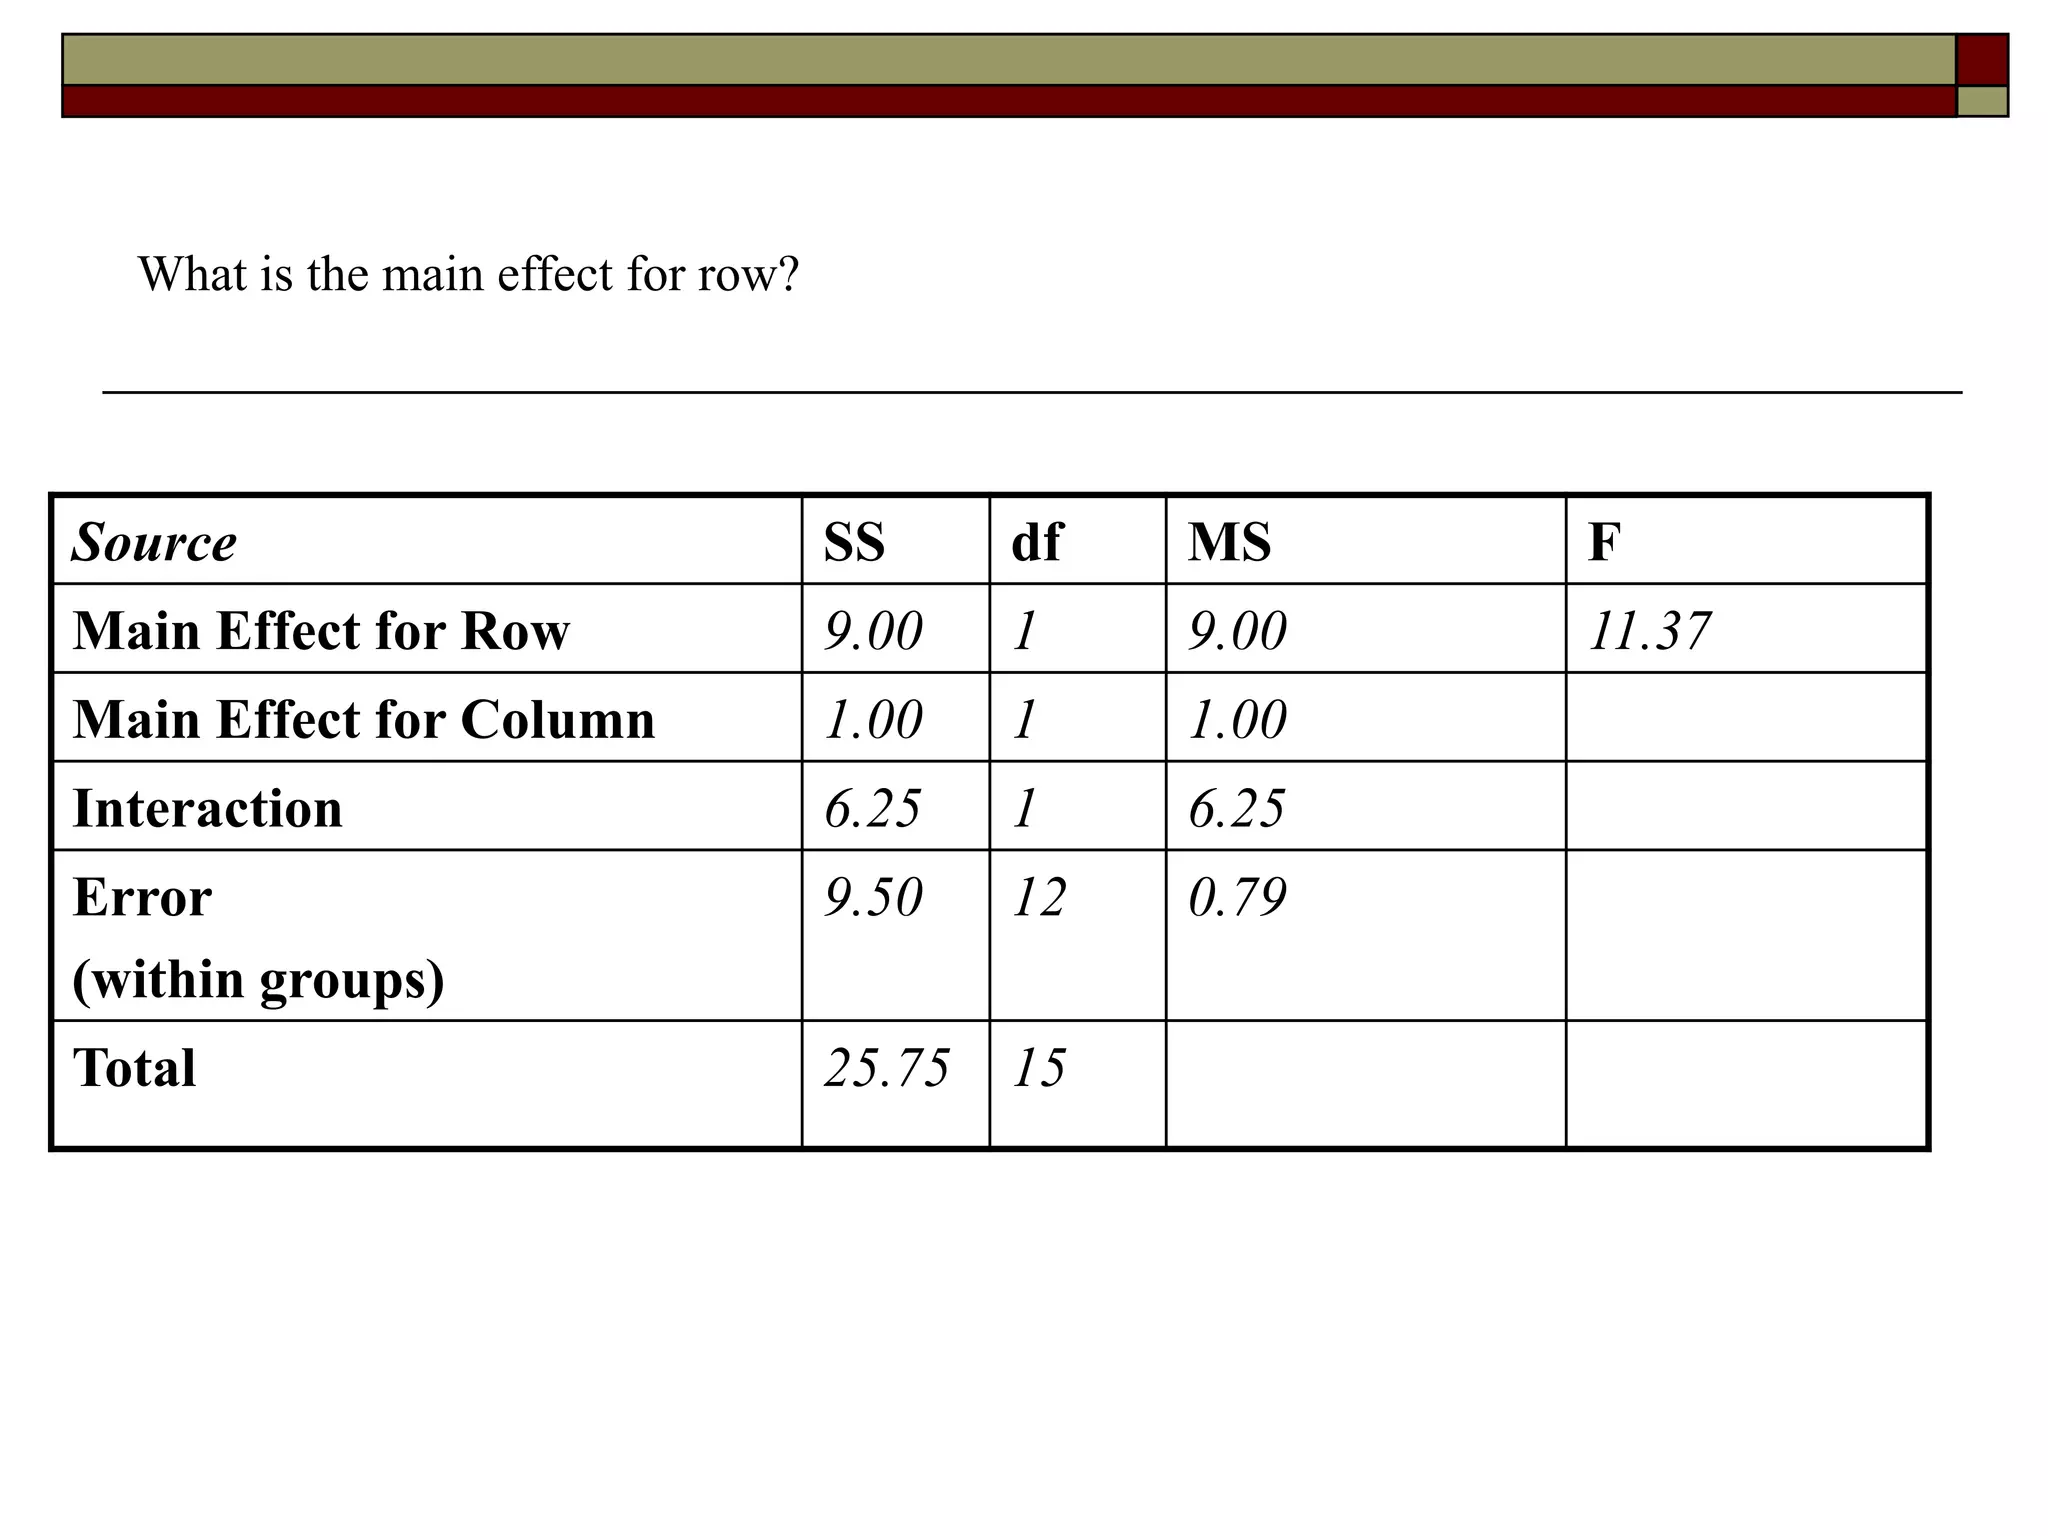
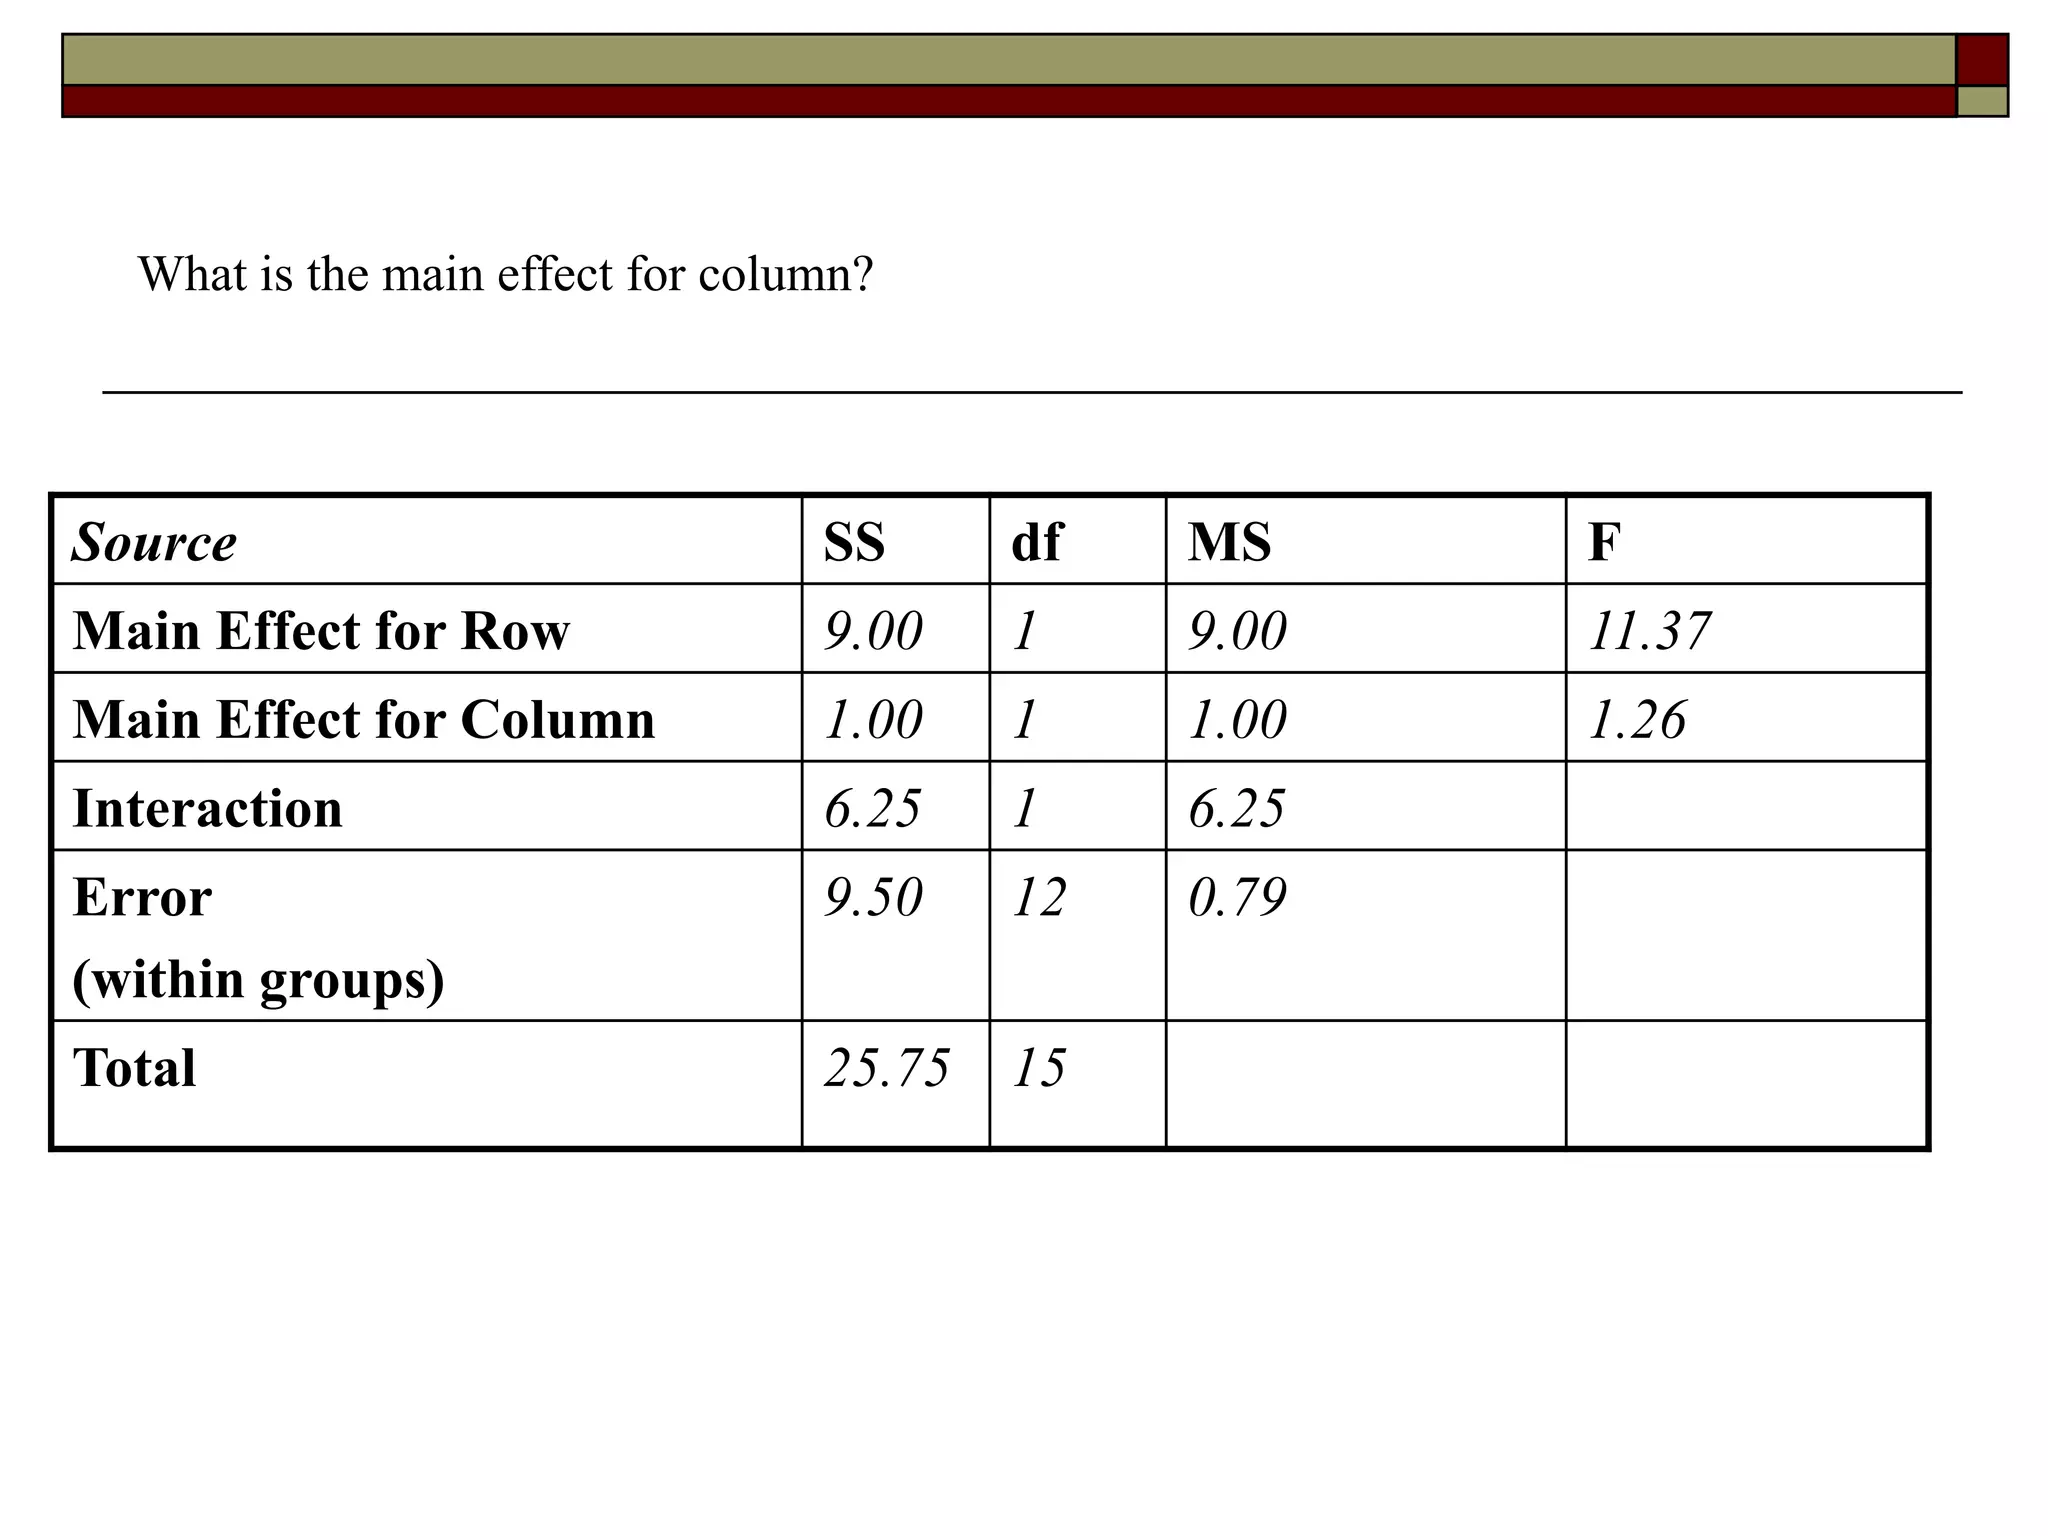
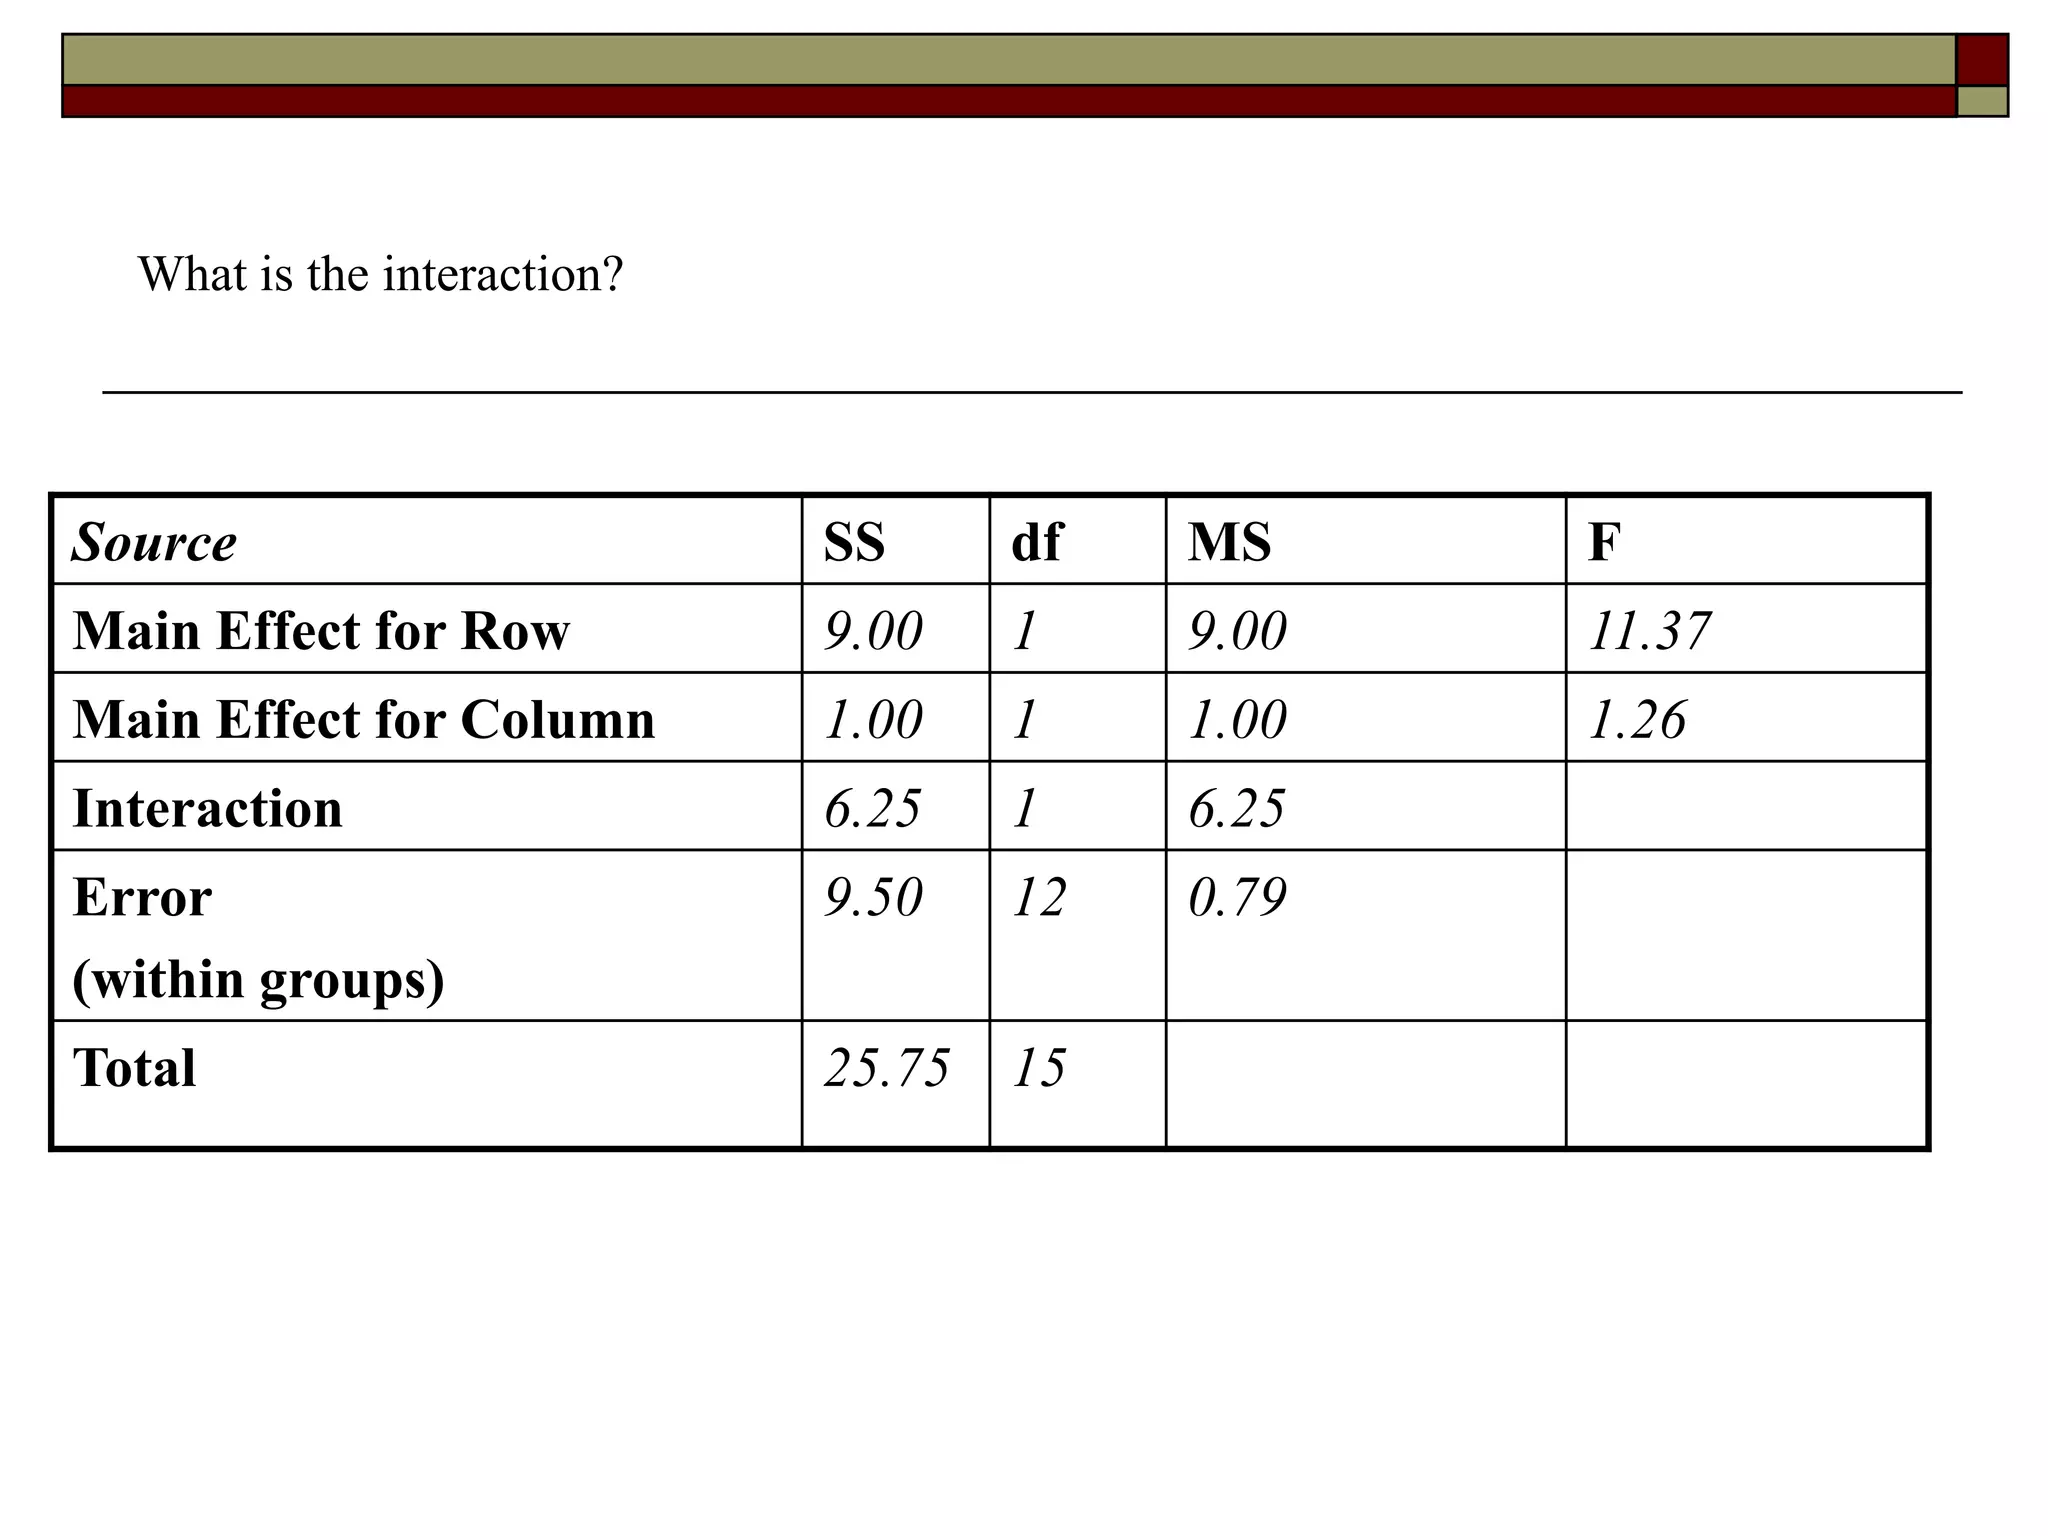
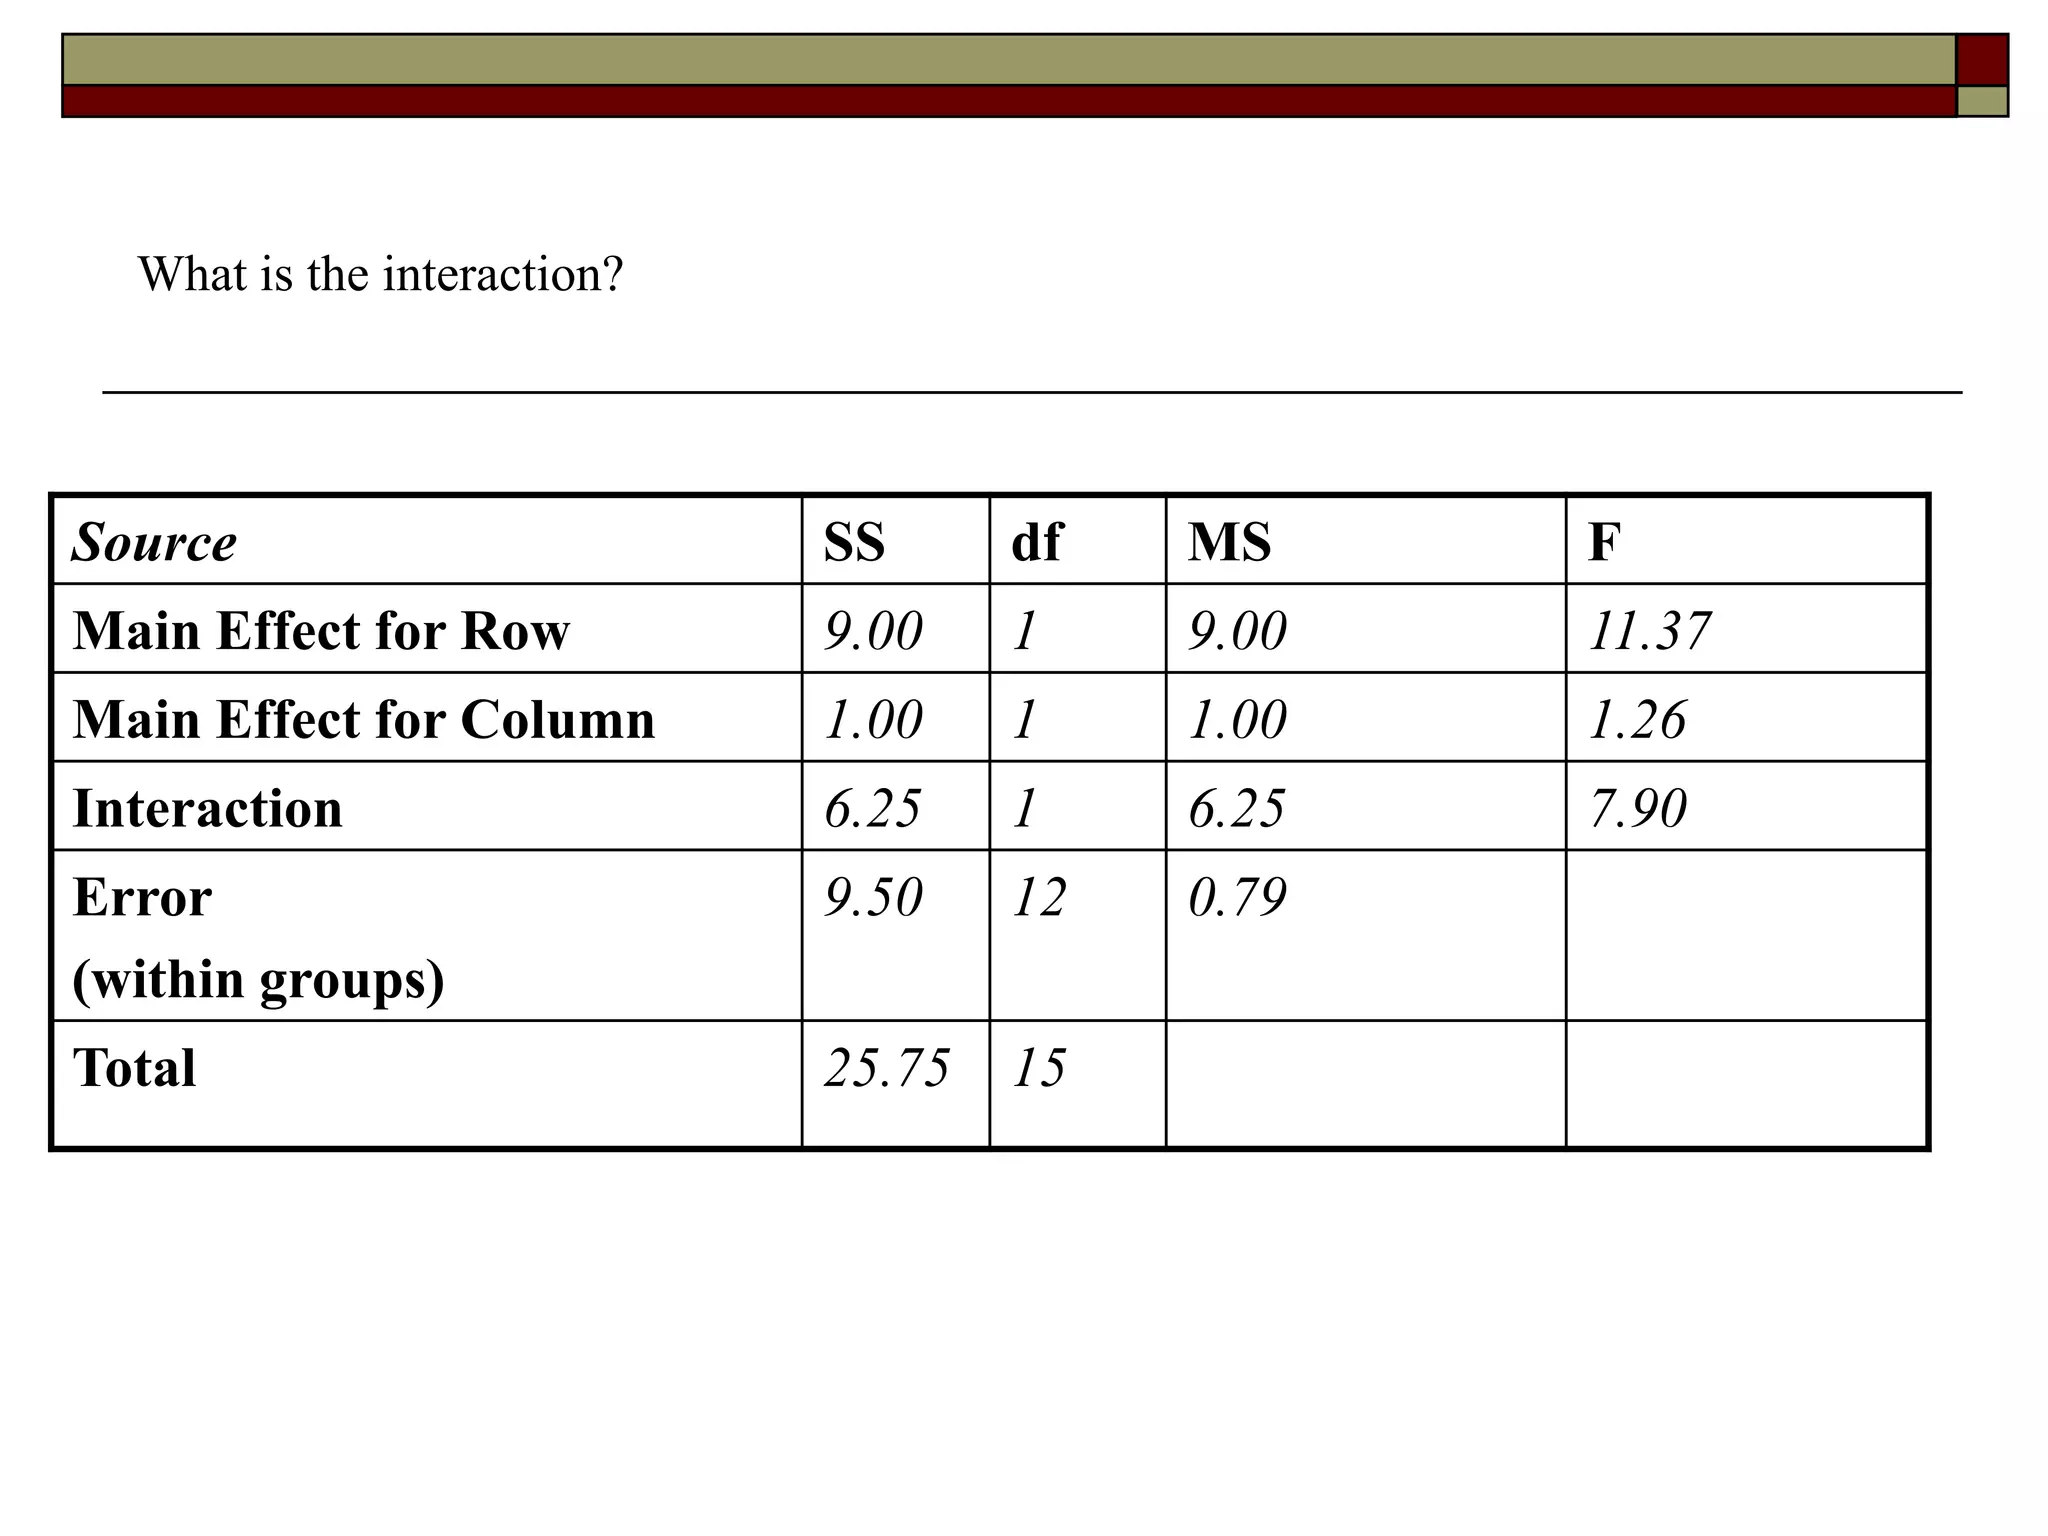
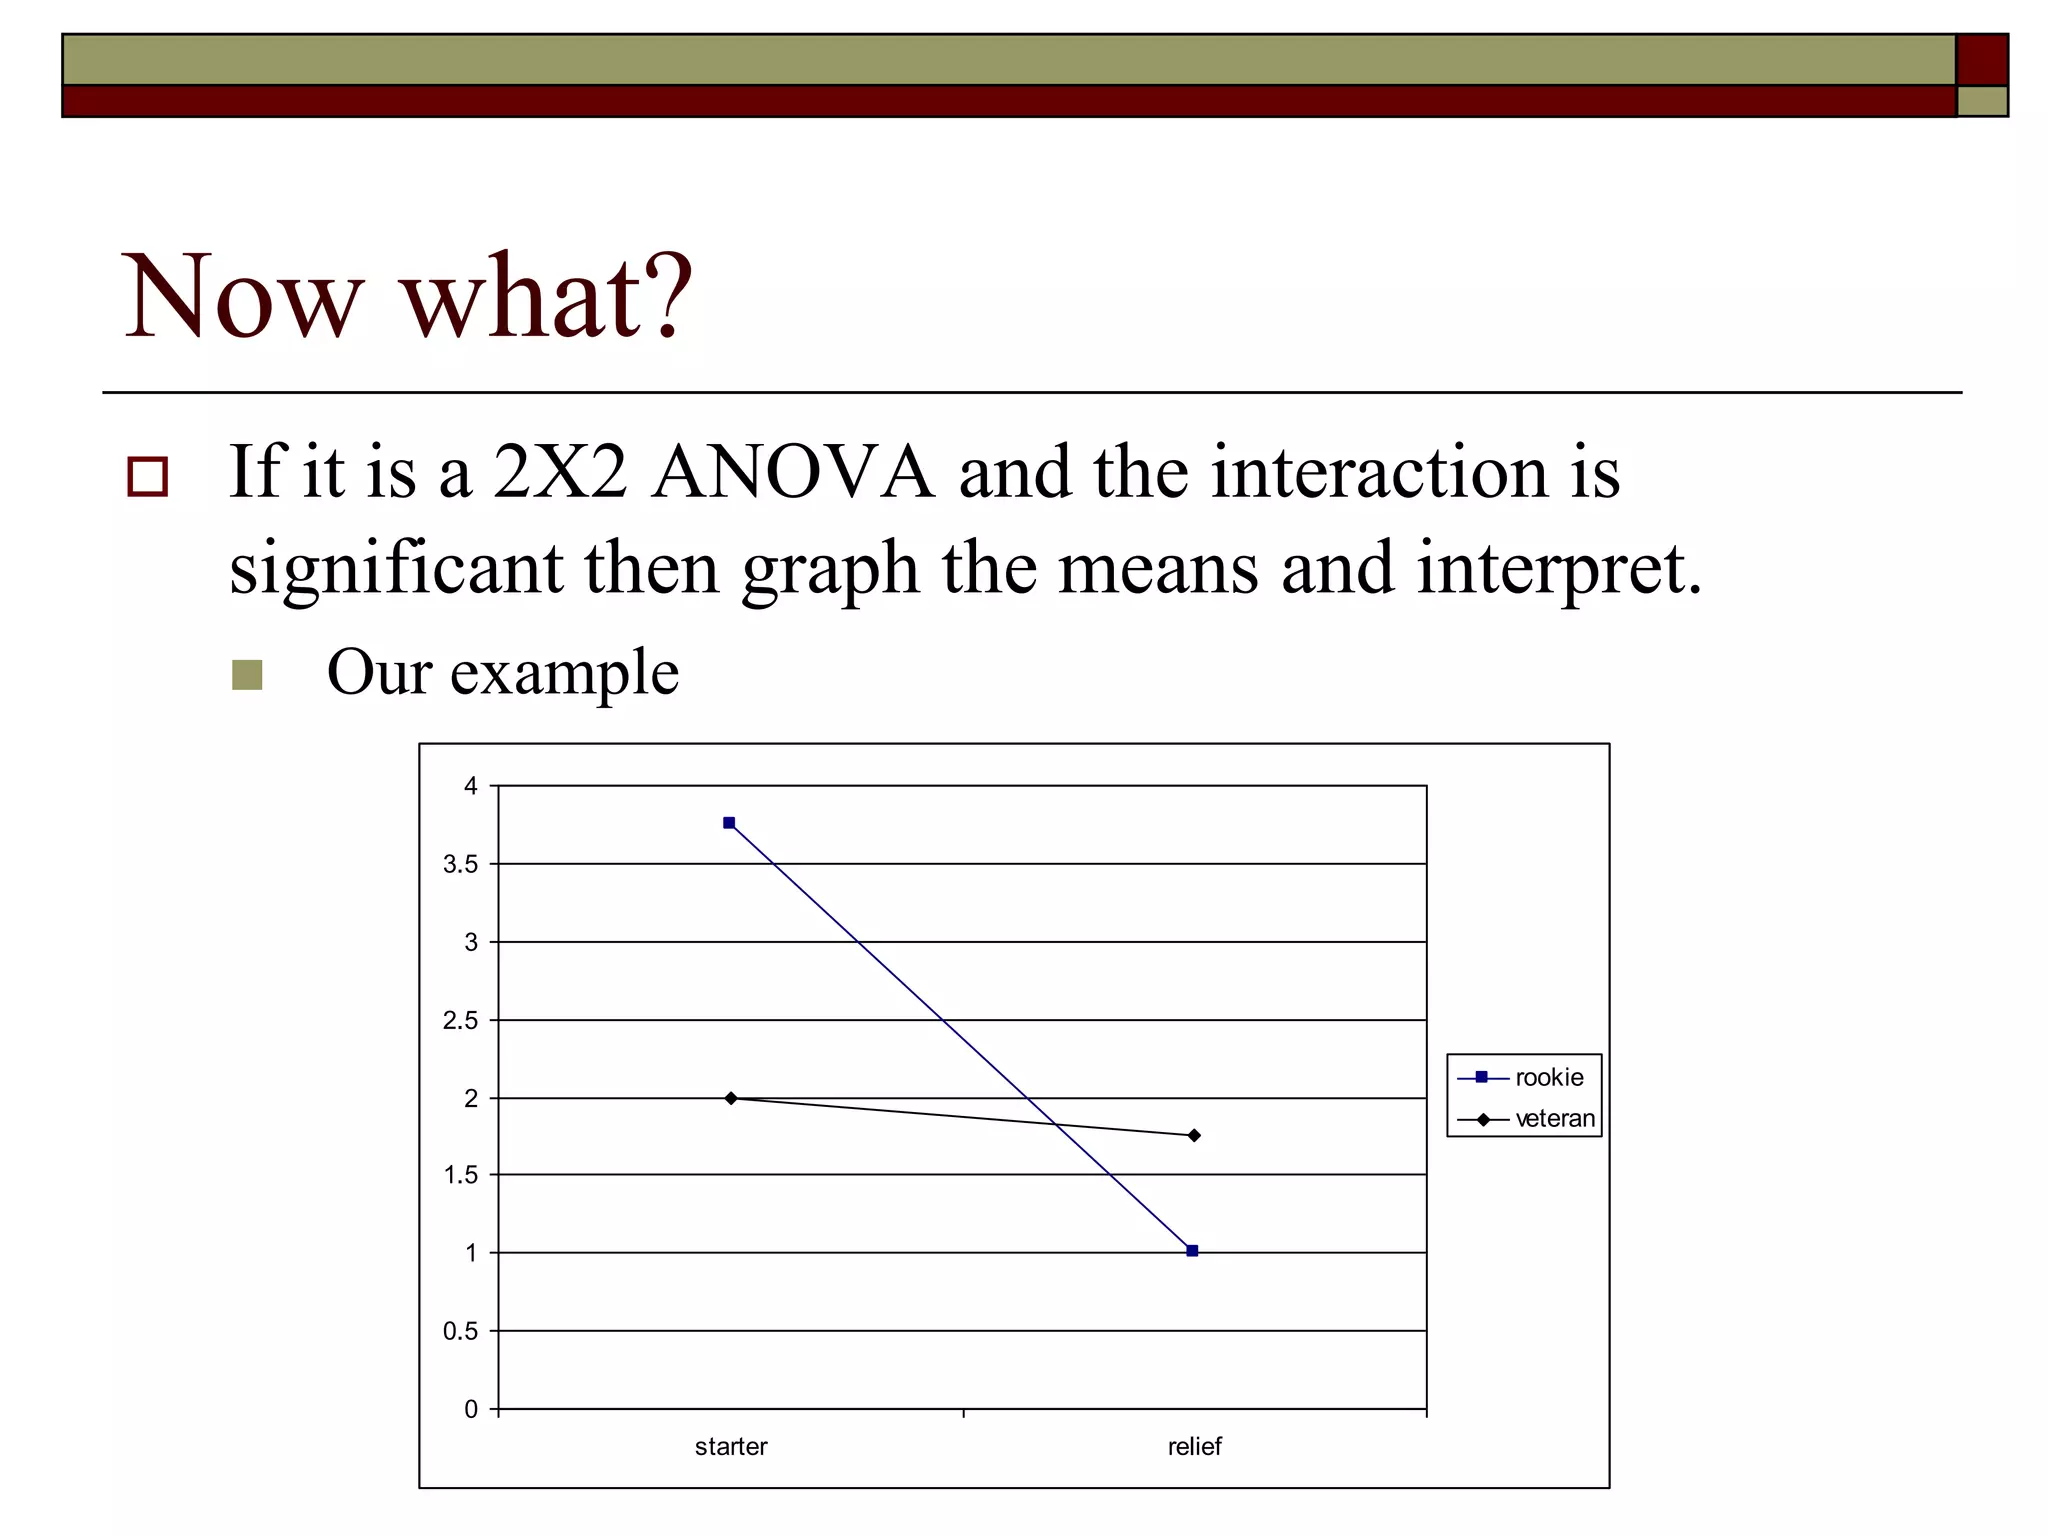
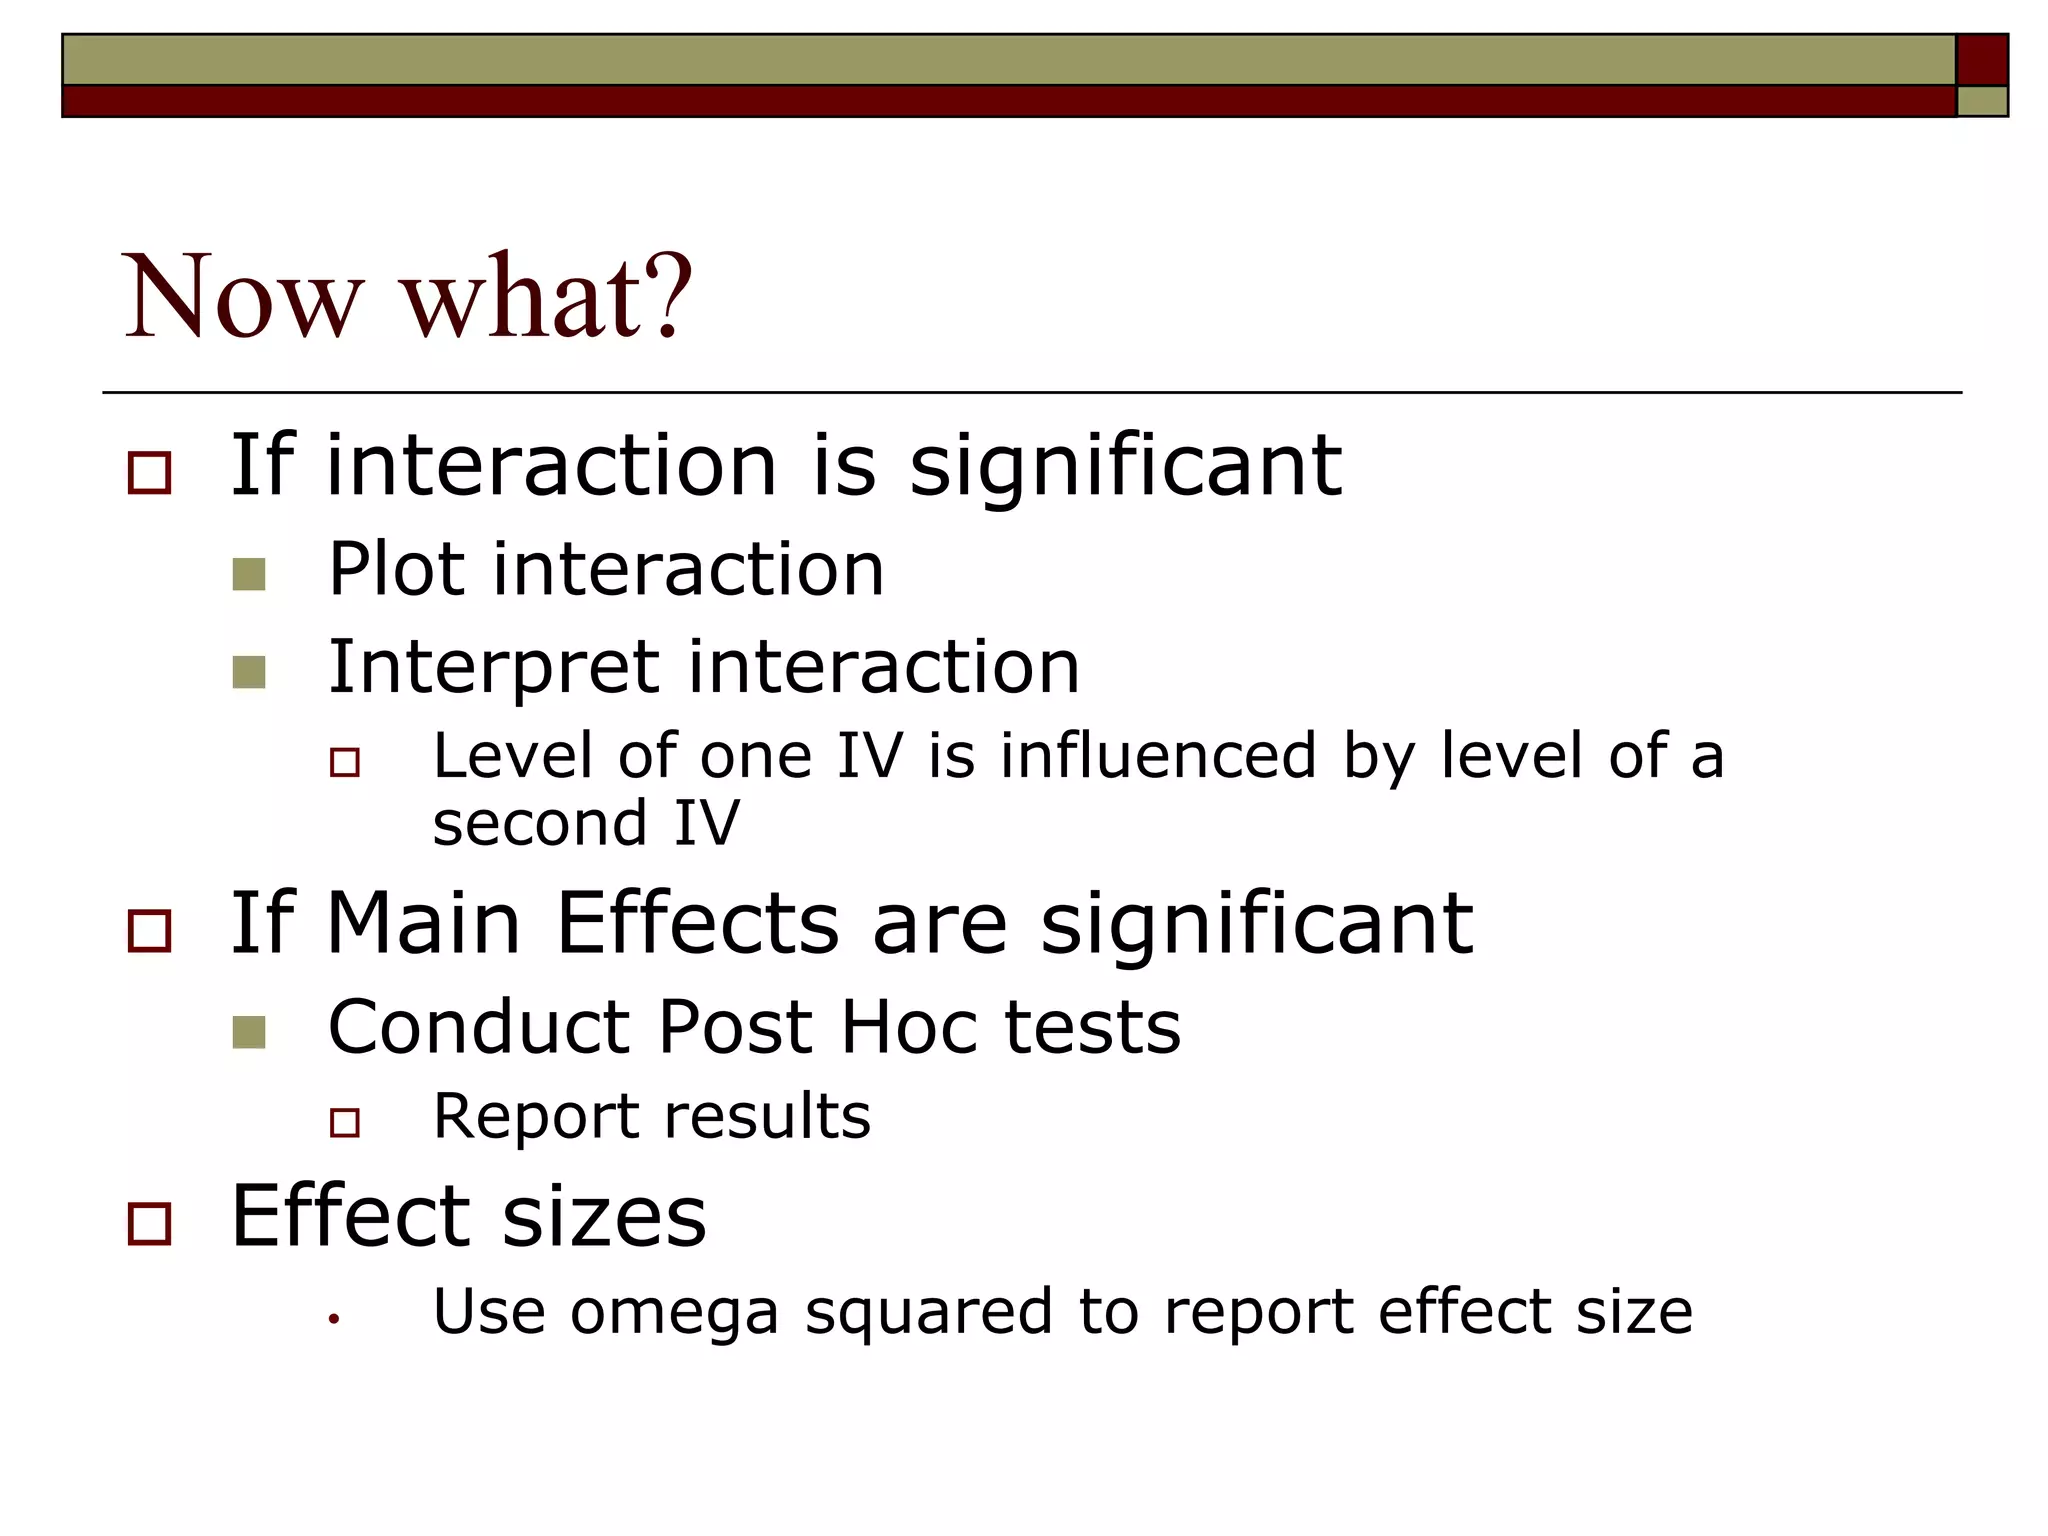
2. Two-way ANOVA
Two-way ANOVA is one type of Factorial
ANOVA.
Factorial ANOVAs are designs with two or
more between-subjects independent variables
If there are within-subjects IVs, then they are
often called Mixed ANOVAs
3. Two-way ANOVA
Grouping factors (IVs)
Example
IV: experience with three levels - rookie, novice, and veteran
IV: pitcher type with two levels - starter and relief
DV: physical stamina
3 X 2 factorial design
Computes a separate F ratio for each independent variable
(called main effects) and the interaction between the variables
F for experience
F for pitcher type
F for experience*pitch interaction
4. Example: 3 X 2 Factorial Design
Group 1 Group 2
Group 3 Group 4
Starter Relief
Group 5 Group 6
rookie
novice
veteran
Experience
Level
Pitcher Type
5. Practice
A 3 X 3 design
How many independent variables?
1. 1
2. 2
3. 3
4. 4
6. Practice
A 3 X 3 design
How many levels of the first independent
variable listed?
1. 1
2. 2
3. 3
4. 4
7. Practice
A 3 X 3 design
How many conditions?
1. 2
2. 3
3. 6
4. 9
8. Practice
A researcher tests male and female doctors
for manual dexterity . She tests dexterity for
different tools: scalpel, scissors, scope, and
probe.
How many independent variables?
1. 1
2. 2
3. 3
4. 4
9. Practice
A researcher tests male and female doctors for
manual dexterity . She tests dexterity for different
tools: scalpel, scissors, scope, and probe.
How many levels of the second independent variable
(tools)?
1. 1
2. 2
3. 3
4. 4
10. Practice
A researcher tests male and female doctors
for manual dexterity . She tests dexterity for
different tools: scalpel, scissors, scope, and
probe.
How many conditions?
1. 2
2. 4
3. 6
4. 8
11. Practice
You are studying factors that are associated with problem-
solving skills. You place subjects into groups according to the
following: student involvement with extracurricular activities
(involved vs. not involved), student university type (public
vs. private), and student self-reported procrastination (high,
medium, and low). You then test the students’ problem-
solving ability with a test.
What is the design?
1. 1 X 2 X 2 X 3
2. 2 X 2 X 3
3. 3 X 2 X 6
4. 4 X 3
12. Practice
You are studying factors that are associated with problem-
solving skills. You place subjects into groups according to the
following: student involvement with extracurricular activities
(involved vs. not involved), student university type (public
vs. private), and student self-reported procrastination (high,
medium, and low). You then test the students’ problem-
solving ability with a test.
How many independent variables?
1. 1
2. 2
3. 3
4. 4
13. Practice
You are studying factors that are associated with problem-
solving skills. You place subjects into groups according to the
following: student involvement with extracurricular activities
(involved vs. not involved), student university type (public
vs. private), and student self-reported procrastination (high,
medium, and low). You then test the students’ problem-
solving ability with a test.
How many cells?
1. 3
2. 8
3. 12
4. 24
14. Two-way ANOVA
Main Effects
Think of them as one-way ANOVAs for each
independent variable.
If you have 2 IVs, then you have two possible
main effects
Example
A main effect for experience would look at the
three levels ignoring (collapsed across) pitcher type
A main effect for pitcher type looks at starters vs.
relief pitchers regardless of (collapsed across)
experience
15. Group 1 Group 2
Group 3 Group 4
Starter Relief
Group 5 Group 6
rookie
novice
veteran
Experience
Level
Pitcher Type
Marginal Mean
For Rookie
Marginal Mean
For Novice
Marginal Mean
For Veteran
Marginal Mean
For Starter
Marginal Mean
For Relief
16. Two-way ANOVA
Interaction
For a two-way ANOVA there is one possible interaction
Interactions occur if the effects of one IV are different
under different levels of the other IV
Example
Something about being an expert makes you behave differently if
you are a starter as opposed to being a relief pitcher.
As the number of factors increases, the number of
possible interaction increases
17. Practice
You are studying factors that are associated with problem-
solving skills. You place subjects into groups according to the
following: student involvement with extracurricular activities
(involved vs. not involved), student university type (public
vs. private), and student self-reported procrastination (high,
medium, and low). You then test the students’ problem-
solving ability with a test.
How many main effects are possible?
1. 1
2. 2
3. 3
4. 4
18. Practice
You are studying factors that are associated with problem-
solving skills. You place subjects into groups according to the
following: student involvement with extracurricular activities
(involved vs. not involved), student university type (public
vs. private), and student self-reported procrastination (high,
medium, and low). You then test the students’ problem-
solving ability with a test.
How many interactions are possible?
1. 1
2. 2
3. 3
4. 4
19. Two-way ANOVA
Identifying main effects and interactions
First test for significance (will discuss how that is done
later)
Then use either table or graph to see the relationship that
exists between variables
For instructional purposes we will assume the tests for
significance have been done and that the main effects and
interactions identified are significant
Remember if not significant than no exploration of that
particular main effect or interaction.
20. Group 1 Group 2
Group 3 Group 4
Starter Relief
rookie
veteranExperience
Level
Pitcher Type
Marginal Mean
For Rookie
Marginal Mean
For Veteran
Marginal Mean
For Starter
Marginal Mean
For Relief
21. No Main Effects or Interaction
20 20
Starter Relief
rookie
veteran
20
20 20 20
20 20
0
5
10
15
20
25
rookie veteran
starter
relief
25. Interaction with No Main Effects
20 10
Starter Relief
rookie
veteran
15
10 20 15
15 15
0
5
10
15
20
25
rookie veteran
starter
relief
26. Interaction and Main Effect for
Experience
20 15
Starter Relief
rookie
veteran
17.5
10 15 12.5
15 15
0
5
10
15
20
25
rookie veteran
starter
relief
27. Interaction and Main Effect for
Pitcher Type
20 10
Starter Relief
rookie
veteran
15
15 15 15
17.5 12.5
0
5
10
15
20
25
rookie veteran
starter
relief
28. Interaction and Two Main Effects
9 11
Starter Relief
rookie
veteran
10
28 12 20
16 14
0
5
10
15
20
25
30
rookie veteran
starter
relief
29. Assumptions of Between
Factor ANOVAs
DV data are interval or ratio level
Data are normally distributed
Variances are equivalent
(homogeneity of variance)
Independence of observations
Same statistical ratio
ANOVA =
Treatment Variance
Error Variance
30. Stating Hypotheses
Two levels of hypotheses
Main effects
Hypothesis for each IV
Hypothesis for Main Effect A (also sometimes called
Main Effect Row)
Ho: μ1 = μ2 …
Ha: not all of the μi are equal.
Hypothesis for Main Effect B (also sometimes called
Main Effect Column)
Ho: μ1 = μ2 …
Ha: not all of the μi are equal.
31. Stating Hypotheses
Hypothesis for Interaction (sometimes written
A*B or Row*Column)
Hypothesis for each combination of IVs
Ho: There is no interaction between factors A and
B. All differences are explained by main effects.
Ha: There is an interaction. The mean difference
between treatments are not what would be
predicted from main effects only
35. What are the Total df?
Source SS df MS F
Main Effect for Row 9.00
Main Effect for Column 1.00
Interaction 6.25
Error
(within groups)
9.50
Total 25.75
36. What are the Total df?
Source SS df MS F
Main Effect for Row 9.00
Main Effect for Column 1.00
Interaction 6.25
Error
(within groups)
9.50
Total 25.75 15
37. What are the df row?
Source SS df MS F
Main Effect for Row 9.00
Main Effect for Column 1.00
Interaction 6.25
Error
(within groups)
9.50
Total 25.75 15
38. What are the df row?
Source SS df MS F
Main Effect for Row 9.00 1
Main Effect for Column 1.00
Interaction 6.25
Error
(within groups)
9.50
Total 25.75 15
39. What are the df column?
Source SS df MS F
Main Effect for Row 9.00 1
Main Effect for Column 1.00
Interaction 6.25
Error
(within groups)
9.50
Total 25.75 15
40. What are the df column?
Source SS df MS F
Main Effect for Row 9.00 1
Main Effect for Column 1.00 1
Interaction 6.25
Error
(within groups)
9.50
Total 25.75 15
41. What are the df interaction?
Source SS df MS F
Main Effect for Row 9.00 1
Main Effect for Column 1.00 1
Interaction 6.25
Error
(within groups)
9.50
Total 25.75 15
42. What are the df interaction?
Source SS df MS F
Main Effect for Row 9.00 1
Main Effect for Column 1.00 1
Interaction 6.25 1
Error
(within groups)
9.50
Total 25.75 15
43. What are the df error?
Source SS df MS F
Main Effect for Row 9.00 1
Main Effect for Column 1.00 1
Interaction 6.25 1
Error
(within groups)
9.50
Total 25.75 15
44. What are the df error?
Source SS df MS F
Main Effect for Row 9.00 1
Main Effect for Column 1.00 1
Interaction 6.25 1
Error
(within groups)
9.50 12
Total 25.75 15
45. What is the MS for row?
Source SS df MS F
Main Effect for Row 9.00 1
Main Effect for Column 1.00 1
Interaction 6.25 1
Error
(within groups)
9.50 12
Total 25.75 15
46. What is the MS for row?
Source SS df MS F
Main Effect for Row 9.00 1 9.00
Main Effect for Column 1.00 1
Interaction 6.25 1
Error
(within groups)
9.50 12
Total 25.75 15
47. What is the MS for column?
Source SS df MS F
Main Effect for Row 9.00 1 9.00
Main Effect for Column 1.00 1
Interaction 6.25 1
Error
(within groups)
9.50 12
Total 25.75 15
48. What is the MS for column?
Source SS df MS F
Main Effect for Row 9.00 1 9.00
Main Effect for Column 1.00 1 1.00
Interaction 6.25 1
Error
(within groups)
9.50 12
Total 25.75 15
49. What is the MS interaction?
Source SS df MS F
Main Effect for Row 9.00 1 9.00
Main Effect for Column 1.00 1 1.00
Interaction 6.25 1
Error
(within groups)
9.50 12
Total 25.75 15
50. What is the MS interaction?
Source SS df MS F
Main Effect for Row 9.00 1 9.00
Main Effect for Column 1.00 1 1.00
Interaction 6.25 1 6.25
Error
(within groups)
9.50 12
Total 25.75 15
51. What is the MS error?
Source SS df MS F
Main Effect for Row 9.00 1 9.00
Main Effect for Column 1.00 1 1.00
Interaction 6.25 1 6.25
Error
(within groups)
9.50 12
Total 25.75 15
52. What is the MS error?
Source SS df MS F
Main Effect for Row 9.00 1 9.00
Main Effect for Column 1.00 1 1.00
Interaction 6.25 1 6.25
Error
(within groups)
9.50 12 0.79
Total 25.75 15
53. What is the main effect for row?
Source SS df MS F
Main Effect for Row 9.00 1 9.00
Main Effect for Column 1.00 1 1.00
Interaction 6.25 1 6.25
Error
(within groups)
9.50 12 0.79
Total 25.75 15
54. What is the main effect for row?
Source SS df MS F
Main Effect for Row 9.00 1 9.00 11.37
Main Effect for Column 1.00 1 1.00
Interaction 6.25 1 6.25
Error
(within groups)
9.50 12 0.79
Total 25.75 15
55. What is the main effect for column?
Source SS df MS F
Main Effect for Row 9.00 1 9.00 11.37
Main Effect for Column 1.00 1 1.00
Interaction 6.25 1 6.25
Error
(within groups)
9.50 12 0.79
Total 25.75 15
56. What is the main effect for column?
Source SS df MS F
Main Effect for Row 9.00 1 9.00 11.37
Main Effect for Column 1.00 1 1.00 1.26
Interaction 6.25 1 6.25
Error
(within groups)
9.50 12 0.79
Total 25.75 15
57. What is the interaction?
Source SS df MS F
Main Effect for Row 9.00 1 9.00 11.37
Main Effect for Column 1.00 1 1.00 1.26
Interaction 6.25 1 6.25
Error
(within groups)
9.50 12 0.79
Total 25.75 15
58. What is the interaction?
Source SS df MS F
Main Effect for Row 9.00 1 9.00 11.37
Main Effect for Column 1.00 1 1.00 1.26
Interaction 6.25 1 6.25 7.90
Error
(within groups)
9.50 12 0.79
Total 25.75 15
59. Example
Critical Value
For each test use the df associated with it.
Is not necessarily the same for all three tests
although in our example it is.
4.747
Evaluate each effect separately
63. Now what?
If you have no significant interaction, then
you can talk about what main effects are
significant in the same way that you evaluated
one-way ANOVAs.
If the interaction is significant you must be
careful interpreting main effects. The main
effect could be present simply because of the
interaction. So concentrate on the interaction
interpretation.
64. Now what?
If it is a 2X2 ANOVA and the interaction is
significant then graph the means and interpret.
Our example
0
0.5
1
1.5
2
2.5
3
3.5
4
starter relief
rookie
veteran
65. Now what?
If interaction is significant
Plot interaction
Interpret interaction
Level of one IV is influenced by level of a
second IV
If Main Effects are significant
Conduct Post Hoc tests
Report results
Effect sizes
• Use omega squared to report effect size