Download as PDF, PPTX


![import sys
import json
import twitter
import networkx as nx
from recipe__get_rt_origins import get_rt_origins
def create_rt_graph(tweets):
g = nx.DiGraph()
for tweet in tweets:
rt_origins = get_rt_origins(tweet)
if not rt_origins:
continue
for rt_origin in rt_origins:
g.add_edge(rt_origin.encode('ascii', 'ignore'),
tweet['from_user'].encode('ascii', 'ignore'),
{'tweet_id': tweet['id']}
)
return g
if __name__ == '__main__':
Q = ' '.join(sys.argv[1])
MAX_PAGES = 15
RESULTS_PER_PAGE = 100
twitter_search = twitter.Twitter(domain='search.twitter.com')
search_results = []
for page in range(1,MAX_PAGES+1):
search_results.append(
twitter_search.search(q=Q, rpp=RESULTS_PER_PAGE, page=page)
)
all_tweets = [tweet for page in search_results for tweet in page['results']]
g = create_rt_graph(all_tweets)
print >> sys.stderr, "Number nodes:", g.number_of_nodes()
print >> sys.stderr, "Num edges:", g.number_of_edges()
print >> sys.stderr, "Num connected components:",
len(nx.connected_components(g.to_undirected()))
print >> sys.stderr, "Node degrees:", sorted(nx.degree(g))](https://image.slidesharecdn.com/miningsocialdata-130201021536-phpapp02/75/Mining-social-data-28-2048.jpg)


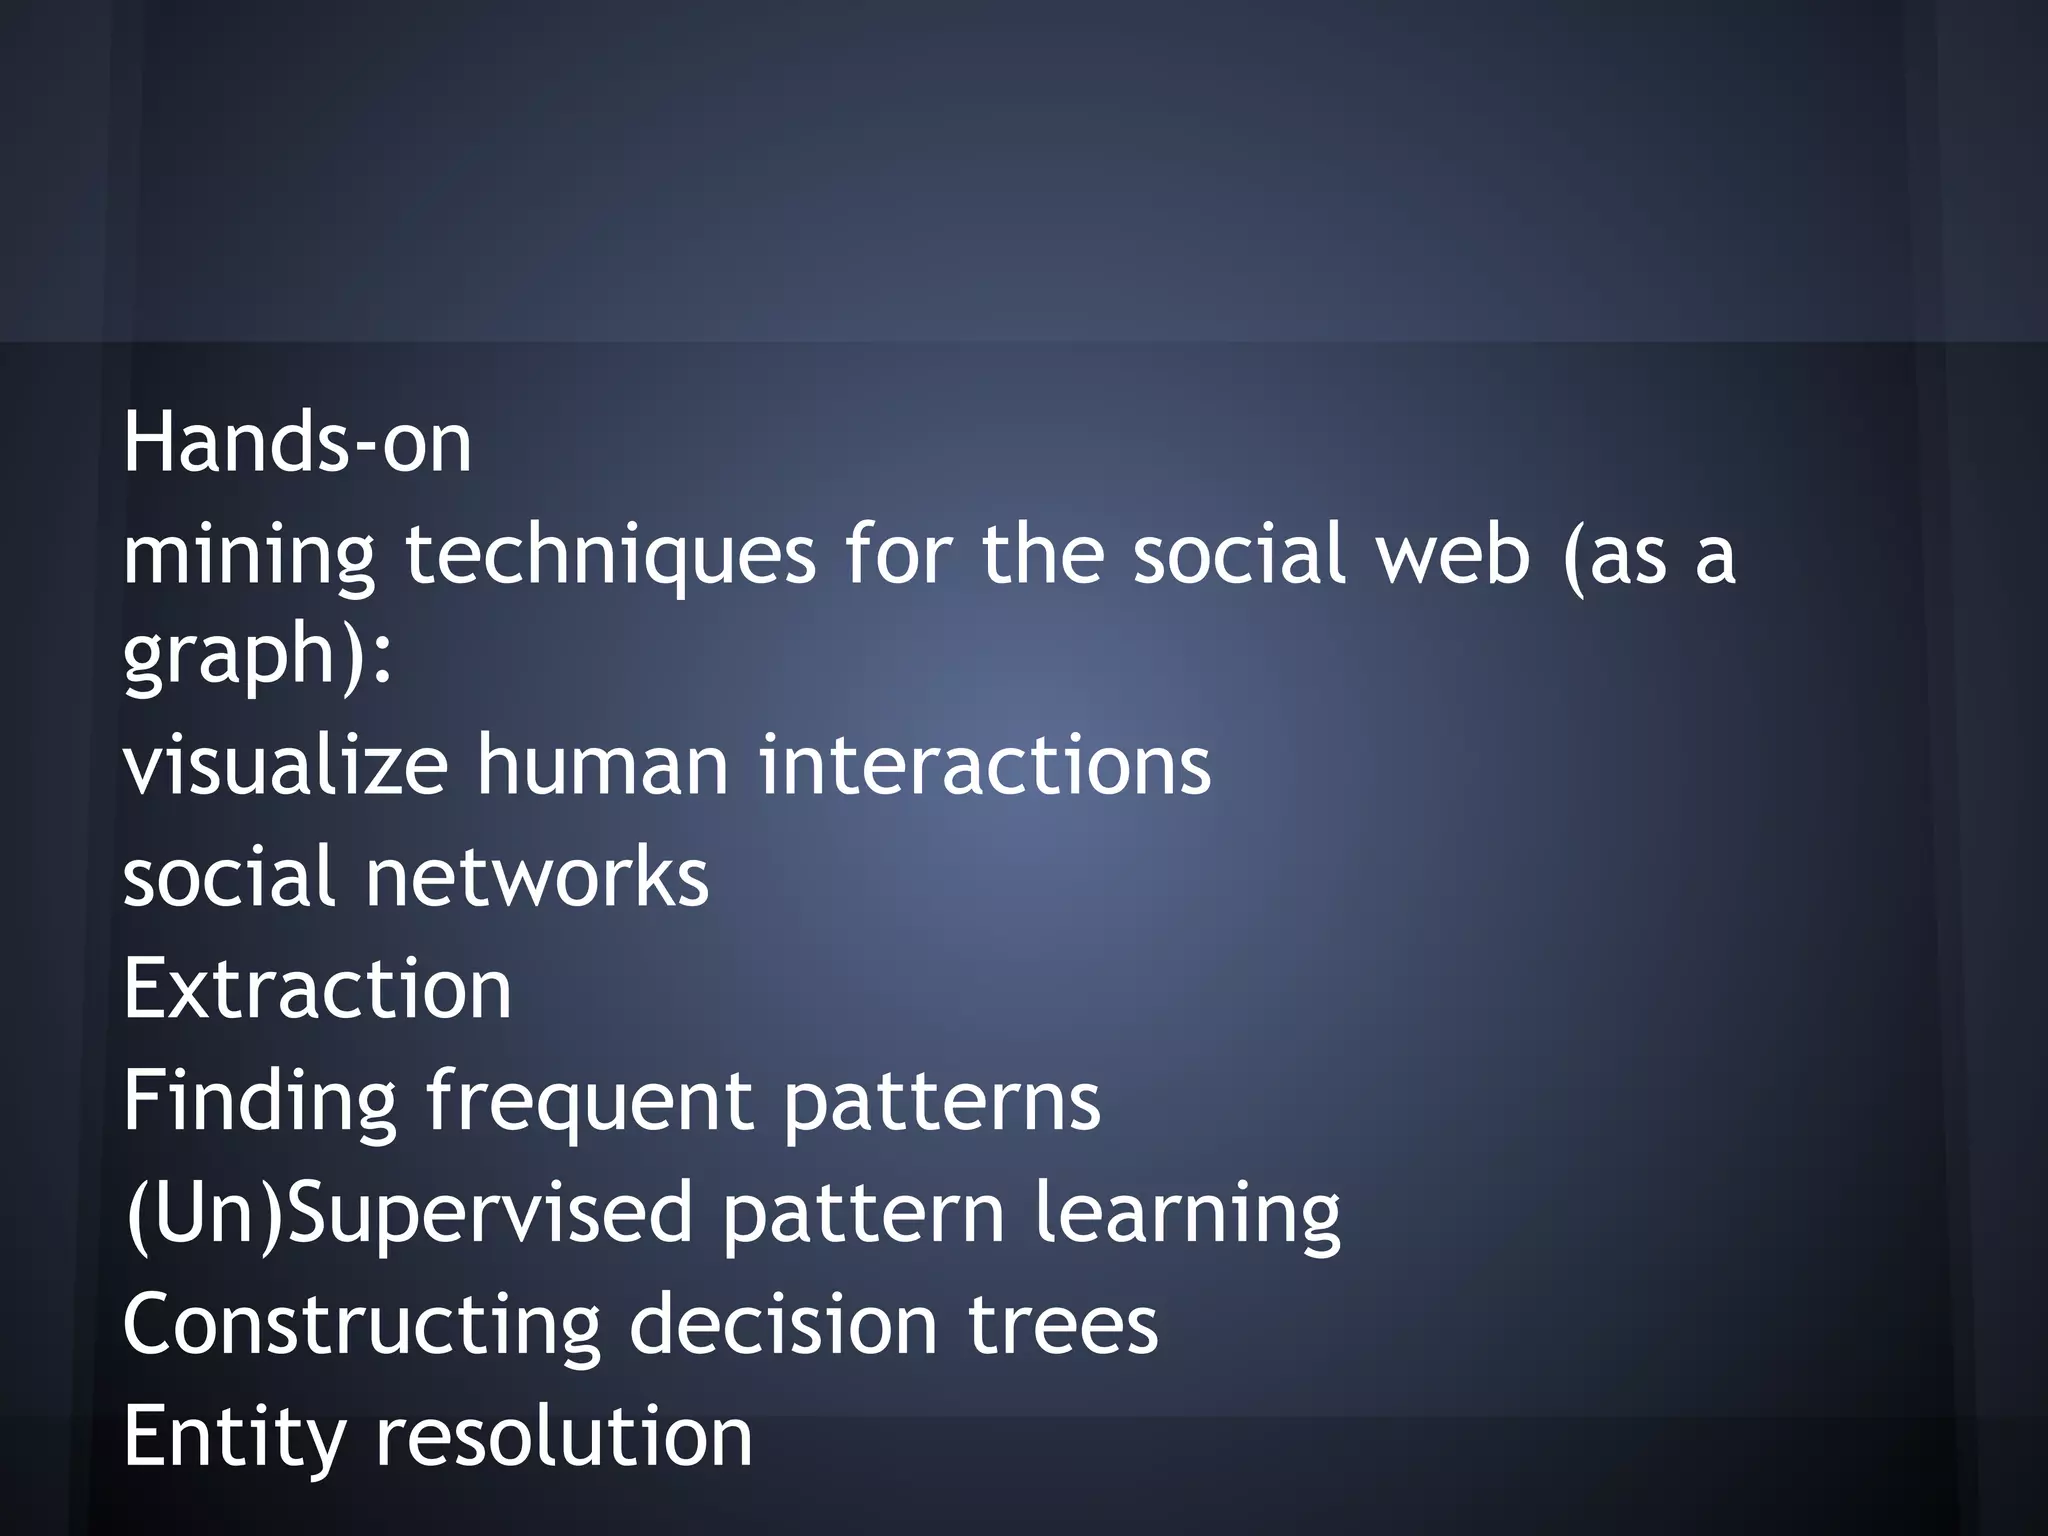
!["ChunkingLess"
Graph Based Induction
CL-CBI [Cook et. al.]](https://image.slidesharecdn.com/miningsocialdata-130201021536-phpapp02/75/Mining-social-data-37-2048.jpg)


This document discusses mining social data from graphs by extracting the data from social networks using their APIs or by crawling websites. It describes representing the social data as graphs and using graph mining techniques like finding frequent patterns and substructures using algorithms like Apriori, pattern growth, and CL-CBI (ChunkingLess - Constraint-Based Induction). Decision trees can also be used to iteratively find patterns that branch the data. The challenges include the graph nature of the data, errors and unknowns, and vanity metrics, but graphs are useful for capturing complex social structures.