Download to read offline
![Introduction
The emergence of social media (SM) has profoundly changed the perspective
of communication, which resulted in a revolution in the way people interact
with each other [1].
In online SM platforms, users can express their ideas by posting original
content or by adding comments and responses to existing posts, thus
generating virtual discussions and conversations.
For reasons such as: interacting within the inner circle of friendship,
entertainment purposes, subscribing to news, knowledge sharing purpose on
online learning, and Q&A platforms [2],[3].
Many companies adopt SM to utilize this growing trend to gain business
values [4].](https://image.slidesharecdn.com/conversationgraphsinonlinesocialmedia-210519152005/75/Conversation-graphs-in-Online-Social-Media-3-2048.jpg)
![State-of-the-art in Conversation Graphs on Social Media
Ning et al. [5] utilize graph analysis to better support Q&A systems.
Aumayr et al. [6] explore classification methods for recovering the reply
structures in forum threads.
Cogan et al. [7] propose a method to reconstruct complete conversations
around initial tweets.
Zayats and Ostendorf [8] predict the popularity of comments on Reddit
discussions.
Kumar et al. [9] propose a mathematical model for the generation of basic
conversation structure to explore the model humans follow during online
conversations.
Aragon et al. [10] investigate the impact of threading the messages instead of
linearly displaying them.](https://image.slidesharecdn.com/conversationgraphsinonlinesocialmedia-210519152005/75/Conversation-graphs-in-Online-Social-Media-4-2048.jpg)

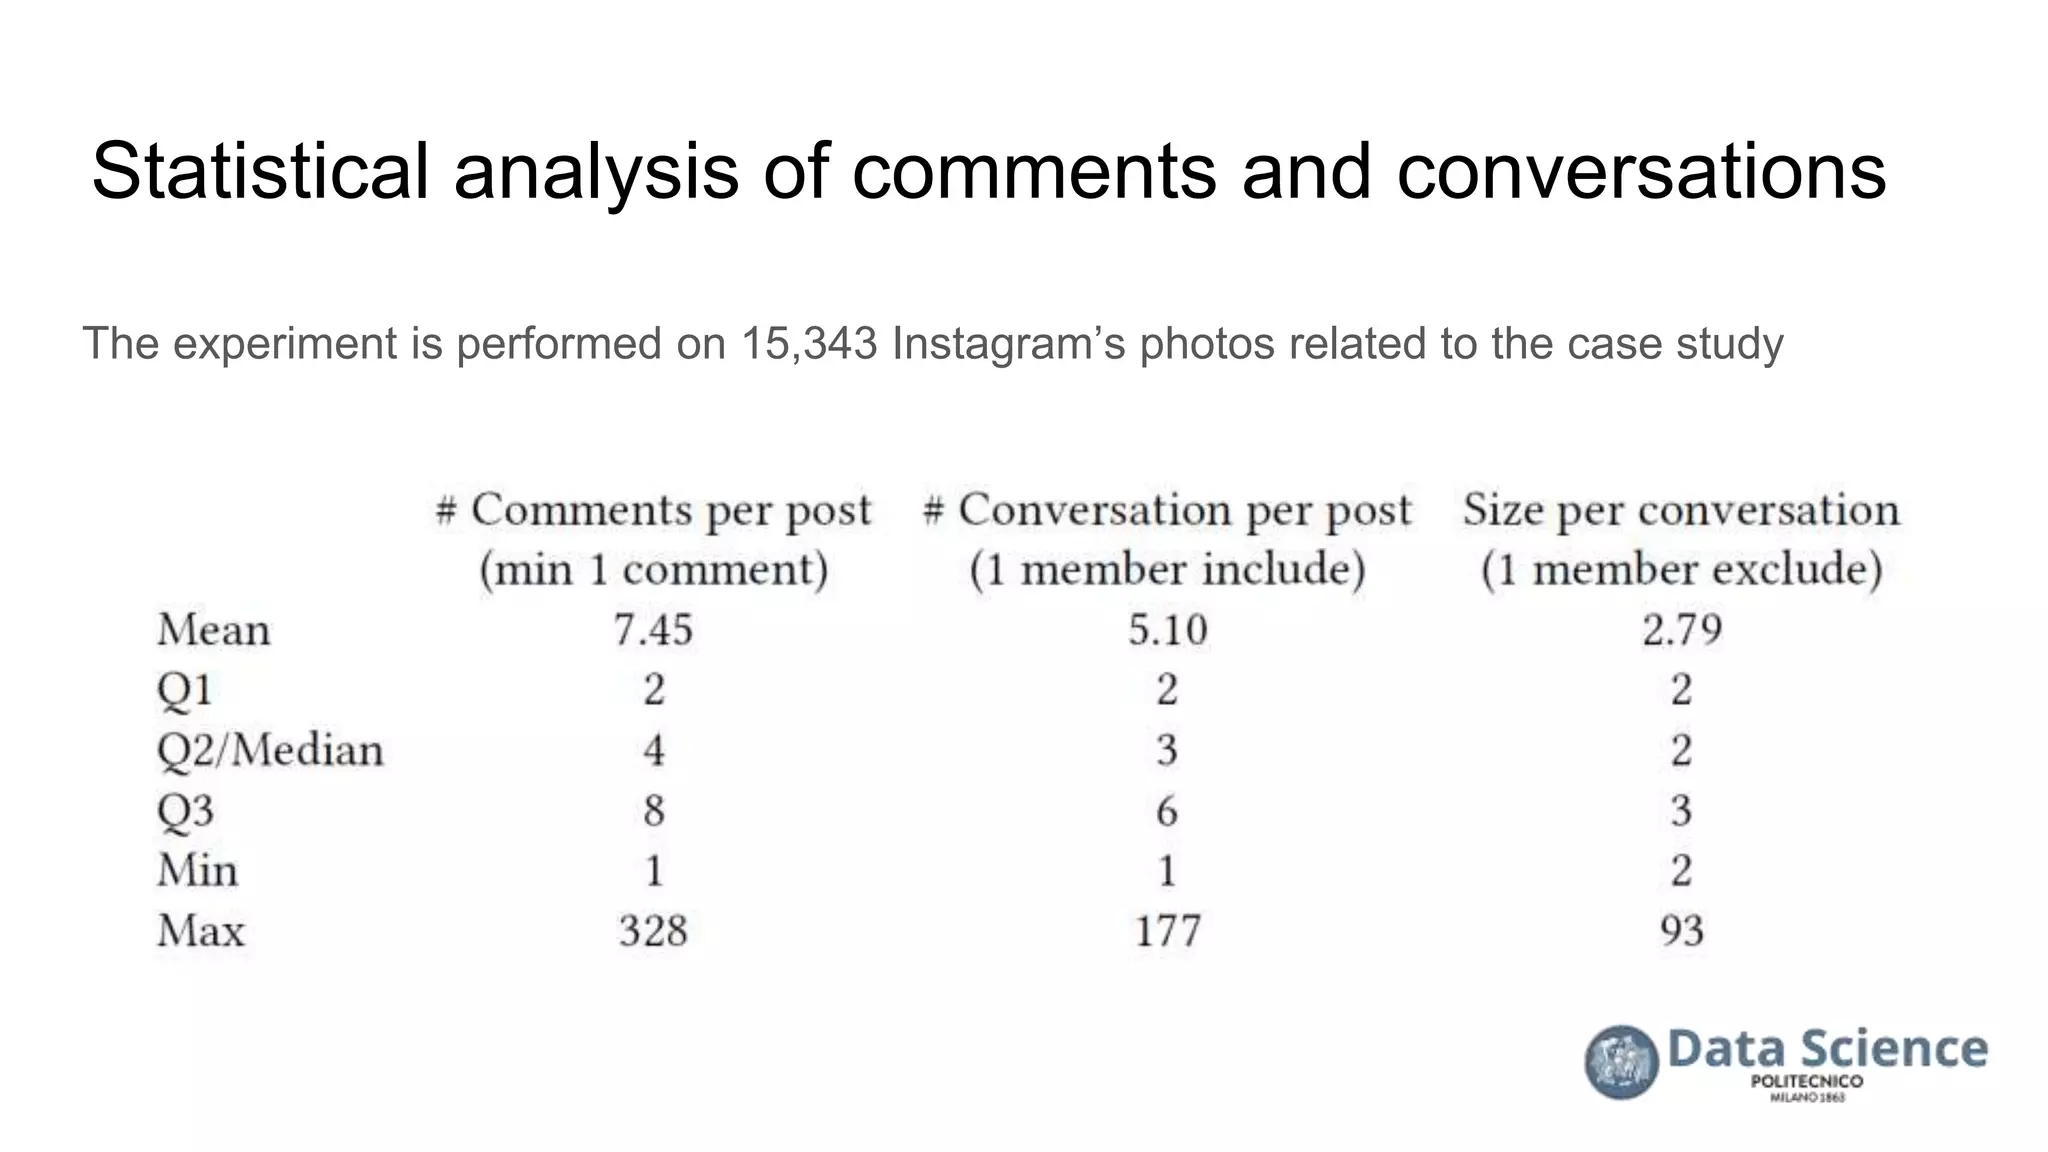
![Case Study: YourExpo2015 Game Challenge*
Long-running Live Event [11]
* http://www.socialmediaexpo2015.com/yourexpo/
15,000 Photos 600,000 Actions
100,000 Comments 80,000 Participants](https://image.slidesharecdn.com/conversationgraphsinonlinesocialmedia-210519152005/75/Conversation-graphs-in-Online-Social-Media-7-2048.jpg)
![References
[1] Qualman, Erik. Socialnomics: How social media transforms the way we live and do business. John Wiley & Sons, 2012.
[2] Al-Atabi, Mushtak, and Jennifer DeBoer. "Teaching entrepreneurship using massive open online course (MOOC)." Technovation 34.4
(2014): 261-264.
[3] Vasilescu, Bogdan, et al. "How social Q&A sites are changing knowledge sharing in open source software communities." Proceedings
of the 17th ACM conference on Computer supported cooperative work & social computing. 2014.
[4] Dong, John Qi, and Weifang Wu. "Business value of social media technologies: Evidence from online user innovation communities."
The Journal of Strategic Information Systems 24.2 (2015): 113-127.
[5] Yang, Jaewon, Julian McAuley, and Jure Leskovec. "Community detection in networks with node attributes." 2013 IEEE 13th
international conference on data mining. IEEE, 2013.
[6] Aumayr, Erik, Jeffrey Chan, and Conor Hayes. "Reconstruction of threaded conversations in online discussion forums." Proceedings of
the International AAAI Conference on Web and Social Media. Vol. 5. No. 1. 2011.
[7] Cogan, Peter, et al. "Reconstruction and analysis of twitter conversation graphs." Proceedings of the First ACM International Workshop
on Hot Topics on Interdisciplinary Social Networks Research. 2012.
[8] Zayats, Victoria, and Mari Ostendorf. "Conversation modeling on reddit using a graph-structured lstm." Transactions of the Association
for Computational Linguistics 6 (2018): 121-132.
[9] Kumar, Ravi, Mohammad Mahdian, and Mary McGlohon. "Dynamics of conversations." Proceedings of the 16th ACM SIGKDD
international conference on Knowledge discovery and data mining. 2010.
[10] Aragón, Pablo, Vicenç Gómez, and Andreaks Kaltenbrunner. "To thread or not to thread: The impact of conversation threading on
online discussion." Proceedings of the International AAAI Conference on Web and Social Media. Vol. 11. No. 1. 2017.
[11] Brambilla, Marco, Alireza Javadian Sabet, and Marjan Hosseini. "The role of social media in long-running live events: The case of the
Big Four fashion weeks dataset." Data in Brief 35 (2021): 106840.](https://image.slidesharecdn.com/conversationgraphsinonlinesocialmedia-210519152005/75/Conversation-graphs-in-Online-Social-Media-29-2048.jpg)

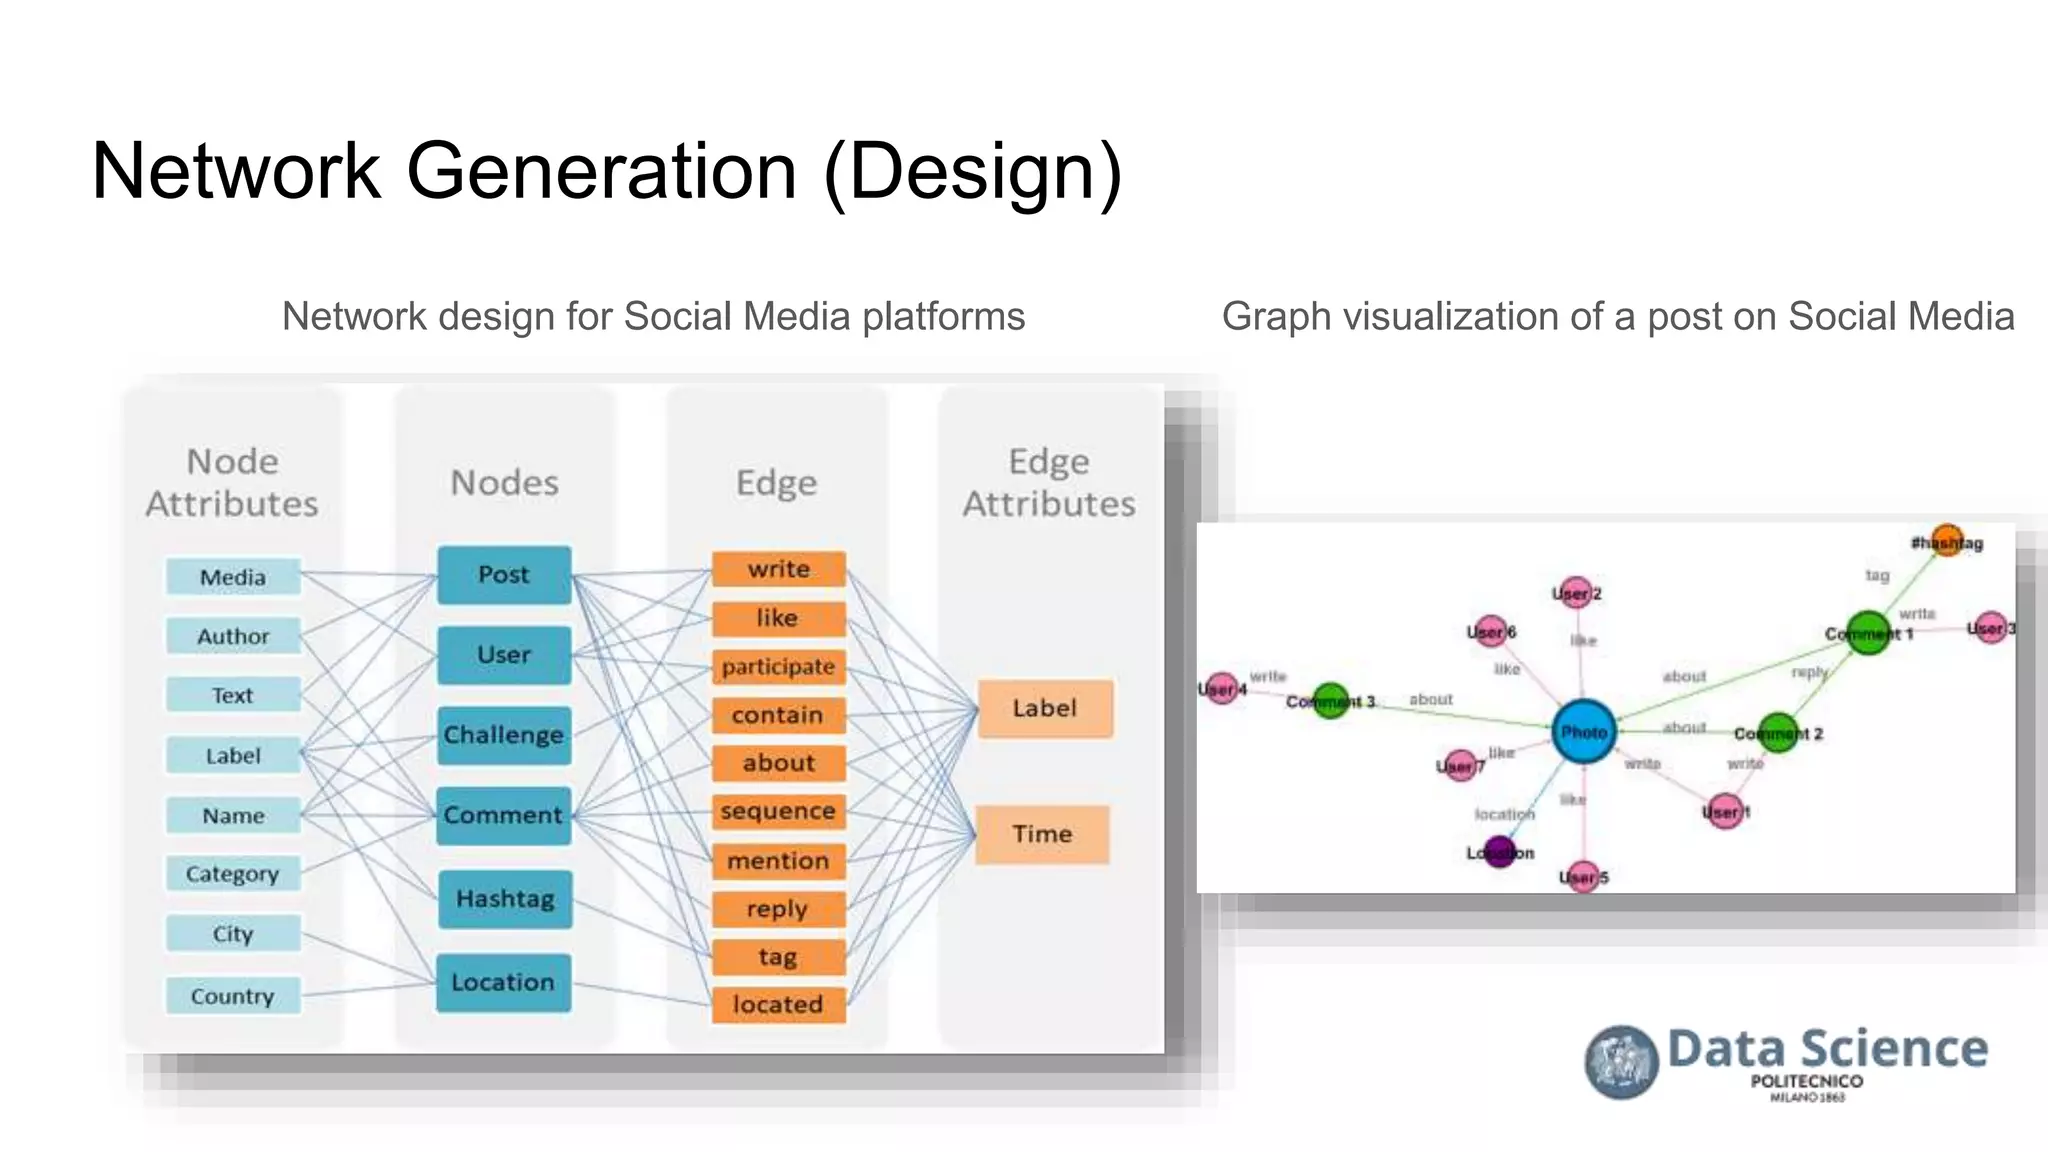
The document discusses the impact of social media on communication and presents a study on conversation graphs, highlighting research questions and methodologies used for analyzing user interactions. It explores intent analysis, network generation, and pattern identification based on data from a case study involving a large social media event. The findings reveal insights into user behavior and preferences, which can be beneficial for designing conversational agents.