Download as PDF, PPTX


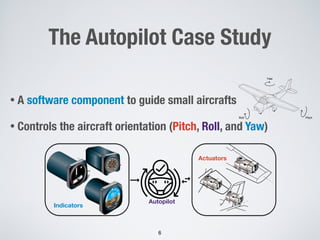

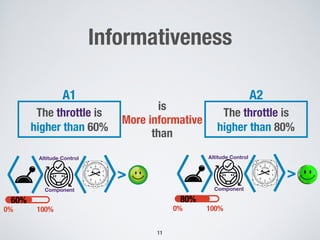

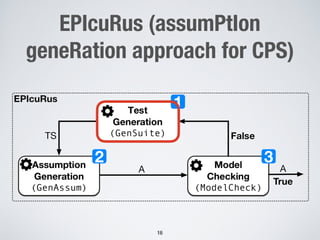
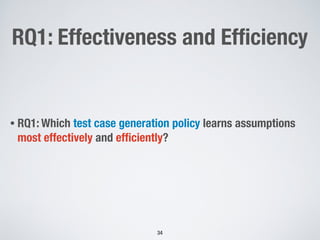
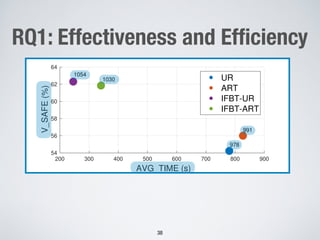
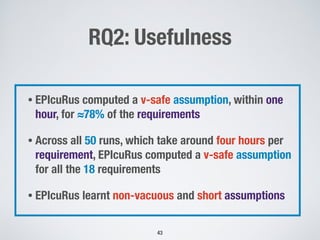
![Assumption Generation
!22
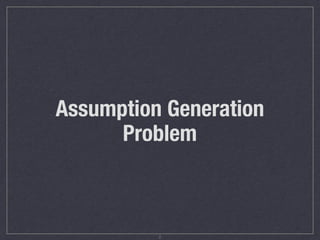
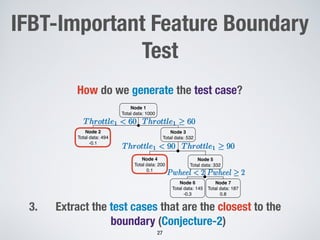
2
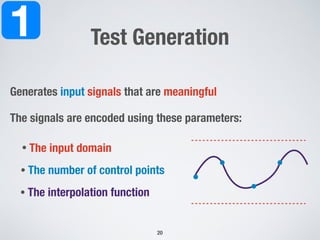
Node 1
Total data: 1000
Node 2
Total data: 494
98%
Label: fail
Node 3
Total data: 532
Node 4
Total data: 200
100%
Label: pass
Throttle1 < 60Throttle1 < 60Throttle1 < 60 Throttle1 ≥ 60Throttle1 ≥ 60Throttle1 ≥ 60
Throttle1 < 90Throttle1 < 90Throttle1 < 90 Throttle1 ≥ 90Throttle1 ≥ 90Throttle1 ≥ 90
Node 5
Total data: 332
Node 6
Total data: 145
32%
Label: pass
Node 7
Total data: 187
85%
Label: fail
Pwheel < 2Pwheel < 2Pwheel < 2 Pwheel ≥ 2Pwheel ≥ 2Pwheel ≥ 2
8t 2 [0, t1] : 60 Throttle(t) < 908t 2 [0, t1] : 60 Throttle(t) < 908t 2 [0, t1] : 60 Throttle(t) < 90
60 Throttle1 < 9060 Throttle1 < 9060 Throttle1 < 90](https://image.slidesharecdn.com/fse2020-epicurus-presentation-201112120503/85/Mining-Assumptions-for-Software-Components-using-Machine-Learning-22-320.jpg)
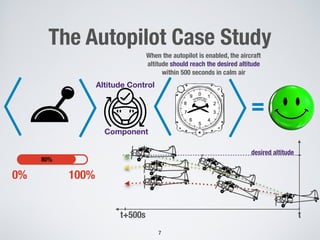
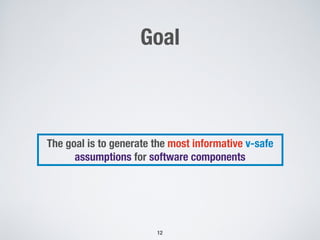
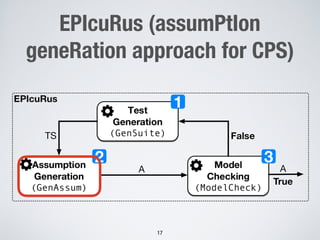
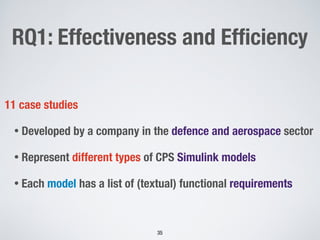
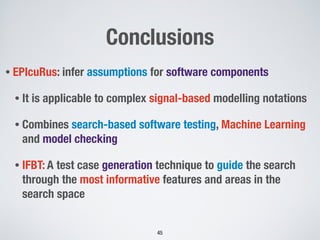
![Model Checking
!23
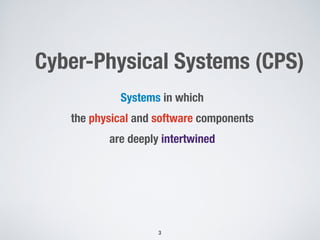
3
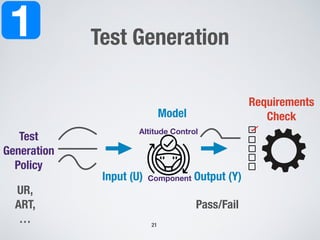
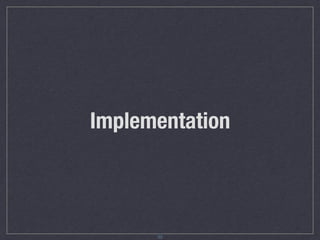
Exhaustively checks if the obtained assumption is accurate
• QVTrace from QRA Corp, Canada
• SMT-based model checker for Simulink
• Z3, Mathematica
2.4.Accessing QVtrace:
Once the QVtrace server is running, QVtrace will be accessed through a web browser with
the address: http://localhost:2999
If accessing the QVtrace server on a networked computer then use the address:
http://[server_name]:2999.
QVtrace has been fully tested to be accessed with the Google Chrome web browser.
Although other browsers may render QVtrace appropriately, these have not been fully
tested and their performance is not well known. We recommend you use the Google
Chrome browser for QVtrace.
3. Using QVtrace
3.1.Understanding the QVtrace user interface
QVtrace has been designed to optimize the workflow for model-based design analysis. The
interface has three main sections as shown in the image below and described in detail on
the next page.
QVtrace User Manual v0.11.7 qracorp.com of4 21
1
2
3](https://image.slidesharecdn.com/fse2020-epicurus-presentation-201112120503/85/Mining-Assumptions-for-Software-Components-using-Machine-Learning-23-320.jpg)
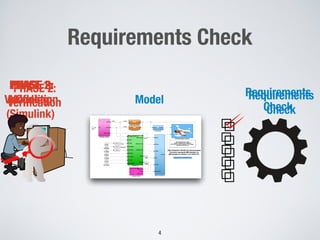
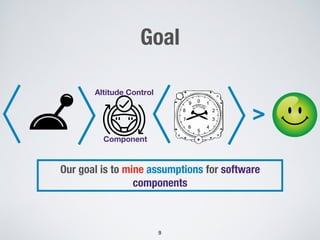
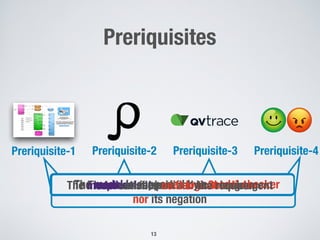
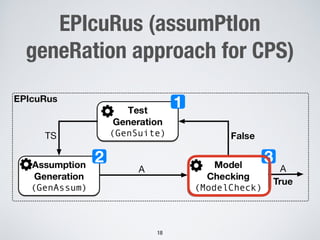
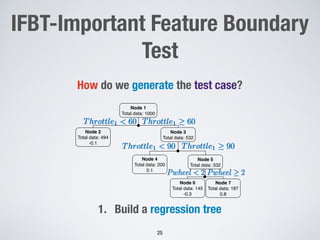
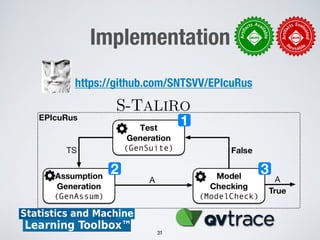
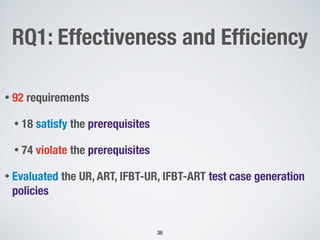
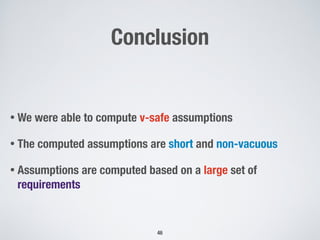
![IFBT-Important Feature Boundary
Test
[ ]][ ][
0% 100%
boundary areas
Conjecture-1Conjecture-2
Identifying control points with high
impact on the fitness value and
focusing the search on them
!24
Generating test cases in boundary
areas of the input domain
Two conjectures enable more effective learning of v-safe
assumptions.](https://image.slidesharecdn.com/fse2020-epicurus-presentation-201112120503/85/Mining-Assumptions-for-Software-Components-using-Machine-Learning-24-320.jpg)
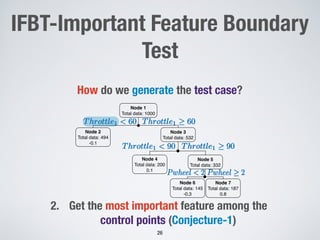
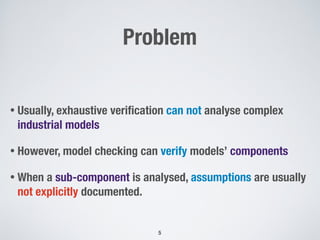
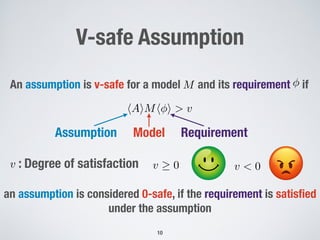
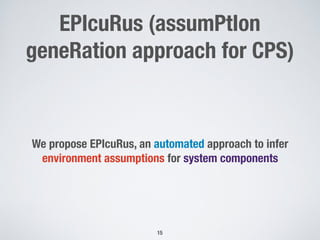
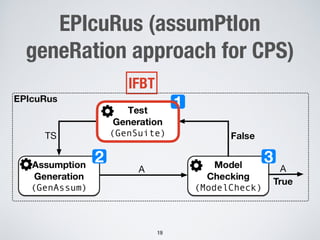
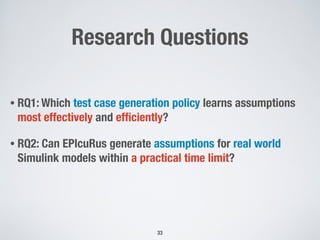
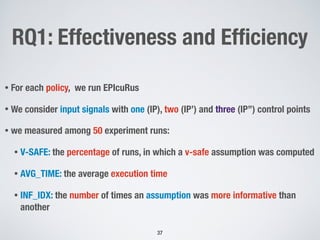
![Node 1
Total data: 1000
Node 2
Total data: 494
-0.1
Node 3
Total data: 532
Node 4
Total data: 200
0.1
Throttle1 < 60Throttle1 < 60Throttle1 < 60 Throttle1 ≥ 60Throttle1 ≥ 60Throttle1 ≥ 60
Throttle1 < 90Throttle1 < 90Throttle1 < 90 Throttle1 ≥ 90Throttle1 ≥ 90Throttle1 ≥ 90
Node 5
Total data: 332
Node 6
Total data: 145
-0.3
Node 7
Total data: 187
0.8
Pwheel < 2Pwheel < 2Pwheel < 2 Pwheel ≥ 2Pwheel ≥ 2Pwheel ≥ 2
!28
IFBT-Important Feature Boundary
Test
4. Get the ranges associated with the most
important feature
[54 , 66]
[81 , 99]
How do we generate the test case?](https://image.slidesharecdn.com/fse2020-epicurus-presentation-201112120503/85/Mining-Assumptions-for-Software-Components-using-Machine-Learning-28-320.jpg)
![!29
IFBT-Important Feature Boundary
Test
5. For each test case, get the ranges associated
with the most important feature
How do we generate the test case?
Node 1
Total data: 1000
Node 2
Total data: 494
-0.1
Node 3
Total data: 532
Node 4
Total data: 200
0.1
Throttle1 < 60Throttle1 < 60Throttle1 < 60 Throttle1 ≥ 60Throttle1 ≥ 60Throttle1 ≥ 60
Throttle1 < 90Throttle1 < 90Throttle1 < 90 Throttle1 ≥ 90Throttle1 ≥ 90Throttle1 ≥ 90
Node 5
Total data: 332
Node 6
Total data: 145
-0.3
Node 7
Total data: 187
0.8
Pwheel < 2Pwheel < 2Pwheel < 2 Pwheel ≥ 2Pwheel ≥ 2Pwheel ≥ 2
[54 , 66]
[81 , 99]](https://image.slidesharecdn.com/fse2020-epicurus-presentation-201112120503/85/Mining-Assumptions-for-Software-Components-using-Machine-Learning-29-320.jpg)


EPIcuRus is an approach to automatically generate assumptions for software components in cyber-physical systems modeled in Simulink. It uses machine learning techniques to mine assumptions from test case results. The approach includes generating tests cases using an important feature boundary test generation method, model checking candidate assumptions, and selecting the most informative safe assumptions. An evaluation on industrial case studies found it can learn non-vacuous assumptions for most requirements within a practical time limit, with the important feature boundary test generation performing best.


![20260201 [FOSDEM] gomodjail - library sandboxing for Go modules.pdf](https://cdn.slidesharecdn.com/ss_thumbnails/20260201fosdemgomodjail-librarysandboxingforgomodules-260201225659-76609ec4-thumbnail.jpg?width=640&height=640&fit=bounds)
![谷歌留痕技术教程[ 𝙩𝙤𝙥 𝟮𝟯𝟯. 𝙘 𝙤𝙢 ]](https://cdn.slidesharecdn.com/ss_thumbnails/top233-260130173900-2eb784f9-thumbnail.jpg?width=640&height=640&fit=bounds)


