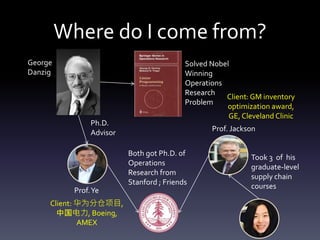
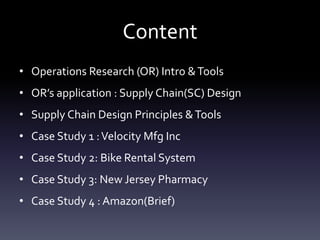
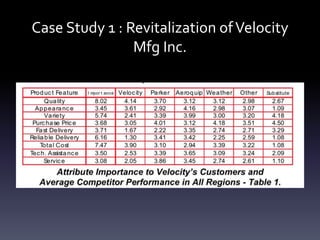
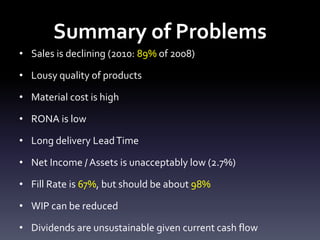
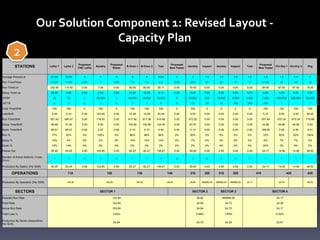
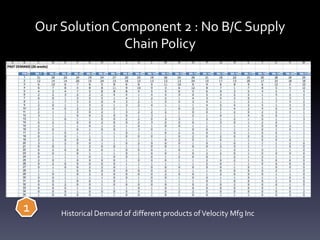
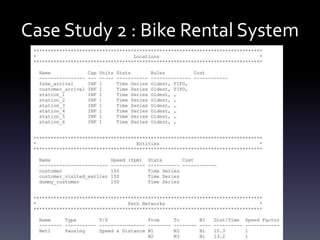
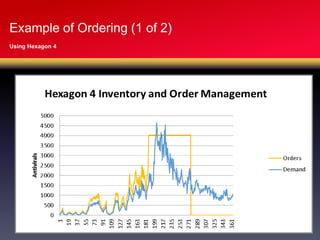
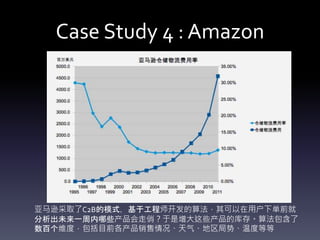
Supply Chain Design and
Operation
Presented by Anqi Guo
Date : 2/12/15 Updated 2/20/15 4/12/15 4/17/15
Where do I come from?
George
Danzig
Prof.Ye
Prof. Jackson
Ph.D.
Advisor
Took 3 of his
graduate-level
supply chain
courses
Both got Ph.D. of
Operations
Research from
Stanford ; Friends
Solved Nobel
Winning
Operations
Research
Problem
Client: 华为分仓项目,
中国电力, Boeing,
AMEX
Client: GM inventory
optimization award,
GE, Cleveland Clinic
Content
• Operations Research (OR) Intro &Tools
• OR’s application : Supply Chain(SC) Design
• Supply Chain Design Principles &Tools
• Case Study 1 :Velocity Mfg Inc
• Case Study 2: Bike Rental System
• Case Study 3: New Jersey Pharmacy
• Case Study 4 : Amazon(Brief)
What is Operations Research?
运筹帷幄之中,决胜千里之外。--汉高祖刘邦
“Operations Research is
the application of
advanced analytical
methods to help make
better decisions.
-Wikipedia
To Optimize!
OR was created and widely used inWW II
Aircraft from black to white, 20% closer, 30%
more sinkingGerman U-boat
1% to 7% of sunken German U-boat by changing
depth charge from 100 ft to 25 ft
2 tubs for washing, 2 tubs for rinsing
3 tubs for washing, 1 tubs for rinsing
Saved a lot of time
Patrick Blackett:
British physicist
Cornell professor reduced 85% of number
of students facing three exams in a day
8,000 Students 4,000 Courses
# of possible exam
schedules? More than
50,000,000,000,000,000
,000
11 days 66 time slots
Demo 1: Assignment Problem
Simplify the
problem
Model Run Code in AMPL Result
Assume 4 courses(i:
1,2,3,4), 4 time
slot(j:A,B,C,D);
Professor will rate
time slot for each
course from 1(most
favorable) to
4(least favorable);
Each course will get
assigned to a
course;
Minimize sum of
total ranks picked
6, (1C) (2B), (3D),(4A)
See Notes for professors’ ranks
for each time slot
Linear
Programming
Generalized
MinimumCost
Flow Problem
Pure Minimum
Cost Flow
Problem
Transportation
Problem
Assignment
Problem
Shortest Path
Problem
Maximum Flow
Problem
Back toWhere I am from
Steps in Operations Research
Problem
Definition
Model
Constructi
on
Model
Solution
Validation
of the
Model
Implemen
tation
Review
and
Maintain
Think in Operations Research
Demo 2: Simplified Cookie Problem
Want to know how many trays are in a queue?
Modeling
RunVBA in Excel
Result
See Simulation codes & procedure in excel
ORTools & Application
Linear
Programming
• Transportation
• Assignment
• Integer
Programming
• Goal
Programming
Probabilistic
Technique
• Decision
Analysis
• GameTheory
• Markov
Analysis
• Queuing
Theory
• Simulation
• Forecasting
Inventory
Technique
• Inventory
Models
• Newsvendor
problem
• Economic
Order
Quantity
Network
Technique
• Network
Models
(CPM/PERT)
Non-linear
Programming
• Dynamic
Programming
Fleet Assignment at Delta Airlines : Savings of $220,000 per day in 1993 (with
60,000 variables and 40,000 constraints)
Gasoline Blending atTexaco : Savings of $30 million annually
KeyCorp Service Excellence Management System:Customer processing times
were reduced by 53% , resulted in savings of $98 million in 5 years
OR’S application : Supply Chain
Management(SCM)
Global SupplyChain of Maersk
Three Basic Measures of Process Analysis
Immigration Department MBA program Auto company
Applications Student Car
Approved or rejected cases Graduating class Sales per year
Processing time 2 years 60 days
Pending cases Total campus population Inventory
Flow Unit
Flow rate/
throughput
FlowTime
Inventory
Flow rate/throughput : number of flow units going through the process per unit of time
FlowTime : time it takes a flow unit to go from the beginning to the end of the process
Inventory: the number of flow units in the process at a given moment in time
Flow Unit : Customer or Sandwich
Why is SCM important?
10.87
6.68
5.7
3.25
7.99
0
5
10
15
20
25
8-Dec 9-Dec 10-Dec 11-Dec 12-Dec 13-Dec 14-Dec
Annual InventoryTurnover Rate for China-US Top E-commerce Companies
JD
VIPS
WALMART
JUMEI
DANG
AMAZON
A higher than industry average turnover demonstrates that your business is
competitive, while a smaller than industry average turnover shows that there is room for
improvement.
Global Industry Average is 7.
Difficulty of SCM
1. Demand Uncertainty
2. Poor physical characteristics
3. Poor information infrastructures
4. Business process not accurately evolve
5. No Decision support system
Hierarchy of Supply Chain Planning
Current Supply Chain Models
1. MRP Model
Bill of materials(BOM) , Master production schedule
Enterprise Resource Planning(ERP)
2. Mathematical Programming-Based Model
Newsvendor Problem, Assignment Problem
Max flow/Min cut problem, Dynamic Programming, Integer Programming
3. Inventory Model
Safety stock, lead time, etc.
4. Advanced Planning and Scheduling System
MRP ModelMRP Model
Dynamic
Programming
Knapsack
Problem
Ordering Point System
Four types of supply chain relationship
Can they collaborate?
Guideline for Collaborative Supply Chain Design
1. Know the Customer
2. Construct a lean SC that eliminates waste, variability,
and uncertainty
3. Build tightly coupled information infrastructure
4. Build tightly coupled business process
5. Construct tightly coupled decision support system
1
2
3
4
5
Case Study 1 : Revitalization ofVelocity
Mfg Inc.
In 2011, a second tier supplier in the U.S. hydraulic hose
Note: Course project
Case Study 1 : Revitalization ofVelocity
Mfg Inc.
Case Study 1 : Revitalization ofVelocity
Mfg Inc.
Current Problems
Our Solutions
Projected Results
Summary of Problems
• Sales is declining (2010: 89% of 2008)
• Lousy quality of products
• Material cost is high
• RONA is low
• Long delivery LeadTime
• Net Income / Assets is unacceptably low (2.7%)
• Fill Rate is 67%, but should be about 98%
• WIP can be reduced
• Dividends are unsustainable given current cash flow
Our Solution Component 1: Revised Layout
2
Our Solution Component 1: Revised Layout -
Capacity Plan
STATIONS Lathe 1 Lathe 2
Proposed
CNC Lathe
Asmbly
Proposed
Robot
B-Oven 1 B-Oven 2 Test
Proposed
New Tester
Asmbly Inspect Asmbly Inspect Test
Proposed
New Tester
Cln-Dry 1 Cln-Dry 2 Pkg
Average Pieces/Lot 21.00 10.00 0 1 0 8 8 6.69 0 3 1.5 1.5 1.5 1.5 4.5 1.5 1.5 1
Run Time/Piece 11.05 11.05 0.00 7 0.00 7.5 7.5 4.5 0.00 23.5 21 22 15 17 21.00 45 45 15
Run Time/Lot 232.05 110.50 0.00 7.00 0.00 60.00 60.00 30.11 0.00 70.50 0.00 0.00 0.00 0.00 94.50 67.50 67.50 15.00
Setup Time/Lot 29.00 5.80 0.00 0.00 0.00 10.00 10.00 5.10 0.00 5.00 7.00 5.00 8.00 5.00 8.00 5.00 5.00 0.00
MTBF 30 30 0 30,000 0 45,000 45,000 75,000 0 65,000 600 80,000 4,000 2,000 2,200 500,000 500,000 50,000
MTTR 5 5 0 3 0 7 7 5 0 13 25 15 180 200 735 1 1 1
Total Time/Shift 720 720 0 720 0 720 720 720 0 720 0 0 0 0 720 720 720 720
Lots/Shift 2.40 5.34 0.00 102.85 0.00 10.28 10.28 20.45 0.00 9.53 0.00 0.00 0.00 0.00 5.37 9.93 9.93 48.00
Run Time/Shift 557.43 590.57 0.00 719.93 0.00 617.06 617.06 615.66 0.00 672.20 0.00 0.00 0.00 0.00 507.49 670.34 670.34 719.99
Setup Time/Shift 69.66 31.00 0.00 0.00 0.00 102.84 102.84 104.30 0.00 47.67 0.00 0.00 0.00 0.00 42.96 49.66 49.66 0.00
Down Time/Shift 92.91 98.43 0.00 0.07 0.00 0.10 0.10 0.04 0.00 0.13 0.00 0.00 0.00 0.00 169.55 0.00 0.00 0.01
Run % 77% 82% 0% 100% 0% 86% 86% 86% 0% 93% 0% 0% 0% 0% 70% 93% 93% 100%
Setup % 10% 4% 0% 0% 0% 14% 14% 14% 0% 7% 0% 0% 0% 0% 6% 7% 7% 0%
Down % 13% 14% 0% 0% 0% 0% 0% 0% 0% 0% 0% 0% 0% 0% 24% 0% 0% 0%
Pieces Out 50.45 53.45 0.00 102.85 0.00 82.27 82.27 136.81 0.00 28.60 0.00 0.00 0.00 0.00 24.17 14.90 14.90 48.00
Number of Active Stations (1=yes,
0=no)
1 1 0 1 0 1 1 1 0 1 0 0 0 0 1 1 1 1
Production By Station (Per Shift) 50.45 53.45 0.00 102.85 0.00 82.27 82.27 136.81 0.00 28.60 0.00 0.00 0.00 0.00 24.17 14.90 14.90 48.00
OPERATIONS 110 120 130 140 210 220 310 320 410 420 430
Production By Operation (Per Shift) 103.89 102.85 164.55 136.81 28.60 999999.00 999999.00 999999.00 24.17 29.79 48.00
SECTORS SECTOR 1 SECTOR 2 SECTOR 3 SECTOR 4
Feasible Run Rate 102.85 28.60 999999.00 24.17
Feed Rate 102.85 24.94 24.72 24.26
Actual Run Rate 102.85 24.94 24.72 24.17
Yield Loss % 3.02% 0.88% 1.83% 2.30%
Production By Sector (Assemblies
Per Shift)
24.94 24.72 24.26 23.61
2
Our Solution Component 2 : No B/C Supply
Chain Policy
Historical Demand of different products ofVelocity Mfg Inc
1
Our solution component 3: Machine Job assignment
5
Acquire production
info from white
boardStart of Shift
Are there
still input
materials
to process?
Choose next
unit to work on
Setup Tester for
Current End
Fitting
Run Test
Good
Unit?
No
Yes
Place into
Scrap Pile and
report to plan
controller
Place into WIP1
and update WIP1
Produce Blanks
Assemble Blanks and
Elbows
Lathe Operators
Assemblers
Oven and Test
Operator
Are there
still input
materials
to
process?
Choose next
unit to work on
Lathe Operators
Assemblers
Oven 1
running
?
Both Oven
in
operation?
Yes
Put end fitting into
oven 1 until it’s filled
Run Oven
Yes
No
No
Put end fitting into oven
2 until it’s filled
Lathe 2
operating
?
Yes
Put blanks into lathe1
until it’s filled
Put blanks into lathe2
until it’s filled
No
End of Shift
Run Lathe
Sector 1 Shop Floor Operation Plan
Update White
Board
3
Simulated Result
Investment:
$2100k
Estimated
profit:
$3000k
Risk:Market
Demand shift
might drive
the business
out
Case Study 2 : Bike Rental System
• 6 Bike Stations
• 18 Bikes
• Simulated effect of changing incentives for people to
reposition bike on customer satisfaction rate
5
Case Study 2 : Bike Rental System
Case Study 3: New Jersey Pharmacy
Provide
Antivirals
to
patients
Set
Patient
Travel
Range <
25 Miles
Ensure Short
WaitingTimes
at Pharmacies
0
5000
10000
15000
20000
25000
30000
1
14
27
40
53
66
79
92
105
118
131
144
157
170
183
196
209
222
235
248
261
274
287
300
313
326
339
352
Demand
Days
Actual Historical Annual Demand
(Pediatric + Adult)
Phase 1: Initiation
Phase 2: Peak
Phase 3: Resolution
Reduce the Complexity of the CDC Supply Chain
Determining Which Specific Pharmacies to Use (3 out of 3)
Divided States into 45
Hexagon Shaped regions
Furthest distance <25
miles
Unify many inventories
into one inventory
(governmental policy)
Link the hexagons to
pharmacy locations and
regional population
Determine whether
regional capacity fits the
peak day demand
Discovered certain high
population hexagons need
additional capacity on
peak days!
(Divide into three phases)
Example of Ordering (1 of 2)
Using Hexagon 4
Case Study 4 : Amazon
亚马逊采取了C2B的模式,基于工程师开发的算法,其可以在用户下单前就
分析出未来一周内哪些产品会走俏?于是增大这些产品的库存。算法包含了
数百个维度,包括目前各产品销售情况、天气、地区局势、温度等等
Thank you
Anqi Guo
Anqi.guo@vipshop.com
Vipshop US Inc.

Supply chain design and operation

  • 1.
    Supply Chain Designand Operation Presented by Anqi Guo Date : 2/12/15 Updated 2/20/15 4/12/15 4/17/15
  • 2.
    Where do Icome from? George Danzig Prof.Ye Prof. Jackson Ph.D. Advisor Took 3 of his graduate-level supply chain courses Both got Ph.D. of Operations Research from Stanford ; Friends Solved Nobel Winning Operations Research Problem Client: 华为分仓项目, 中国电力, Boeing, AMEX Client: GM inventory optimization award, GE, Cleveland Clinic
  • 3.
    Content • Operations Research(OR) Intro &Tools • OR’s application : Supply Chain(SC) Design • Supply Chain Design Principles &Tools • Case Study 1 :Velocity Mfg Inc • Case Study 2: Bike Rental System • Case Study 3: New Jersey Pharmacy • Case Study 4 : Amazon(Brief)
  • 4.
    What is OperationsResearch? 运筹帷幄之中,决胜千里之外。--汉高祖刘邦
  • 5.
    “Operations Research is theapplication of advanced analytical methods to help make better decisions. -Wikipedia To Optimize!
  • 6.
    OR was createdand widely used inWW II Aircraft from black to white, 20% closer, 30% more sinkingGerman U-boat 1% to 7% of sunken German U-boat by changing depth charge from 100 ft to 25 ft 2 tubs for washing, 2 tubs for rinsing 3 tubs for washing, 1 tubs for rinsing Saved a lot of time Patrick Blackett: British physicist
  • 7.
    Cornell professor reduced85% of number of students facing three exams in a day 8,000 Students 4,000 Courses # of possible exam schedules? More than 50,000,000,000,000,000 ,000 11 days 66 time slots
  • 8.
    Demo 1: AssignmentProblem Simplify the problem Model Run Code in AMPL Result Assume 4 courses(i: 1,2,3,4), 4 time slot(j:A,B,C,D); Professor will rate time slot for each course from 1(most favorable) to 4(least favorable); Each course will get assigned to a course; Minimize sum of total ranks picked 6, (1C) (2B), (3D),(4A) See Notes for professors’ ranks for each time slot
  • 9.
    Linear Programming Generalized MinimumCost Flow Problem Pure Minimum CostFlow Problem Transportation Problem Assignment Problem Shortest Path Problem Maximum Flow Problem Back toWhere I am from
  • 10.
    Steps in OperationsResearch Problem Definition Model Constructi on Model Solution Validation of the Model Implemen tation Review and Maintain
  • 11.
  • 12.
    Demo 2: SimplifiedCookie Problem Want to know how many trays are in a queue?
  • 13.
  • 14.
  • 15.
    Result See Simulation codes& procedure in excel
  • 16.
    ORTools & Application Linear Programming •Transportation • Assignment • Integer Programming • Goal Programming Probabilistic Technique • Decision Analysis • GameTheory • Markov Analysis • Queuing Theory • Simulation • Forecasting Inventory Technique • Inventory Models • Newsvendor problem • Economic Order Quantity Network Technique • Network Models (CPM/PERT) Non-linear Programming • Dynamic Programming Fleet Assignment at Delta Airlines : Savings of $220,000 per day in 1993 (with 60,000 variables and 40,000 constraints) Gasoline Blending atTexaco : Savings of $30 million annually KeyCorp Service Excellence Management System:Customer processing times were reduced by 53% , resulted in savings of $98 million in 5 years
  • 17.
    OR’S application :Supply Chain Management(SCM) Global SupplyChain of Maersk
  • 18.
    Three Basic Measuresof Process Analysis Immigration Department MBA program Auto company Applications Student Car Approved or rejected cases Graduating class Sales per year Processing time 2 years 60 days Pending cases Total campus population Inventory Flow Unit Flow rate/ throughput FlowTime Inventory Flow rate/throughput : number of flow units going through the process per unit of time FlowTime : time it takes a flow unit to go from the beginning to the end of the process Inventory: the number of flow units in the process at a given moment in time Flow Unit : Customer or Sandwich
  • 19.
    Why is SCMimportant? 10.87 6.68 5.7 3.25 7.99 0 5 10 15 20 25 8-Dec 9-Dec 10-Dec 11-Dec 12-Dec 13-Dec 14-Dec Annual InventoryTurnover Rate for China-US Top E-commerce Companies JD VIPS WALMART JUMEI DANG AMAZON A higher than industry average turnover demonstrates that your business is competitive, while a smaller than industry average turnover shows that there is room for improvement. Global Industry Average is 7.
  • 20.
    Difficulty of SCM 1.Demand Uncertainty 2. Poor physical characteristics 3. Poor information infrastructures 4. Business process not accurately evolve 5. No Decision support system
  • 21.
    Hierarchy of SupplyChain Planning
  • 22.
    Current Supply ChainModels 1. MRP Model Bill of materials(BOM) , Master production schedule Enterprise Resource Planning(ERP) 2. Mathematical Programming-Based Model Newsvendor Problem, Assignment Problem Max flow/Min cut problem, Dynamic Programming, Integer Programming 3. Inventory Model Safety stock, lead time, etc. 4. Advanced Planning and Scheduling System
  • 23.
  • 24.
  • 25.
  • 26.
    Four types ofsupply chain relationship
  • 27.
  • 28.
    Guideline for CollaborativeSupply Chain Design 1. Know the Customer 2. Construct a lean SC that eliminates waste, variability, and uncertainty 3. Build tightly coupled information infrastructure 4. Build tightly coupled business process 5. Construct tightly coupled decision support system 1 2 3 4 5
  • 29.
    Case Study 1: Revitalization ofVelocity Mfg Inc. In 2011, a second tier supplier in the U.S. hydraulic hose Note: Course project
  • 30.
    Case Study 1: Revitalization ofVelocity Mfg Inc.
  • 31.
    Case Study 1: Revitalization ofVelocity Mfg Inc. Current Problems Our Solutions Projected Results
  • 32.
    Summary of Problems •Sales is declining (2010: 89% of 2008) • Lousy quality of products • Material cost is high • RONA is low • Long delivery LeadTime • Net Income / Assets is unacceptably low (2.7%) • Fill Rate is 67%, but should be about 98% • WIP can be reduced • Dividends are unsustainable given current cash flow
  • 33.
    Our Solution Component1: Revised Layout 2
  • 34.
    Our Solution Component1: Revised Layout - Capacity Plan STATIONS Lathe 1 Lathe 2 Proposed CNC Lathe Asmbly Proposed Robot B-Oven 1 B-Oven 2 Test Proposed New Tester Asmbly Inspect Asmbly Inspect Test Proposed New Tester Cln-Dry 1 Cln-Dry 2 Pkg Average Pieces/Lot 21.00 10.00 0 1 0 8 8 6.69 0 3 1.5 1.5 1.5 1.5 4.5 1.5 1.5 1 Run Time/Piece 11.05 11.05 0.00 7 0.00 7.5 7.5 4.5 0.00 23.5 21 22 15 17 21.00 45 45 15 Run Time/Lot 232.05 110.50 0.00 7.00 0.00 60.00 60.00 30.11 0.00 70.50 0.00 0.00 0.00 0.00 94.50 67.50 67.50 15.00 Setup Time/Lot 29.00 5.80 0.00 0.00 0.00 10.00 10.00 5.10 0.00 5.00 7.00 5.00 8.00 5.00 8.00 5.00 5.00 0.00 MTBF 30 30 0 30,000 0 45,000 45,000 75,000 0 65,000 600 80,000 4,000 2,000 2,200 500,000 500,000 50,000 MTTR 5 5 0 3 0 7 7 5 0 13 25 15 180 200 735 1 1 1 Total Time/Shift 720 720 0 720 0 720 720 720 0 720 0 0 0 0 720 720 720 720 Lots/Shift 2.40 5.34 0.00 102.85 0.00 10.28 10.28 20.45 0.00 9.53 0.00 0.00 0.00 0.00 5.37 9.93 9.93 48.00 Run Time/Shift 557.43 590.57 0.00 719.93 0.00 617.06 617.06 615.66 0.00 672.20 0.00 0.00 0.00 0.00 507.49 670.34 670.34 719.99 Setup Time/Shift 69.66 31.00 0.00 0.00 0.00 102.84 102.84 104.30 0.00 47.67 0.00 0.00 0.00 0.00 42.96 49.66 49.66 0.00 Down Time/Shift 92.91 98.43 0.00 0.07 0.00 0.10 0.10 0.04 0.00 0.13 0.00 0.00 0.00 0.00 169.55 0.00 0.00 0.01 Run % 77% 82% 0% 100% 0% 86% 86% 86% 0% 93% 0% 0% 0% 0% 70% 93% 93% 100% Setup % 10% 4% 0% 0% 0% 14% 14% 14% 0% 7% 0% 0% 0% 0% 6% 7% 7% 0% Down % 13% 14% 0% 0% 0% 0% 0% 0% 0% 0% 0% 0% 0% 0% 24% 0% 0% 0% Pieces Out 50.45 53.45 0.00 102.85 0.00 82.27 82.27 136.81 0.00 28.60 0.00 0.00 0.00 0.00 24.17 14.90 14.90 48.00 Number of Active Stations (1=yes, 0=no) 1 1 0 1 0 1 1 1 0 1 0 0 0 0 1 1 1 1 Production By Station (Per Shift) 50.45 53.45 0.00 102.85 0.00 82.27 82.27 136.81 0.00 28.60 0.00 0.00 0.00 0.00 24.17 14.90 14.90 48.00 OPERATIONS 110 120 130 140 210 220 310 320 410 420 430 Production By Operation (Per Shift) 103.89 102.85 164.55 136.81 28.60 999999.00 999999.00 999999.00 24.17 29.79 48.00 SECTORS SECTOR 1 SECTOR 2 SECTOR 3 SECTOR 4 Feasible Run Rate 102.85 28.60 999999.00 24.17 Feed Rate 102.85 24.94 24.72 24.26 Actual Run Rate 102.85 24.94 24.72 24.17 Yield Loss % 3.02% 0.88% 1.83% 2.30% Production By Sector (Assemblies Per Shift) 24.94 24.72 24.26 23.61 2
  • 35.
    Our Solution Component2 : No B/C Supply Chain Policy Historical Demand of different products ofVelocity Mfg Inc 1
  • 36.
    Our solution component3: Machine Job assignment 5
  • 37.
    Acquire production info fromwhite boardStart of Shift Are there still input materials to process? Choose next unit to work on Setup Tester for Current End Fitting Run Test Good Unit? No Yes Place into Scrap Pile and report to plan controller Place into WIP1 and update WIP1 Produce Blanks Assemble Blanks and Elbows Lathe Operators Assemblers Oven and Test Operator Are there still input materials to process? Choose next unit to work on Lathe Operators Assemblers Oven 1 running ? Both Oven in operation? Yes Put end fitting into oven 1 until it’s filled Run Oven Yes No No Put end fitting into oven 2 until it’s filled Lathe 2 operating ? Yes Put blanks into lathe1 until it’s filled Put blanks into lathe2 until it’s filled No End of Shift Run Lathe Sector 1 Shop Floor Operation Plan Update White Board 3
  • 38.
  • 39.
    Case Study 2: Bike Rental System • 6 Bike Stations • 18 Bikes • Simulated effect of changing incentives for people to reposition bike on customer satisfaction rate 5
  • 40.
    Case Study 2: Bike Rental System
  • 41.
    Case Study 3:New Jersey Pharmacy Provide Antivirals to patients Set Patient Travel Range < 25 Miles Ensure Short WaitingTimes at Pharmacies 0 5000 10000 15000 20000 25000 30000 1 14 27 40 53 66 79 92 105 118 131 144 157 170 183 196 209 222 235 248 261 274 287 300 313 326 339 352 Demand Days Actual Historical Annual Demand (Pediatric + Adult) Phase 1: Initiation Phase 2: Peak Phase 3: Resolution
  • 42.
    Reduce the Complexityof the CDC Supply Chain Determining Which Specific Pharmacies to Use (3 out of 3) Divided States into 45 Hexagon Shaped regions Furthest distance <25 miles Unify many inventories into one inventory (governmental policy) Link the hexagons to pharmacy locations and regional population Determine whether regional capacity fits the peak day demand Discovered certain high population hexagons need additional capacity on peak days! (Divide into three phases)
  • 43.
    Example of Ordering(1 of 2) Using Hexagon 4
  • 44.
    Case Study 4: Amazon 亚马逊采取了C2B的模式,基于工程师开发的算法,其可以在用户下单前就 分析出未来一周内哪些产品会走俏?于是增大这些产品的库存。算法包含了 数百个维度,包括目前各产品销售情况、天气、地区局势、温度等等
  • 45.

Editor's Notes

  • #5 战国时期,田忌要和齐威王赛马,比赛的时候,上马对上马,中马对中马,下马对下马。由于齐威王每个等级的马都比田忌的马强一些,所以比赛了几次,田忌都失败了。好朋友孙膑想了个法子,第一场以下马对阵齐威王的上马,输了;第二轮拿上马对中马,赢了;第三轮也赢了;同样的马匹,转败为胜。--出自史记 田忌赛马的故事就用到了运筹学的思想
  • #7 OR even improved the most mundane processes. After observing a long line of soldiers washing their mess kits after a meal, a scientist saw the troops used two tubs to wash their kits and two to rinse them, even though washing took three times longer than rinsing. By providing three tubs for washing and just one to rinse, the bottleneck was eliminated and the line disappeared, saving much valuable time. - See more at: http://www.navyhistory.org/2013/06/book-review-blacketts-war-men-who-defeated-nazi-u-boats-brought-science-art-warfare/#sthash.srW09vV0.dpuf http://en.wikipedia.org/wiki/Operations_research Blackett’s Circus: group of mathematician, biologist, army officer, etc. Later become first official Operations Research Group Contribution: Change color of aircraft to White to increase 30% of sinking a German U-boat Change Depth Charge from 100ft to 25ft, sunk 7% instead of 1% of German U-boat Reduce bullets to shoot down a aircraft from 20,000 to 4,000 Save soldiers’ washing time by remove bottleneck
  • #8 News : http://www.orie.cornell.edu/news/index.cfm?news_id=62099&news_back=news_archive%26y%3D2005 Note : 66 is by estimate
  • #9 AMPL: Modeling Language for Mathematical Programming, also accessible in Python param: E : c := 1 A 4 1 B 3 1 C 2 1 D 1 2 A 3 2 B 1 2 C 2 2 D 4 3 A 1 3 B 3 3 C 4 3 D 2 4 A 1 4 B 2 4 C 3 4 D 4;
  • #17 http://www.labyrinth.net.au/~bdc/ORMfirst.pdf http://www.pitt.edu/~jrclass/or/or-intro.html#Harris
  • #18 http://www.maersk.com/en/industries/transport
  • #19 Intro to Supply Chain Management: http://www.youtube.com/watch?v=Mi1QBxVjZAw Intro to Operation Management by Upenn : https://class.coursera.org/whartonoperations-004/lecture/2
  • #20 Data Source : http://www.gurufocus.com/term/InventoryTurnover/EBAY/Inventory%2BTurnover/eBay%2BInc the Inventory turnover is a measure of the number of times inventory is sold or used in a time period such as a year. The equation for inventory turnover equals the Cost of goods sold divided by the average inventory.
  • #28 http://logisticsviewpoints.com/2011/01/31/unraveling-the-true-meaning-of-supply-chain-collaboration/
  • #30 Hydraulic hose : 液压软管
  • #33 JT
  • #38 YL
  • #44 15.5% of total population(1,364763) Excess Inventory at the end of 70,000 stocks