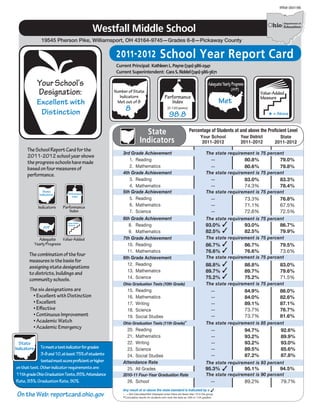
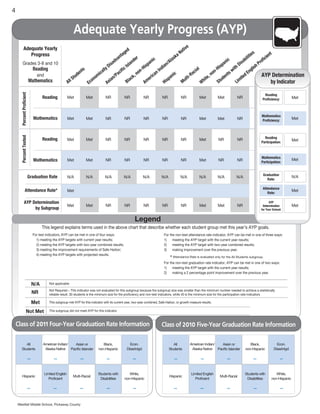
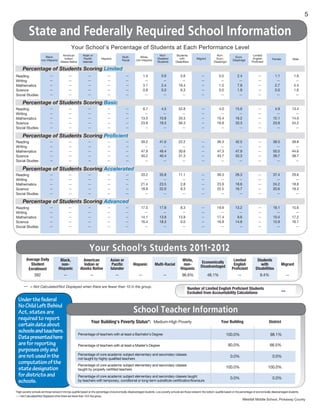
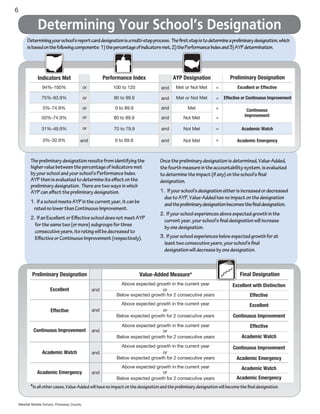
The report card summarizes performance data for Westfall Middle School for the 2011-2012 school year. It shows that the school met 8 out of 8 state indicators and achieved a Performance Index of 98.8. It also met standards for Adequate Yearly Progress in reading and math proficiency and participation rates as well as attendance. Test results indicate proficiency rates at or above 75% on most assessments administered in grades 3-8 and 10. The Value-Added measure indicates growth at or above expected levels in most tested subjects and grades.
Westfall Middle School in Williamsport, Ohio received a designation of "Effective" for the 2009-2010 school year based on meeting 6 out of 8 state indicators. The school achieved a performance index score of 95.2 and received a positive value-added measure. Test results showed proficiency rates at or above state averages for most grades and subjects assessed. The attendance rate of 94.8% and 2008-2009 graduation rate of 96.5% both met state standards.
Westfall High School received an "Effective" designation for the 2011-2012 school year. It met 9 out of 12 state indicators, with a performance index score of 96.7. Proficiency levels at Westfall were generally close to or above both district and state averages across various subject tests for grades 3 through 8 and high school. The attendance rate was 94.2% and the four-year graduation rate was not reported.
The report card summarizes the 2011-2012 performance of the Westfall Local School District in Pickaway County, Ohio. The district met 19 of 26 state indicators and earned a performance index score of 96.6 points. Subject proficiency rates for grades 3-8 and high school graduation tests were mostly above similar districts and state averages. The district did not meet adequate yearly progress due to not meeting reading and math proficiency targets for all students.
An Alternative Method to Rate Teacher PerformanceNWEA
An Alternative Method to Rate Teacher Performance
Patricio A. Rojas, PH.D. Director of Research, Data & Assessment, Los Lunas, NM
Fusion 2012, the NWEA summer conference in Portland, Oregon
This session will provide participants the opportunity to experience an alternative method of rating teachers, under new regulations of New Mexico. This is an updated version of the work presented last year in FUSION 2011. The alternative method is needed because we do not have growth points in the year 2010-2011 in New Mexico.
Learning outcome:
- Learn easy graphs to analyze growth and how to rate teacher performance without using grown points.
Los Lunas is located 35 miles south from Albuquerque, the district has 9,000 students; 17 schools (3 high schools, 2 middle schools, and 12 elementary schools). The district is one of the few nationally accredited districts in the nation. We have been using MAP as short cycle assessment for the last six years. MAP scores are an important piece of data used to rate both schools and teachers.
Audience:
- Experienced data user
- District leadership
- Curriculum and Instruction
This document summarizes key statistics and trends related to education in India. It discusses literacy rates by gender and state over time, transition rates from primary to secondary school, expenditures and enrollments at different education levels, the impact of education on society, and predictions for future literacy rates in India. Charts are provided showing literacy rate growth, comparisons of male and female literacy rates, transition rates from primary to secondary school, and enrollments over time at primary, secondary, and tertiary levels.
This study evaluated the impact of the iStartSmart educational technology system on the language/literacy and math skills of preschool children compared to children without access to the system. Children using iStartSmart scored significantly higher on standardized tests of early literacy and math readiness at the end of the school year. Improvement was correlated with time spent using iStartSmart activities. The results suggest iStartSmart provides effective support for developing the core skills children need to be successful in school.
This document provides instructions for accessing and submitting requests to the Westfall Help Desk for maintenance and technology issues. It outlines 8 steps for submitting a request, including entering contact information, describing the issue and location, selecting a request type, and providing a password before submitting. It also describes how to create a new account with first and last name and email address. The help desk can be used to request assistance with general grounds, maintenance, technology, or other issues.
The document provides instructions for installing and using SMART Response, an interactive response system. It discusses hardware components, software installation, creating assessments, conducting classes, reviewing results, and maintenance. Safety warnings are provided to prevent injury and damage. Environmental compliance information is also included regarding waste disposal and restricted substances.
This document provides a summary of various Google tools and other tech tools that can be used in the classroom, including Google Earth, Google Maps, Google SketchUp, Google Drive, iTunes U, SafeShare.TV, Puffin browser, Reflector, Smart Exchange, Promethean Planet, Prezi, PBS Learning Media, Archive.org, Dropbox, GeoGebra, and Khan Academy. The document encourages educators to explore these tools to find useful applications for enhancing classroom instruction with technology.
The document outlines the schedule for a Back to School event on August 17th, including a 5K run/walk starting at 8am, a football scrimmage at 9am, and meeting fall sports teams and coaches. From 10am activities will be held at Westfall Mall, including visits from community groups, distribution of school supplies bags, and information on schedules, fees and free hotdogs and drinks.
Westfall in the News- Report card ratingJD Williamson
Four local school districts in Circleville, Ohio earned excellent or excellent with distinction ratings on their 2011-2012 state report cards. Teays Valley and Logan Elm both earned the highest rating of excellent with distinction for the second consecutive year, while Circleville and Westfall improved to excellent. The report cards measure performance in areas like state test scores, attendance, and graduation rates. District leaders credited the successes to factors like focused instruction in reading and math, collaborative teaching, and strong relationships between schools and students.
The document summarizes a third grade class field trip to the Circleville Pumpkin Show. During the field trip, the class learned about various aspects of the Pumpkin Show from presenters including the coordinator of parades, fire chief, security head, mayor, baker of the giant pumpkin pie, pumpkin mascot, parade announcer, pumpkin weighing contest, pumpkin displays, and street art show. The class saw over 100,000 pounds of pumpkins on display and each student received a free gourd. They concluded the fun-filled day by eating pumpkin donuts back at school.
Westfall Local School District Strategic PlanJD Williamson
The strategic plan outlines the mission, objectives, parameters, and strategies of the Westfall Local School District. The mission is to produce well-rounded students who are academically and technically proficient, as well as career or college ready. Objectives include having 100% of students performing at or above grade level and being responsible community members. Parameters state unsafe, insecure, or unhealthy behavior or employees will not be tolerated. Strategies involve partnering with the community, aligning PreK-12 instruction, effective communication, and developing student health and life skills.
The document lists school fees for various classes and activities at the Westfall Local School District. At the high school, fees range from $3 for AP English to $100 for band camp. Middle school fees are $8.99 or $10 per class for art, science, and language arts. Elementary school fees are a flat $35 for grades K through 5. The fees were approved on July 16, 2012.
The document summarizes data on the prevalence of overweight and obesity among children and adolescents in the United States. It finds that:
1) Approximately 35% of children and adolescents were overweight or obese, with 21% being obese.
2) Rates of overweight and obesity were similar between boys and girls, though boys had slightly higher rates of obesity.
3) The majority of children and adolescents (63%) had a normal BMI, while 35% were overweight or obese and 2% were underweight.
The document is a user guide for parents on the ProgressBook ParentAccess website. It provides instructions on how parents can log in, navigate the site, and view key student information like grades, assignments, attendance, schedules, and communication from teachers. The guide also explains how parents can access classroom information and submit course requests if the school allows online course selection.
The document discusses the many uses of an overhead projector in a classroom setting. It can be used to display paper printouts, slides, transparencies, photos from books, and three-dimensional objects. It allows teachers to demonstrate concepts like filling out forms, scientific experiments, math problems, and more for students to see. Students can also display their own work under the camera for the class. The overhead projector engages students and helps teachers demonstrate material in multiple disciplines like science, writing, art, social studies, and more.
Tax Update and Financial Health of the District JD Williamson
The Westfall Local School District will hold a tax update and financial health meeting on February 16, 2012 from 6:30 to 8:30 pm at the Westfall Elementary School Cafetorium. Mr. Larry Gearhardt and Ms. Melissa Betz will discuss tax assessments and where tax money goes. Mr. Scott Hiles will provide an overview of the district's current financial health and explain the Five Year Forecast. Ms. Cara Riddel will present information about the Strategic Planning process.
Westfall Web Resources for February 2012JD Williamson
This document provides a summary of various educational resources that JD Williamson, the Technology Coordinator at Westfall Local Schools, has curated for teachers. It includes brief descriptions of resources for teaching math, science, language arts, social studies and more from sources like National Geographic, SchoolTube, Smithsonian, Thinkfinity, Illuminations, Ohio Resource Center, ArtsEdge, EDSITEment, Science NetLinks, and Readwritethink. Links are provided to access each of these resources.
JD Williamson, the Technology Coordinator at Westfall Local Schools, provides instructions on how to send a secure print job from a computer to the Xerox Red Wing Printer. The steps include clicking print, selecting the printer and properties, choosing secure print from the drop down menu, entering a 4-10 digit passcode, and clicking OK three times to send the job. At the printer, users select their job name and enter the passcode to release the secure print job for printing.
This document provides a summary of performance data for Westfall High School in Pickaway County, Ohio. It includes statistics on student enrollment, demographics, test scores, graduation rates, and other metrics. Overall, the school has an enrollment of around 500 students and graduation rates around 85-90%. Test scores meet or exceed state standards for most subjects tested, though some areas like math and science saw lower passing rates.
The Pickaway HELPS organization is sponsoring two ACT prep workshops on March 14th and 17th to help students preparing to take the ACT in April or June. The workshops, led by an ACT educator, will use "The Real ACT Prep Guide" workbook and cover practice questions, test-taking tips, reading techniques, and time management. Students can reserve a seat for $40 by contacting Christy Mills or sending an email, with payment due on the day of the workshop.
This document outlines the parent involvement policy of Westfall Middle School. It includes activities to involve parents in developing the policy, such as an annual meeting and collaboration with the Parent Advisory Council. The policy aims to build the school's and parents' capacity for strong involvement to improve student achievement. Key activities include distributing a Title 1 handbook, conducting parent conferences and training, and taking actions to involve parents in jointly developing the building-wide parent involvement policy.
Westfall Elementary School recognizes that parent involvement is crucial to student achievement. The school will build the capacity for strong parent involvement through various activities and ensure effective partnership among the school, parents, and community. These activities include an annual Title I parent meeting, developing a school-parent compact, providing assistance to help parents understand academic standards and test results, establishing a Parent Advisory Council, and distributing parent involvement policies. The school will also involve parents in jointly developing the parent involvement policy through an annual meeting and staff training.
The document provides instructions and important safety information for the SMART Document Camera 330. It includes:
1. An overview of the document camera's parts and included software.
2. Directions for setting up the document camera and connecting it to other devices.
3. Information on using the document camera in different viewing modes and menus.
4. Troubleshooting tips and customer support details.
Leveraging Generative AI to Drive Nonprofit InnovationTechSoup
In this webinar, participants learned how to utilize Generative AI to streamline operations and elevate member engagement. Amazon Web Service experts provided a customer specific use cases and dived into low/no-code tools that are quick and easy to deploy through Amazon Web Service (AWS.)
Andreas Schleicher presents PISA 2022 Volume III - Creative Thinking - 18 Jun...EduSkills OECD
Andreas Schleicher, Director of Education and Skills at the OECD presents at the launch of PISA 2022 Volume III - Creative Minds, Creative Schools on 18 June 2024.
🔥🔥🔥🔥🔥🔥🔥🔥🔥
إضغ بين إيديكم من أقوى الملازم التي صممتها
ملزمة تشريح الجهاز الهيكلي (نظري 3)
💀💀💀💀💀💀💀💀💀💀
تتميز هذهِ الملزمة بعِدة مُميزات :
1- مُترجمة ترجمة تُناسب جميع المستويات
2- تحتوي على 78 رسم توضيحي لكل كلمة موجودة بالملزمة (لكل كلمة !!!!)
#فهم_ماكو_درخ
3- دقة الكتابة والصور عالية جداً جداً جداً
4- هُنالك بعض المعلومات تم توضيحها بشكل تفصيلي جداً (تُعتبر لدى الطالب أو الطالبة بإنها معلومات مُبهمة ومع ذلك تم توضيح هذهِ المعلومات المُبهمة بشكل تفصيلي جداً
5- الملزمة تشرح نفسها ب نفسها بس تكلك تعال اقراني
6- تحتوي الملزمة في اول سلايد على خارطة تتضمن جميع تفرُعات معلومات الجهاز الهيكلي المذكورة في هذهِ الملزمة
واخيراً هذهِ الملزمة حلالٌ عليكم وإتمنى منكم إن تدعولي بالخير والصحة والعافية فقط
كل التوفيق زملائي وزميلاتي ، زميلكم محمد الذهبي 💊💊
🔥🔥🔥🔥🔥🔥🔥🔥🔥
This presentation was provided by Racquel Jemison, Ph.D., Christina MacLaughlin, Ph.D., and Paulomi Majumder. Ph.D., all of the American Chemical Society, for the second session of NISO's 2024 Training Series "DEIA in the Scholarly Landscape." Session Two: 'Expanding Pathways to Publishing Careers,' was held June 13, 2024.
How Barcodes Can Be Leveraged Within Odoo 17Celine George
In this presentation, we will explore how barcodes can be leveraged within Odoo 17 to streamline our manufacturing processes. We will cover the configuration steps, how to utilize barcodes in different manufacturing scenarios, and the overall benefits of implementing this technology.
Elevate Your Nonprofit's Online Presence_ A Guide to Effective SEO Strategies...TechSoup
Whether you're new to SEO or looking to refine your existing strategies, this webinar will provide you with actionable insights and practical tips to elevate your nonprofit's online presence.
This presentation was provided by Rebecca Benner, Ph.D., of the American Society of Anesthesiologists, for the second session of NISO's 2024 Training Series "DEIA in the Scholarly Landscape." Session Two: 'Expanding Pathways to Publishing Careers,' was held June 13, 2024.
1. IRN# 064196
Westfall Middle School
19545 Pherson Pike, Williamsport, OH 43164-9745—Grades 6-8—Pickaway County
2011-2012 School Year Report Card
Current Principal: Kathleen L. Payne (740) 986-2941
Current Superintendent: Cara S. Riddel (740) 986-3671
Your School’s
Designation: Number of State
Indicators Performance
Value-Added
Measure
Excellent with Met out of 8 Index Met
Distinction 8 (0-120 points)
Value-Added
98.8 Component
Score = Above
= met
+ = above
State – = below
Percentage of Students at and above the Proficient Level
Your School Your District State
Indicators 2011-2012 2011-2012 2011-2012
The School Report Card for the
3rd Grade Achievement The state requirement is 75 percent
2011-2012 school year shows
1. Reading -- 80.8% 79.0%
the progress schools have made
2. Mathematics -- 80.6% 79.8%
based on four measures of
performance. 4th Grade Achievement The state requirement is 75 percent
3. Reading -- 83.0% 83.3%
4. Mathematics -- 74.3% 78.4%
State
Performance
5th Grade Achievement The state requirement is 75 percent
Indicators Index
5. Reading -- 73.3% 76.8%
Indicators Performance 6. Mathematics -- 71.1% 67.5%
Index 7. Science -- 72.6% 72.5%
6th Grade Achievement The state requirement is 75 percent
93.0% 93.0% 86.7%
Value-Added
AYP
Measure 8. Reading
Value-Added
Component
Score
9. Mathematics 82.5% 82.5% 79.9%
Adequate
+
–
= met
= above
= below
Value-Added 7th Grade Achievement The state requirement is 75 percent
Yearly Progress 10. Reading 86.7% 86.7% 79.5%
11. Mathematics 76.6% 76.6% 73.6%
The combination of the four The state requirement is 75 percent
8th Grade Achievement
measures is the basis for
12. Reading 88.8% 88.8% 83.0%
assigning state designations
13. Mathematics 89.7% 89.7% 79.6%
to districts, buildings and
community schools. 14. Science 75.2% 75.2% 71.5%
Ohio Graduation Tests (10th Grade) The state requirement is 75 percent
The six designations are 15. Reading -- 84.9% 86.0%
• Excellent with Distinction 16. Mathematics -- 84.0% 82.6%
• Excellent 17. Writing -- 89.1% 87.1%
• Effective 18. Science -- 73.7% 76.7%
• Continuous Improvement 19. Social Studies -- 73.7% 81.6%
• Academic Watch Ohio Graduation Tests (11th Grade)* The state requirement is 85 percent
• Academic Emergency 20. Reading -- 94.7% 92.6%
21. Mathematics -- 93.2% 89.9%
State 22. Writing -- 93.2% 93.0%
Indicators To meet a test indicator for grades 23. Science -- 89.5% 85.6%
3-8 and 10, at least 75% of students 24. Social Studies -- 87.2% 87.8%
tested must score proficient or higher Attendance Rate The state requirement is 93 percent
on that test. Other indicator requirements are: 25. All Grades 95.3% 95.1% 94.5%
11th grade Ohio Graduation Tests, 85%; Attendance 2010-11 Four-Year Graduation Rate The state requirement is 90 percent
Rate, 93%; Graduation Rate, 90%. 26. School -- 89.2% 79.7%
Any result at or above the state standard is indicated by a .
On the Web: reportcard.ohio.gov -- = Not Calculated/Not Displayed when there are fewer than 10 in the group.
* Cumulative results for students who took the tests as 10th or 11th graders.
2. 2
Your School’s Assessment Results Over Time
All students in the school for a full academic year are included in the results.
State
Indicators
The State
Indicators
are based on state
assessments, as well
as on attendance and
graduation rates.
To earn an indicator
for Achievement or
Graduation Tests, at
least 75% of students
must reach proficient
or above for the given
assessment. For
the 11th grade Ohio
Graduation Tests
indicators, a cumulative
85% passage rate for each
assessment is required.
Westfall Middle School, Pickaway County
3. 3
Performance Index
The Performance
Performance Index Calculations Index reflects the
Performance
for the 2011-2012 School Year Index achievement of every student
enrolled for the full academic
Performance Level Across Grades year. The Performance Index
3-8 and 10 for All Tested Subjects
Percentage X Weight = Points is a weighted average that includes
(Includes every student enrolled in
the school for a full academic year) all tested subjects and grades and
untested students. The greatest
Untested 0.0 X 0.0 = 0.0 weight is given to advanced scores
(1.2); the weights decrease for each
Limited 2.4 X 0.3 = 0.7
performance level and a weight of
Basic 13.0 X 0.6 = 7.8 zero is given to untested students.
This results in a scale from 0 to 120
Proficient 42.7 X 1.0 = 42.7 points. The Performance Index can be
Accelerated = 29.0
compared across years to show
26.4 X 1.1
school achievement trends.
Advanced 15.4 X 1.2 = 18.5
Performance Index Over Time
Your School’s Performance Index 98.8 2011-2012 2010-2011 2009-2010
98.8 96.7 95.2
Value-Added Measure Value-Added
Component
Score
= met
+ = above
Scores reflect grade level and overall composite
– = below
Overall Composite ratings for the 2011-2012 school year.
Grade 4 Grade 5 Grade 6 Grade 7 Grade 8
Reading
Mathematics
Note: Value-Added results are computed only for buildings that include students in grades 4 through 8.
Value-Added Legend
Measure
Your school’s Value-Added rating represents the progress your
school has made with its students since last school year. + = Above
d
Expected Growth
e
w
In contrast, achievement scores represent students’ performance
at a point in time. A score of “Above” indicates greater than one year of = Met
Expected Growth
progress has been achieved; “Met” indicates one year of progress has
been achieved; “Below” indicates less than one year of progress has been
achieved. Value-Added results are computed only for buildings that include
- = Below
Expected Growth
sufficient testing data for students in any grade 4 through 8.
On the Web: reportcard.ohio.gov
Westfall Middle School, Pickaway County
4. 4
Adequate Yearly Progress (AYP)
e
Adequate Yearly ed ativ
Progress tag aN ities nt
va
n
de
r
las
k
bil cie
ad n anic /A nic isa rofi
Grades 3-8 and 10
Di
s
I sla isp ian sp
a D hP
Reading y
ific
H Ind al Hi ith lis
n ts all ac
n- ci n- w ng
de mi
c no ica
n ic Ra no ts dE AYP Determination
and u /P k, an ti- e, en ite
St on
o n
lac me
r
isp
l hit ud
Mathematics All Ec A sia B A H Mu W St Lim by Indicator
Percent Proficient
Reading
Reading Met Met NR NR NR NR NR Met Met NR Proficiency: Met
Mathematics
Mathematics Met Met NR NR NR NR NR Met Met NR Proficiency:
Met
Percent Tested
Reading Reading
Met Met NR NR NR NR NR Met NR NR Met
Participation:
Mathematics
Mathematics Met Met NR NR NR NR NR Met NR NR Met
Participation:
Graduation
Graduation Rate N/A N/A N/A N/A N/A N/A N/A N/A N/A N/A
Rate:
N/A
Attendance
Attendance Rate* Met Rate:
Met
AYP Determination AYP
Met Met NR NR NR NR NR Met Met NR Determination Met
by Subgroup for Your School:
Legend
This legend explains terms used in the above chart that describe whether each student group met this year’s AYP goals.
For test indicators, AYP can be met in one of four ways: For the non-test attendance rate indicator, AYP can be met in one of three ways:
1) meeting the AYP targets with current year results; 1) meeting the AYP target with the current year results;
2) meeting the AYP targets with two-year combined results; 2) meeting the AYP target with two-year combined results;
3) meeting the improvement requirements of Safe Harbor; 3) making improvement over the previous year.
4) meeting the AYP targets with projected results.
* Attendance Rate is evaluated only for the All Students subgroup.
For the non-test graduation rate indicator, AYP can be met in one of two ways:
1) meeting the AYP target with the current year results;
2) making a 2 percentage point improvement over the previous year.
N/A Not applicable.
Not Required – This indicator was not evaluated for this subgroup because the subgroup size was smaller than the minimum number needed to achieve a statistically
NR reliable result. 30 students is the minimum size for the proficiency and non-test indicators, while 40 is the minimum size for the participation rate indicators.
Met This subgroup met AYP for this indicator with its current year, two-year combined, Safe Harbor, or growth measure results.
Not Met This subgroup did not meet AYP for this indicator.
Class of 2011 Four-Year Graduation Rate Information Class of 2010 Five-Year Graduation Rate Information
All American Indian/ Asian or Black, Econ. All American Indian/ Asian or Black, Econ.
Students Alaska Native Pacific Islander non-Hispanic Disadvtgd Students Alaska Native Pacific Islander non-Hispanic Disadvtgd
-- -- -- -- -- -- -- -- -- --
Limited English Students with White, Limited English Students with White,
Hispanic Multi-Racial Hispanic Multi-Racial
Proficient Disabilities non-Hispanic Proficient Disabilities non-Hispanic
-- -- -- -- -- -- -- -- -- --
Westfall Middle School, Pickaway County
5. 5
State and Federally Required School Information
Your School’s Percentage of Students at Each Performance Level
American Asian or Non- Students Non- Limited
Black, Multi- White, Econ.
Indian/ Pacific Hispanic Disabled with Migrant Econ. English Female Male
non-Hispanic Racial non-Hispanic Disadvtgd
Alaska Native Islander Students Disabilities Disadvtgd Proficient
Percentage of Students Scoring Limited
Reading -- -- -- -- -- 1.4 0.9 5.6 -- 0.5 2.4 -- 1.1 1.6
Writing -- -- -- -- -- -- -- -- -- -- -- -- -- --
Mathematics -- -- -- -- -- 3.1 2.4 19.4 -- 1.0 7.8 -- 2.7 5.4
Science -- -- -- -- -- 0.8 0.0 6.3 -- 0.0 1.9 -- 0.0 1.6
Social Studies -- -- -- -- -- -- -- -- -- -- -- -- -- --
Percentage of Students Scoring Basic
Reading -- -- -- -- -- 8.7 4.5 52.8 -- 4.0 15.6 -- 4.9 13.4
Writing -- -- -- -- -- -- -- -- -- -- -- -- -- --
Mathematics -- -- -- -- -- 13.5 10.8 33.3 -- 10.4 16.2 -- 12.1 14.0
Science -- -- -- -- -- 23.8 19.3 56.3 -- 16.9 33.3 -- 23.8 24.2
Social Studies -- -- -- -- -- -- -- -- -- -- -- -- -- --
Percentage of Students Scoring Proficient
Reading -- -- -- -- -- 39.2 41.0 22.2 -- 36.3 42.5 -- 38.5 39.8
Writing -- -- -- -- -- -- -- -- -- -- -- -- -- --
Mathematics -- -- -- -- -- 47.9 49.4 30.6 -- 47.3 47.9 -- 50.5 44.6
Science -- -- -- -- -- 40.2 40.4 31.3 -- 43.7 33.3 -- 39.7 38.7
Social Studies -- -- -- -- -- -- -- -- -- -- -- -- -- --
Percentage of Students Scoring Accelerated
Reading -- -- -- -- -- 33.2 35.8 11.1 -- 39.3 26.3 -- 37.4 29.6
Writing -- -- -- -- -- -- -- -- -- -- -- -- -- --
Mathematics -- -- -- -- -- 21.4 23.5 2.8 -- 23.9 18.6 -- 24.2 18.8
Science -- -- -- -- -- 18.9 22.0 6.3 -- 22.5 16.7 -- 20.6 19.4
Social Studies -- -- -- -- -- -- -- -- -- -- -- -- -- --
Percentage of Students Scoring Advanced
Reading -- -- -- -- -- 17.5 17.8 8.3 -- 19.9 13.2 -- 18.1 15.6
Writing -- -- -- -- -- -- -- -- -- -- -- -- -- --
Mathematics -- -- -- -- -- 14.1 13.9 13.9 -- 17.4 9.6 -- 10.4 17.2
Science -- -- -- -- -- 16.4 18.3 0.0 -- 16.9 14.8 -- 15.9 16.1
Social Studies -- -- -- -- -- -- -- -- -- -- -- -- -- --
Your School’s Students 2011-2012
Average Daily Black, American Asian or White, Limited Students
Student Economically
non- Indian or Pacific Hispanic Multi-Racial non- English with Migrant
Disadvantaged
Enrollment Hispanic Alaska Native Islander Hispanic Proficient Disabilities
392 -- -- -- -- -- 96.6% 48.1% -- 9.4% --
-- = Not Calculated/Not Displayed when there are fewer than 10 in the group.
Number of Limited English Proficient Students
Excluded from Accountability Calculations --
Under the federal
No Child Left Behind
Act, states are School Teacher Information
required to report
Your Building’s Poverty Status*: Medium-High Poverty Your Building District
certain data about
schools and teachers. Percentage of teachers with at least a Bachelor’s Degree 100.0% 98.1%
Data presented here
are for reporting Percentage of teachers with at least a Master’s Degree 80.0% 66.5%
purposes only and
are not used in the Percentage of core academic subject elementary and secondary classes
not taught by highly qualified teachers
0.0% 0.0%
computation of the Percentage of core academic subject elementary and secondary classes
state designation 100.0% 100.0%
taught by properly certified teachers
for districts and Percentage of core academic subject elementary and secondary classes taught 0.0% 0.0%
schools. by teachers with temporary, conditional or long-term substitute certification/licensure
*High-poverty schools are those ranked in the top quartile based on the percentage of economically disadvantaged students. Low-poverty schools are those ranked in the bottom quartile based on the percentage of economically disadvantaged students.
-- = Not Calculated/Not Displayed when there are fewer than 10 in the group.
Westfall Middle School, Pickaway County
6. 6
Determining Your School’s Designation
Determining your school’s report card designation is a multi-step process. The first step is to determine a preliminary designation, which
is based on the following components: 1) the percentage of indicators met, 2) the Performance Index and 3) AYP determination.
Indicators Met Performance Index AYP Designation Preliminary Designation
94%-100% or 100 to 120 and Met or Not Met = Excellent or Effective
75%-93.9% or 90 to 99.9 and Met or Not Met = Effective or Continuous Improvement
0%-74.9% or 0 to 89.9 and Met = Continuous
50%-74.9% or 80 to 89.9 and Not Met = Improvement
31%-49.9% or 70 to 79.9 and Not Met = Academic Watch
0%-30.9% and 0 to 69.9 and Not Met = Academic Emergency
The preliminary designation results from identifying the Once the preliminary designation is determined, Value-Added,
higher value between the percentage of indicators met the fourth measure in the accountability system, is evaluated
by your school and your school’s Performance Index. to determine the impact (if any) on the school’s final
AYP then is evaluated to determine its effect on the designation.
preliminary designation. There are two ways in which
AYP can affect the preliminary designation. 1. If your school’s designation either is increased or decreased
due to AYP, Value-Added has no impact on the designation
1. If a school meets AYP in the current year, it can be and the preliminary designation becomes the final designation.
rated no lower than Continuous Improvement.
2. If your school experiences above expected growth in the
2. If an Excellent or Effective school does not meet AYP current year, your school’s final designation will increase
for the same two (or more) subgroups for three by one designation.
consecutive years, its rating will be decreased to
Effective or Continuous Improvement (respectively). 3. If your school experiences below expected growth for at
least two consecutive years, your school’s final
designation will decrease by one designation.
Preliminary Designation Value-Added Measure* Value-Added
Component
Score
Final Designation
= met
Above expected growth in the current year
+ = above
– = below
Excellent with Distinction
Excellent and or
Below expected growth for 2 consecutive years Effective
Above expected growth in the current year Excellent
Effective and or
Below expected growth for 2 consecutive years Continuous Improvement
Above expected growth in the current year Effective
Continuous Improvement and or
Below expected growth for 2 consecutive years Academic Watch
Above expected growth in the current year Continuous Improvement
Academic Watch and or
Below expected growth for 2 consecutive years Academic Emergency
Above expected growth in the current year Academic Watch
Academic Emergency and or
Below expected growth for 2 consecutive years Academic Emergency
*In all other cases, Value-Added will have no impact on the designation and the preliminary designation will become the final designation.
Westfall Middle School, Pickaway County
7. 7
The National Assessment of Educational Progress (NAEP),
often referred to as “The Nation’s Report Card,” is the only nationally representative and
continuing assessment that enables the comparison of performance in Ohio and other states
in various subject areas. Schools and students within each state are selected randomly to
be a part of the assessment. Not all students in the state or in a particular school take the
assessment. Data are reported at the state level only, and there are no individual student or
even school summary results. The assessments are conducted in mathematics, reading, science,
writing, the arts, civics, economics, geography and U.S. history.
To view Ohio’s most recent
NAEP results, go to:
http://education.ohio.gov
and search for key word “NAEP”
Westfall Middle School, Pickaway County