Download to read offline

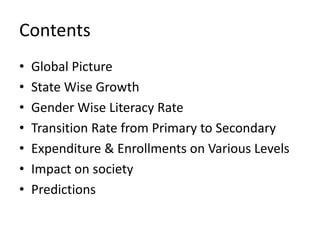
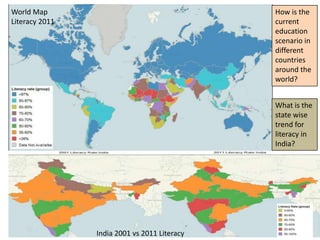
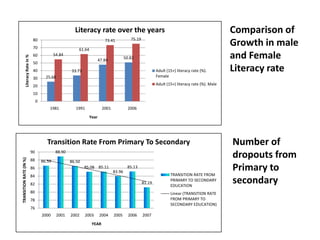
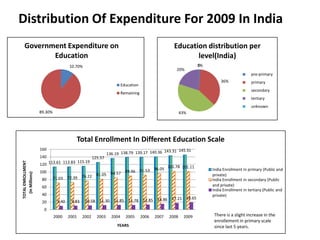
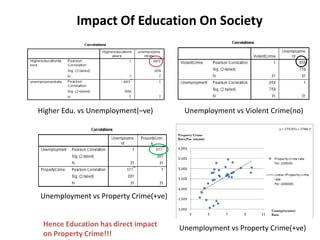
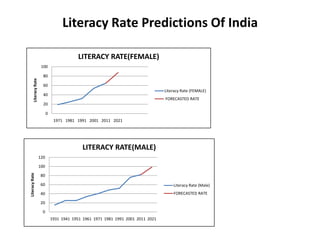


This document summarizes key statistics and trends related to education in India. It discusses literacy rates by gender and state over time, transition rates from primary to secondary school, expenditures and enrollments at different education levels, the impact of education on society, and predictions for future literacy rates in India. Charts are provided showing literacy rate growth, comparisons of male and female literacy rates, transition rates from primary to secondary school, and enrollments over time at primary, secondary, and tertiary levels.


![Vietnam market research topline viettrack mar 2010 - e [compatibility mode]](https://cdn.slidesharecdn.com/ss_thumbnails/vietnammarketresearchtopline-viettrackmar2010-ecompatibilitymode-100514050851-phpapp02-thumbnail.jpg?width=640&height=640&fit=bounds)

![Vietnam market research topline viettrack mar 2010 - e [compatibility mode]](https://cdn.slidesharecdn.com/ss_thumbnails/vietnammarketresearchtopline-viettrackmar2010-ecompatibilitymode-101230031233-phpapp01-thumbnail.jpg?width=640&height=640&fit=bounds)


