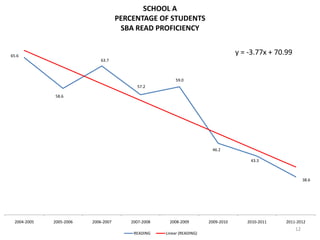
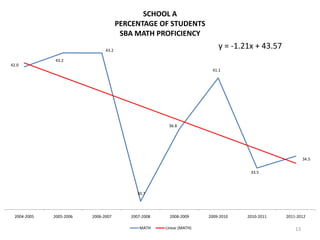
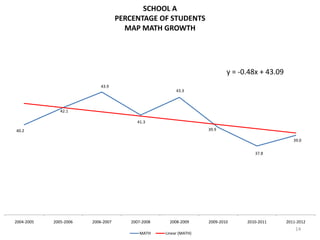
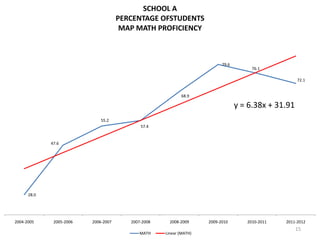
SlideShare a Scribd company logo
An Alternative Method to Rate
School and Teacher Performance

               By Patricio A. Rojas, Ph.D.
       Associate Faculty at University of Phoenix
                   Albuquerque, NM
      Director of Research, Data, and Assessment
             Los Lunas Schools, NM
                       June 2012
BACKGROUND
• Director of Research, Data, and Assessment, Department of Curriculum
  and Instruction, Los Lunas Schools, Los Lunas – NM.

• Member of AAAC (Accountability and Assessment Advisory
  Committee), nominated by the office of the Education Secretary of
  State.

• New Mexico State Coordinator for the Math EAG (Enhancement
  Assessment Grant) Project, nominated by the Education Secretary of
  State.

• Associate Professor at University of Phoenix, Albuquerque – NM.

• Faculty consulting for:
    – San Jose State University, San Jose, CA
    – Universidad de Don Bosco, El Salvador.
    – Universidad Catolica del Norte, Antofagasta, Chile.

                                                                       2
PRELIMINARIES
The legislation for No Child Left behind Act
was proposed by President George W. Bush on
January 23, 2001. It was coauthored by
Representatives Boehner (R-OH), Miller (D-
CA), and Senator Gregg (R-NH). The United
States House of Representatives passed the
bill on May 23, 2001 (voting 384–45), and the
United States Senate passed it on June
14, 2001 (voting 91–8). President Bush signed
it into law on January 8, 2002.

                                            3
No Child Left Behind
No Child Left Behind requires all government-run
schools receiving federal funding to administer a
state-wide standardized test (all students take the
same test under the same conditions) annually to
all students. The students' scores are used to
determine whether the school/teacher has taught
the students well. Schools which receive Title I
funding through the Elementary and Secondary
Education Act of 1965 must make Adequate Yearly
Progress (AYP) in test scores (e.g. each year, its fifth
graders must do better on standardized tests than
the previous year's fifth graders).
                                                       4
RESEARCH
• Research shows that every year fewer schools are
  making AYP using SBA-Proficiency model. In
  2006, 29% of schools in the nation did not make
  AYP; last year 2011, 35% did not make AYP, and
  the forecast for 2012, indicates that the
  percentage of schools not making AYP will be
  45%. Source: CEP (Center on Education
  Policy, Dec 2011)
• In 2006, 54% of districts in New Mexico did not
  make AYP; last year 2011, 80% did not make
  AYP, and the forecast for 2012, indicates that the
  percentage of schools not making AYP will be
  85%. Source: CEP (Center on Education
  Policy, Dec 2011)                                5
NCLB WAIVERS
• Obviously, the “attainment proficiency model“
  or SBA-Proficiency model is not working at
  national/state/ district level neither is the
  growth model, using either SBA or MAP scores.
• With the addition of eight new states, so
  far, we have 19 states on waivers, while
  another 17 states and the District of
  Columbia are under review.
• States granted waivers are exempt from
  the laws’ requirement that all students
  pass achievement tests by 2014 and make
  progress toward that goal each year.
                                                  6
Consequences
•Last year we proposed an alternative growth
model based on the concept of students “on
track to graduation (OTTG)” if the student is
either proficient or makes expected growth.
•The state of New Mexico changed the scale
score making each grade ranging X00-X80
with the proficiency level at X40, where X
represents the grade, for example scale scores
for grade 5 ranges 500-580 with proficiency
level set at 540.
•This change eliminated the OTTG model we
presented last year.                             7
More changes
•      In 2011, the state released a
    preliminary report named the School
    Grading Report 2010-2011, giving
    schools ratings of A-F using a statistical
    tool not very well explained to the
    stakeholders. The state is planning to
    make this report official for the year
    2011-2012, while promising a guide
    for stakeholders to understand and
    replicate the scores generated by the
    statistical tool they are using.        8
NEW PROPOSAL

Because of this dramatic change in
data and regulations, this year we
are proposing a combination of the
attainment proficiency and growth
models based on trend analysis to
rate schools and teachers
performance.
                                     9
NEW MODEL
• The new model is based on 6 trend analysis
  for the following parameters:
  – SBA Math Proficiency (SMP)
  – SBA Reading Proficiency (SRP)
  – MAP Math Growth (MMG)
  – MAP Reading Growth (MRG)
  – MAP Math Proficiency (MPP)
  – MAP Reading Proficiency (MRP)
• Next year we could add two more parameters:
  – SBA Math Growth (SMG)
  – SBA Reading Growth (SRG)
                                               10
REGRESSION ANALYSIS
       • We collected information for the six
         parameters as shown below
PERCENTAGE OF PROFICIENT 2004-2005 2005-2006 2006-2007 2007-2008 2008-2009 2009-2010 2010-2011 2011-2012
       STUDENTS
SCHOOL A          MATH       42.0      43.2      43.2     30.7      36.8      41.1      33.5      34.5
SBA PROFICIENCY   READING    65.6      58.6      63.7     57.2      59.0      46.2      43.3      38.6
SCHOOL A          MATH       28.0      47.6      55.2     57.4      68.9      79.6      76.1      72.1
MAP PROFICIENCY   READING    57.0      60.0      65.5     70.3      74.0      79.1      75.1      71.3
SCHOOL A          MATH       40.2      42.1      43.9     41.3      43.3      39.9      37.8      39.0
MAP GROWTH        READING    32.0      27.3      26.4     20.9      29.3      36.9      28.8      24.0


   •         Next we performed a regression analysis in each of
             these parameters to find the regression line
             equation. We used the slope of the lines to create
             a rank by using the average of the slopes
             computed for each parameter.                       11
SCHOOL A
                                      PERCENTAGE OF STUDENTS
                                       SBA READ PROFICIENCY


65.6
                                                                                    y = -3.77x + 70.99
                              63.7


                                                          59.0
                                           57.2

               58.6


                                                                         46.2

                                                                                        43.3


                                                                                                              38.6


  2004-2005   2005-2006   2006-2007      2007-2008     2008-2009        2009-2010      2010-2011    2011-2012
                                                                                                         12
                                          READING    Linear (READING)
SCHOOL A
                                       PERCENTAGE OF STUDENTS
                                        SBA MATH PROFICIENCY
                                43.2
                                                                          y = -1.21x + 43.57
               43.2
42.0
                                                                       41.1


                                                       36.8


                                                                                                        34.5

                                                                                   33.5


                                            30.7


  2004-2005   2005-2006   2006-2007       2007-2008     2008-2009     2009-2010   2010-2011    2011-2012

                                             MATH     Linear (MATH)                                13
SCHOOL A
                                    PERCENTAGE OF STUDENTS
                                      MAP MATH GROWTH


                                                                           y = -0.48x + 43.09
                            43.9
                                                        43.3


               42.1

                                         41.3
40.2                                                               39.9

                                                                                                   39.0

                                                                                    37.8


2004-2005   2005-2006   2006-2007      2007-2008     2008-2009     2009-2010     2010-2011      2011-2012
                                                                                                    14
                                          MATH     Linear (MATH)
SCHOOL A
                                      PERCENTAGE OFSTUDENTS
                                       MAP MATH PROFICIENCY


                                                                           79.6
                                                                                       76.1

                                                                                                      72.1


                                                            68.9

                                                                                  y = 6.38x + 31.91
                              55.2
                                             57.4


             47.6


      28.0


2004-2005     2005-2006   2006-2007      2007-2008     2008-2009     2009-2010       2010-2011   2011-2012
                                                                                                      15
                                            MATH     Linear (MATH)
SCHOOL A
                                    PERCENTAGE OF STUDENTS
                                     MAP READ PROFICIENCY
                                                                                   y = 2.62x + 57.24

                                                                          79.1


                                                                                        75.1
                                                         74.0


                                                                                                          71.3
                                             70.3


                            65.5


               60.0


57.0


2004-2005   2005-2006   2006-2007      2007-2008      2008-2009        2009-2010        2010-2011      2011-2012
                                                                                                           16
                                        READING     Linear (READING)
SCHOOL A
                                    PERCENTAGE OF STUDENTS
                                       MAP READ GROWTH

                                                                                   y = -0.10x + 28.64
                                                                            36.9


32.0


                                                          29.3                      28.8

            27.3         26.4


                                                                                                        24.0


                                           20.9


2004-2005   2005-2006   2006-2007      2007-2008     2008-2009        2009-2010      2010-2011   2011-2012
                                                                                                     17
                                        READING    Linear (READING)
SCHOOL A
      SCHOOL A                                                            SCHOOL A                                y = 6.38x + 31.91        SCHOOL A                           y = 2.62x + 57.24
PERCENT OF STUDENTS                           y = -3.77x + 70.99     PERCENT OFSTUDENTS                                               PERCENT OF STUDENTS
SBA READ PROFICIENCY                                                MAP MATH PROFICIENCY                                              MAP READ PROFICIENCY
        65.6           63.7
                                                                                                                    79.676.1 72.1                                                 79.1
                                57.2 59.0                                                                                                                                  74.0          75.1
                58.6                                                                                       68.9
                                                                                             55.2                                                                                                71.3
                                                                                    47.6            57.4                                                     65.5 70.3
                                               46.2 43.3
                                                             38.6                                                                                     60.0
                                                                               28.0                                                           57.0


               READING             Linear (READING)                                   MATH            Linear (MATH)                               READING             Linear (READING)

      SCHOOL A                                                           SCHOOL A                             y = -0.48x + 43.09
 PERCENT OF STUDENTS
                                              y = -1.21x + 43.57    PERCENT OF STUDENTS                                                     SCHOOL A                          y = -0.10x + 28.64
SBA MATH PROFICIENCY                                                 MAP MATH GROWTH                                                   PERCENT OF STUDENTS
                         43.2                                                                                                           MAP READ GROWTH
        42.0    43.2                           41.1                                          43.9          43.3
                                                                                      42.1                                                                                         36.9
                                                                             40.2                   41.3          39.9                        32.0
                                       36.8                                                                                  39.0                    27.3    26.4          29.3           28.8
                                                                                                                         37.8                                                                    24.0
                                                             34.5
                                30.7                  33.5                                                                                                          20.9


                 MATH             Linear (MATH)                                       MATH            Linear (MATH)                               READING             Linear (READING)


      This is a view of all six graphs at once. It is hard to make a decision if this school is performing
      as desired. We need to find a measure to rate the school, we will use the slopes of the
      regression lines as explained in the next slide
                                                                                                                                                                                          18
MEASURE TO RATE SCHOOLS
• The following are the six regression lines
  – SRP y   3.77 x 70.99
  – SMP y  1.21x 43.57
  – MMG y  0.48x 43.09
  – MMP y 6.38x 31.91
  – MRP y 2.62x 57.24
  – MRG y  0.10x 28.64
• We compute the average of the slopes and we
  called the rank, in this case RANK = 1.41
• Now we need to decide a scale to assign a
  grade.
                                               19
MEASURE TO RATE SCHOOLS
• This is a tentative scale that requires some
  more research
           RANK            GRADE
           4+                  A
           2.00 – 3.99         B
           0.00 – 1.99         C
           -1.99 - -0.01       D
           -2.00 -             F

• The school in the example with rank = 1.41
  will receive a grade C.
• Another example is shown on the next slide

                                                 20
SCHOOL B
      SCHOOL B                    y = -3.7381x + 67.121            SCHOOL B           y = -2.35x + 54.175              SCHOOL B                      y = -2.0845x + 64.948
PERCENT OF STUDENTS                                          PERCENT OFSTUDENTS                                   PERCENT OF STUDENTS
SBA READ PROFICIENCY                                        MAP MATH PROFICIENCY                                  MAP READ PROFICIENCY
     67.6                                                                    54.2                                                   63.7             62.5
                                                                  52.3 52.6
            60.6                                                                                                                58.6                         58.1
                   53.7      47.2 45.2 46.2                                                     42.1 42.5               56.9                  57.2
                                                                                           39.5         35.2
                                                 43.3
                                                     38.6                           30.4                                                                            42.3
                                                                                                                                                                       45.2


            READING            Linear (READING)                         MATH          Linear (MATH)                            READING          Linear (READING)


      SCHOOL B                       y = 0.0342x + 42.478        SCHOOL B                  y = -0.3617x + 42.42        SCHOOL B                       y = -0.3617x + 42.42
 PERCENT OF STUDENTS                                        PERCENT OF STUDENTS                                   PERCENT OF STUDENTS
SBA MATH PROFICIENCY                                         MAP MATH GROWTH                                       MAP READ GROWTH
                                                                        45.3 43.2                                              45.3    43.2
                      50.1                                                                                              42.0                                          42.0
                                                                                                                                                              41.1 40.3
                                                                 42.0                             41.1     42.0                                       36.8
                                 43.5     42.1                                             36.8          40.3                                 35.6
     42.0   43.2                                 43.544.1
                                                                                    35.6
                              32.5


              MATH             Linear (MATH)                            MATH          Linear (MATH)                              MATH           Linear (MATH)


                                                            RANK = - 1.45 GRADE = D                                                                             21
RATING TEACHERS

• We could use the same methodology and
  scale to rate teachers, here are a couple of
  examples.
• Teacher A       RANK = 2.81      GRADE = B
• Teacher B       RANK = 4.19      GRADE = A
• Teacher C       RANK = - 3.52 GRADE = F


                                                 22
TEACHER A
  TEACHER A                                  TEACHER A                                                 TEACHER A
SBA/READ/PROF                             MAP/READ/GROWTH                                            MAP/MATH/PROF

                                                                                                                             65.0
                                                                                            84.5                                                         60.4
                                   48.5
                         45.0                                                                                                                 52.6
                                                                              68.4                                                  52.6
                                                                    68.4                                  46.2
                                                           65.0

    34.7
                35.0                         36.2                                                                 25.3

  2009      2010       2011     2012        2009      2010        2011      2012       2013           2008     2009     2010    2011       2012   2013


   TEACHER A                                  TEACHER A                                                TEACHER A
SBA/MATH/PROF                             MAP/MATH/GROWTH                                            MAP/READ/PROF


    53.9                                                                                                                                   45.0
                                                                                                                                                     44.7
                         47.4                          37.9                                             42.7
                                                                                                                                42.1
                45.0                                                                 35.0
                                   42.3                           33.3                        32.6                    38.1
                                               28.6
                                                                           26.3
  2009      2010       2011     2012       2008     2009     2010    2011     2012      2013           2009      2010        2011      2012       2013


                                                    RANK = 2.81 – GRADE = B
TEACHER B

  TEACHER B                                      TEACHER B                                         TEACHER B
SBA/READ/PROF                                MAP/READ/GROWTH                                     MAP/READ/PROF

                                                                                                                88.8                          86.0
                                                        88.8     86.9
                                      44.4                                                                                          75.0
                          42.1
                                                                                                                          52.1
                                                                                          52.1
    35.6          36.1                          45.0
                                                                                                      30.0
                                                                           31.2
   2009     2010         2011      2012       2009     2010    2011      2012          2013       2009       2010      2011      2012      2013


   TEACHER B                                     TEACHER B                                         TEACHER B
SBA/MATH/PROF                                MAP/MATH/GROWTH                                     MAP/MATH/PROF

                                                                  56.5
                                                                                                              61.1
                                      50.8                                                48.3                                                54.3
                                                                                                                        43.5
                47.5        47.4                                                                                                    37.5
                                                        27.8                    25.0
    42.4
                                                10.0                                                  10.0
   2009     2010         2011      2012       2009     2010    2011      2012          2013       2009       2010      2011      2012      2013


                                              RANK = 4.19 - GRADE = A

                                                                                                                                            24
TEACHER C
  TEACHER C
                                                                                          TEACHER C                                           TEACHER C
SBA/READ/PROF         91.7                                               66.6
                                           86.6                                       MAP/READ/GROWTH                         76.0          MAP/READ/PROF
     80.0                                                                                                              70.0
                               80.8                                                                           64.0
                                                                                                                                     55.6
                                                                      52.7

                                                                                    45.4          46.0
                                                             38.8                          38.4                                                      33.2
             45.9                                                                                                                           28.5


   TEACHER C                                                 TEACHER C                                     TEACHER C
SBA/MATH/PROF                                            MAP/MATH/GROWTH                                 MAP/MATH/PROF
                                                                             88.0
      76.0          77.6     79.2                                                                               86.9
                                                                                                  79.2
                                                                      76.0                                             62.9
                                                                                    74.1   72.2
                                                                                                                              38.8                 38.4
                                                  59.3                                                                                  38.0
                                    57.7                       64.0
                                                                                                                                                           16.4


                                                           RANK = -3.52 - GRADE = F


                                                                                                                                                      25
EXTRA VALUE OF THE MODEL
• Using forecasting methodologies we could
  design an expected growth/proficiency for both
  teachers and schools.
• For School A the forecasted values are:
 PERCENTAGE OF PROFICIENT     2011-2012 FORECAST
        STUDENTS                                   GOAL
SCHOOL A      SBA   MATH        44.1      42.8     44.1
PROFICIENCY         READING     38.6      33.5     38.6
SCHOOL A      MAP MATH          35.2      33.0     35.2
PROFICIENCY         READING     45.2      46.2     46.2
SCHOOL A      MAP MATH          42.0      39.2     42.0
GROWTH                          35.2      35.9
                    READING                        35.9


                                                          26
CONCLUSIONS
1. The new model presented seems to be
  1. Fair
  2. Easy to use and replicate
  3. Easy to explain to families
2. We could easily introduce the concept of “added value”
   for any other parameter: College
   readiness, extracurricular activities, sports, etc.
3. Any new parameter should be measured by percentage
   of students, parents, or teachers participating.
4. We tested six schools and ten teachers. We requested
   input from principals and administrators, over 90%
   agreed with the grades assigned by this model.

                                                      27
•QUESTIONS?
 Patricio A. Rojas, Ph.D.
  projas@llschools.net
     (505)866-8226

      THANK YOU
                            28

More Related Content

Similar to An Alternative Method to Rate Teacher Performance

Jarvis Collegiate Institute Gr 9 - 12 - EQAO School Report
Jarvis Collegiate Institute Gr 9 - 12 - EQAO School ReportJarvis Collegiate Institute Gr 9 - 12 - EQAO School Report
Jarvis Collegiate Institute Gr 9 - 12 - EQAO School Report
EvanSage
 
The national achievement test of grade six in relation to teachers' performan...
The national achievement test of grade six in relation to teachers' performan...The national achievement test of grade six in relation to teachers' performan...
The national achievement test of grade six in relation to teachers' performan...
DANCEL AGUSTINO UDQUIM
 
State Assessment Data Meeting for Admin
State Assessment Data Meeting for AdminState Assessment Data Meeting for Admin
State Assessment Data Meeting for Admin
Dr. Marci Shepard
 
Math lit Presentation 2012 Almy Foes
Math lit Presentation 2012 Almy FoesMath lit Presentation 2012 Almy Foes
Math lit Presentation 2012 Almy Foeskathleenalmy
 
Using Map Data To Build A Data Driven
Using Map Data To Build A Data DrivenUsing Map Data To Build A Data Driven
Using Map Data To Build A Data DrivenDan Henderson
 
Student Performance Data Mining Project Report
Student Performance Data Mining Project ReportStudent Performance Data Mining Project Report
Student Performance Data Mining Project Report
Jinnah University for Women
 
IRJET- Using Data Mining to Predict Students Performance
IRJET-  	  Using Data Mining to Predict Students PerformanceIRJET-  	  Using Data Mining to Predict Students Performance
IRJET- Using Data Mining to Predict Students Performance
IRJET Journal
 
MLCS AMATYC Webinar April 2012
MLCS AMATYC Webinar April 2012MLCS AMATYC Webinar April 2012
MLCS AMATYC Webinar April 2012kathleenalmy
 
2012.10.08 school board meeting
2012.10.08 school board meeting2012.10.08 school board meeting
2012.10.08 school board meetingroverdust
 
NCCE Bylsma
NCCE BylsmaNCCE Bylsma
MURSD 2012 MCAS Results & Accountability Status
MURSD 2012 MCAS Results & Accountability StatusMURSD 2012 MCAS Results & Accountability Status
MURSD 2012 MCAS Results & Accountability Status
jpm66
 
Assessing and prioritizing affecting factors in e learning websites using ahp...
Assessing and prioritizing affecting factors in e learning websites using ahp...Assessing and prioritizing affecting factors in e learning websites using ahp...
Assessing and prioritizing affecting factors in e learning websites using ahp...Alexander Decker
 
11.assessing and prioritizing affecting factors in e learning websites using ...
11.assessing and prioritizing affecting factors in e learning websites using ...11.assessing and prioritizing affecting factors in e learning websites using ...
11.assessing and prioritizing affecting factors in e learning websites using ...
Alexander Decker
 
Aligning Benchmarks With High Stakes Assessments 2009
Aligning Benchmarks With High Stakes Assessments 2009Aligning Benchmarks With High Stakes Assessments 2009
Aligning Benchmarks With High Stakes Assessments 2009
dvodicka
 
DevFuturesWork_JCPS
DevFuturesWork_JCPSDevFuturesWork_JCPS
DevFuturesWork_JCPSSabeen Nasim
 
d000163_Institutional_research_Cronje_Jun2008
d000163_Institutional_research_Cronje_Jun2008d000163_Institutional_research_Cronje_Jun2008
d000163_Institutional_research_Cronje_Jun2008Marthie Cronje
 
New york city i zone360
New york city i zone360New york city i zone360
New york city i zone360Rafael Parente
 
School Data with Charts Dec 15 Presentation
School Data with Charts Dec 15 PresentationSchool Data with Charts Dec 15 Presentation
School Data with Charts Dec 15 PresentationKeene School District
 
Ohio Education Research Center: Christopher King Keynote Presentation
Ohio Education Research Center: Christopher King Keynote PresentationOhio Education Research Center: Christopher King Keynote Presentation
Ohio Education Research Center: Christopher King Keynote PresentationOhio Education Research Center
 

Similar to An Alternative Method to Rate Teacher Performance (20)

Jarvis Collegiate Institute Gr 9 - 12 - EQAO School Report
Jarvis Collegiate Institute Gr 9 - 12 - EQAO School ReportJarvis Collegiate Institute Gr 9 - 12 - EQAO School Report
Jarvis Collegiate Institute Gr 9 - 12 - EQAO School Report
 
The national achievement test of grade six in relation to teachers' performan...
The national achievement test of grade six in relation to teachers' performan...The national achievement test of grade six in relation to teachers' performan...
The national achievement test of grade six in relation to teachers' performan...
 
State Assessment Data Meeting for Admin
State Assessment Data Meeting for AdminState Assessment Data Meeting for Admin
State Assessment Data Meeting for Admin
 
Math lit Presentation 2012 Almy Foes
Math lit Presentation 2012 Almy FoesMath lit Presentation 2012 Almy Foes
Math lit Presentation 2012 Almy Foes
 
Using Map Data To Build A Data Driven
Using Map Data To Build A Data DrivenUsing Map Data To Build A Data Driven
Using Map Data To Build A Data Driven
 
Student Performance Data Mining Project Report
Student Performance Data Mining Project ReportStudent Performance Data Mining Project Report
Student Performance Data Mining Project Report
 
IRJET- Using Data Mining to Predict Students Performance
IRJET-  	  Using Data Mining to Predict Students PerformanceIRJET-  	  Using Data Mining to Predict Students Performance
IRJET- Using Data Mining to Predict Students Performance
 
MLCS AMATYC Webinar April 2012
MLCS AMATYC Webinar April 2012MLCS AMATYC Webinar April 2012
MLCS AMATYC Webinar April 2012
 
2012.10.08 school board meeting
2012.10.08 school board meeting2012.10.08 school board meeting
2012.10.08 school board meeting
 
NCCE Bylsma
NCCE BylsmaNCCE Bylsma
NCCE Bylsma
 
MURSD 2012 MCAS Results & Accountability Status
MURSD 2012 MCAS Results & Accountability StatusMURSD 2012 MCAS Results & Accountability Status
MURSD 2012 MCAS Results & Accountability Status
 
SWBOCES APPR Primer
SWBOCES APPR PrimerSWBOCES APPR Primer
SWBOCES APPR Primer
 
Assessing and prioritizing affecting factors in e learning websites using ahp...
Assessing and prioritizing affecting factors in e learning websites using ahp...Assessing and prioritizing affecting factors in e learning websites using ahp...
Assessing and prioritizing affecting factors in e learning websites using ahp...
 
11.assessing and prioritizing affecting factors in e learning websites using ...
11.assessing and prioritizing affecting factors in e learning websites using ...11.assessing and prioritizing affecting factors in e learning websites using ...
11.assessing and prioritizing affecting factors in e learning websites using ...
 
Aligning Benchmarks With High Stakes Assessments 2009
Aligning Benchmarks With High Stakes Assessments 2009Aligning Benchmarks With High Stakes Assessments 2009
Aligning Benchmarks With High Stakes Assessments 2009
 
DevFuturesWork_JCPS
DevFuturesWork_JCPSDevFuturesWork_JCPS
DevFuturesWork_JCPS
 
d000163_Institutional_research_Cronje_Jun2008
d000163_Institutional_research_Cronje_Jun2008d000163_Institutional_research_Cronje_Jun2008
d000163_Institutional_research_Cronje_Jun2008
 
New york city i zone360
New york city i zone360New york city i zone360
New york city i zone360
 
School Data with Charts Dec 15 Presentation
School Data with Charts Dec 15 PresentationSchool Data with Charts Dec 15 Presentation
School Data with Charts Dec 15 Presentation
 
Ohio Education Research Center: Christopher King Keynote Presentation
Ohio Education Research Center: Christopher King Keynote PresentationOhio Education Research Center: Christopher King Keynote Presentation
Ohio Education Research Center: Christopher King Keynote Presentation
 

More from NWEA

Teacher goal setting in texas
Teacher goal setting in texasTeacher goal setting in texas
Teacher goal setting in texas
NWEA
 
National Superintendent's Dialogue
National Superintendent's DialogueNational Superintendent's Dialogue
National Superintendent's Dialogue
NWEA
 
Taking control of the South Carolina Teacher Evaluation framework
Taking control of the South Carolina Teacher Evaluation frameworkTaking control of the South Carolina Teacher Evaluation framework
Taking control of the South Carolina Teacher Evaluation framework
NWEA
 
NYSCOSS Conference Superintendents Training on Assessment 9 14
NYSCOSS Conference Superintendents Training on Assessment 9 14NYSCOSS Conference Superintendents Training on Assessment 9 14
NYSCOSS Conference Superintendents Training on Assessment 9 14
NWEA
 
Maximizing student assessment systems cronin
Maximizing student assessment systems   croninMaximizing student assessment systems   cronin
Maximizing student assessment systems croninNWEA
 
Using Assessment Data for Educator and Student Growth
Using Assessment Data for Educator and Student GrowthUsing Assessment Data for Educator and Student Growth
Using Assessment Data for Educator and Student Growth
NWEA
 
NWEA Growth and Teacher evaluation VA 9-13
NWEA Growth and Teacher evaluation VA 9-13NWEA Growth and Teacher evaluation VA 9-13
NWEA Growth and Teacher evaluation VA 9-13
NWEA
 
ND Assessment Program Alignment
ND Assessment Program AlignmentND Assessment Program Alignment
ND Assessment Program Alignment
NWEA
 
Nd evaluations using growth data 4 13
Nd evaluations using growth data 4 13Nd evaluations using growth data 4 13
Nd evaluations using growth data 4 13
NWEA
 
Dylan Wiliam seminar for district leaders accelerate learning with formative...
Dylan Wiliam seminar for district leaders  accelerate learning with formative...Dylan Wiliam seminar for district leaders  accelerate learning with formative...
Dylan Wiliam seminar for district leaders accelerate learning with formative...
NWEA
 
SC Assessment Summit March 2013
SC Assessment Summit March 2013SC Assessment Summit March 2013
SC Assessment Summit March 2013
NWEA
 
Assessment Program Alignment: Making Essential Connections Between Assessment...
Assessment Program Alignment: Making Essential Connections Between Assessment...Assessment Program Alignment: Making Essential Connections Between Assessment...
Assessment Program Alignment: Making Essential Connections Between Assessment...
NWEA
 
Predicting Student Performance on the MSP-HSPE: Understanding, Conducting, an...
Predicting Student Performance on the MSP-HSPE: Understanding, Conducting, an...Predicting Student Performance on the MSP-HSPE: Understanding, Conducting, an...
Predicting Student Performance on the MSP-HSPE: Understanding, Conducting, an...
NWEA
 
Using tests for teacher evaluation texas
Using tests for teacher evaluation texasUsing tests for teacher evaluation texas
Using tests for teacher evaluation texasNWEA
 
KLT TLC Leader Materials Set Excerpt
KLT TLC Leader Materials Set ExcerptKLT TLC Leader Materials Set Excerpt
KLT TLC Leader Materials Set Excerpt
NWEA
 
What's New at NWEA: Children’s Progress Academic Assessment (CPAA)
What's New at NWEA: Children’s Progress Academic Assessment (CPAA)What's New at NWEA: Children’s Progress Academic Assessment (CPAA)
What's New at NWEA: Children’s Progress Academic Assessment (CPAA)
NWEA
 
Predicting Proficiency… How MAP Predicts State Test Performance
Predicting Proficiency… How MAP Predicts State Test PerformancePredicting Proficiency… How MAP Predicts State Test Performance
Predicting Proficiency… How MAP Predicts State Test Performance
NWEA
 
Connecting the Dots: CCSS, DI, NWEA, Help!
Connecting the Dots: CCSS, DI, NWEA, Help!Connecting the Dots: CCSS, DI, NWEA, Help!
Connecting the Dots: CCSS, DI, NWEA, Help!
NWEA
 
What's New at NWEA: Keeping Learning on Track
What's New at NWEA: Keeping Learning on TrackWhat's New at NWEA: Keeping Learning on Track
What's New at NWEA: Keeping Learning on Track
NWEA
 
What’s New at NWEA: Power of Teaching
What’s New at NWEA: Power of TeachingWhat’s New at NWEA: Power of Teaching
What’s New at NWEA: Power of Teaching
NWEA
 

More from NWEA (20)

Teacher goal setting in texas
Teacher goal setting in texasTeacher goal setting in texas
Teacher goal setting in texas
 
National Superintendent's Dialogue
National Superintendent's DialogueNational Superintendent's Dialogue
National Superintendent's Dialogue
 
Taking control of the South Carolina Teacher Evaluation framework
Taking control of the South Carolina Teacher Evaluation frameworkTaking control of the South Carolina Teacher Evaluation framework
Taking control of the South Carolina Teacher Evaluation framework
 
NYSCOSS Conference Superintendents Training on Assessment 9 14
NYSCOSS Conference Superintendents Training on Assessment 9 14NYSCOSS Conference Superintendents Training on Assessment 9 14
NYSCOSS Conference Superintendents Training on Assessment 9 14
 
Maximizing student assessment systems cronin
Maximizing student assessment systems   croninMaximizing student assessment systems   cronin
Maximizing student assessment systems cronin
 
Using Assessment Data for Educator and Student Growth
Using Assessment Data for Educator and Student GrowthUsing Assessment Data for Educator and Student Growth
Using Assessment Data for Educator and Student Growth
 
NWEA Growth and Teacher evaluation VA 9-13
NWEA Growth and Teacher evaluation VA 9-13NWEA Growth and Teacher evaluation VA 9-13
NWEA Growth and Teacher evaluation VA 9-13
 
ND Assessment Program Alignment
ND Assessment Program AlignmentND Assessment Program Alignment
ND Assessment Program Alignment
 
Nd evaluations using growth data 4 13
Nd evaluations using growth data 4 13Nd evaluations using growth data 4 13
Nd evaluations using growth data 4 13
 
Dylan Wiliam seminar for district leaders accelerate learning with formative...
Dylan Wiliam seminar for district leaders  accelerate learning with formative...Dylan Wiliam seminar for district leaders  accelerate learning with formative...
Dylan Wiliam seminar for district leaders accelerate learning with formative...
 
SC Assessment Summit March 2013
SC Assessment Summit March 2013SC Assessment Summit March 2013
SC Assessment Summit March 2013
 
Assessment Program Alignment: Making Essential Connections Between Assessment...
Assessment Program Alignment: Making Essential Connections Between Assessment...Assessment Program Alignment: Making Essential Connections Between Assessment...
Assessment Program Alignment: Making Essential Connections Between Assessment...
 
Predicting Student Performance on the MSP-HSPE: Understanding, Conducting, an...
Predicting Student Performance on the MSP-HSPE: Understanding, Conducting, an...Predicting Student Performance on the MSP-HSPE: Understanding, Conducting, an...
Predicting Student Performance on the MSP-HSPE: Understanding, Conducting, an...
 
Using tests for teacher evaluation texas
Using tests for teacher evaluation texasUsing tests for teacher evaluation texas
Using tests for teacher evaluation texas
 
KLT TLC Leader Materials Set Excerpt
KLT TLC Leader Materials Set ExcerptKLT TLC Leader Materials Set Excerpt
KLT TLC Leader Materials Set Excerpt
 
What's New at NWEA: Children’s Progress Academic Assessment (CPAA)
What's New at NWEA: Children’s Progress Academic Assessment (CPAA)What's New at NWEA: Children’s Progress Academic Assessment (CPAA)
What's New at NWEA: Children’s Progress Academic Assessment (CPAA)
 
Predicting Proficiency… How MAP Predicts State Test Performance
Predicting Proficiency… How MAP Predicts State Test PerformancePredicting Proficiency… How MAP Predicts State Test Performance
Predicting Proficiency… How MAP Predicts State Test Performance
 
Connecting the Dots: CCSS, DI, NWEA, Help!
Connecting the Dots: CCSS, DI, NWEA, Help!Connecting the Dots: CCSS, DI, NWEA, Help!
Connecting the Dots: CCSS, DI, NWEA, Help!
 
What's New at NWEA: Keeping Learning on Track
What's New at NWEA: Keeping Learning on TrackWhat's New at NWEA: Keeping Learning on Track
What's New at NWEA: Keeping Learning on Track
 
What’s New at NWEA: Power of Teaching
What’s New at NWEA: Power of TeachingWhat’s New at NWEA: Power of Teaching
What’s New at NWEA: Power of Teaching
 

Recently uploaded

Honest Reviews of Tim Han LMA Course Program.pptx
Honest Reviews of Tim Han LMA Course Program.pptxHonest Reviews of Tim Han LMA Course Program.pptx
Honest Reviews of Tim Han LMA Course Program.pptx
timhan337
 
June 3, 2024 Anti-Semitism Letter Sent to MIT President Kornbluth and MIT Cor...
June 3, 2024 Anti-Semitism Letter Sent to MIT President Kornbluth and MIT Cor...June 3, 2024 Anti-Semitism Letter Sent to MIT President Kornbluth and MIT Cor...
June 3, 2024 Anti-Semitism Letter Sent to MIT President Kornbluth and MIT Cor...
Levi Shapiro
 
Synthetic Fiber Construction in lab .pptx
Synthetic Fiber Construction in lab .pptxSynthetic Fiber Construction in lab .pptx
Synthetic Fiber Construction in lab .pptx
Pavel ( NSTU)
 
678020731-Sumas-y-Restas-Para-Colorear.pdf
678020731-Sumas-y-Restas-Para-Colorear.pdf678020731-Sumas-y-Restas-Para-Colorear.pdf
678020731-Sumas-y-Restas-Para-Colorear.pdf
CarlosHernanMontoyab2
 
Supporting (UKRI) OA monographs at Salford.pptx
Supporting (UKRI) OA monographs at Salford.pptxSupporting (UKRI) OA monographs at Salford.pptx
Supporting (UKRI) OA monographs at Salford.pptx
Jisc
 
Thesis Statement for students diagnonsed withADHD.ppt
Thesis Statement for students diagnonsed withADHD.pptThesis Statement for students diagnonsed withADHD.ppt
Thesis Statement for students diagnonsed withADHD.ppt
EverAndrsGuerraGuerr
 
Additional Benefits for Employee Website.pdf
Additional Benefits for Employee Website.pdfAdditional Benefits for Employee Website.pdf
Additional Benefits for Employee Website.pdf
joachimlavalley1
 
1.4 modern child centered education - mahatma gandhi-2.pptx
1.4 modern child centered education - mahatma gandhi-2.pptx1.4 modern child centered education - mahatma gandhi-2.pptx
1.4 modern child centered education - mahatma gandhi-2.pptx
JosvitaDsouza2
 
The Challenger.pdf DNHS Official Publication
The Challenger.pdf DNHS Official PublicationThe Challenger.pdf DNHS Official Publication
The Challenger.pdf DNHS Official Publication
Delapenabediema
 
Biological Screening of Herbal Drugs in detailed.
Biological Screening of Herbal Drugs in detailed.Biological Screening of Herbal Drugs in detailed.
Biological Screening of Herbal Drugs in detailed.
Ashokrao Mane college of Pharmacy Peth-Vadgaon
 
The geography of Taylor Swift - some ideas
The geography of Taylor Swift - some ideasThe geography of Taylor Swift - some ideas
The geography of Taylor Swift - some ideas
GeoBlogs
 
The Roman Empire A Historical Colossus.pdf
The Roman Empire A Historical Colossus.pdfThe Roman Empire A Historical Colossus.pdf
The Roman Empire A Historical Colossus.pdf
kaushalkr1407
 
Unit 8 - Information and Communication Technology (Paper I).pdf
Unit 8 - Information and Communication Technology (Paper I).pdfUnit 8 - Information and Communication Technology (Paper I).pdf
Unit 8 - Information and Communication Technology (Paper I).pdf
Thiyagu K
 
special B.ed 2nd year old paper_20240531.pdf
special B.ed 2nd year old paper_20240531.pdfspecial B.ed 2nd year old paper_20240531.pdf
special B.ed 2nd year old paper_20240531.pdf
Special education needs
 
2024.06.01 Introducing a competency framework for languag learning materials ...
2024.06.01 Introducing a competency framework for languag learning materials ...2024.06.01 Introducing a competency framework for languag learning materials ...
2024.06.01 Introducing a competency framework for languag learning materials ...
Sandy Millin
 
Model Attribute Check Company Auto Property
Model Attribute  Check Company Auto PropertyModel Attribute  Check Company Auto Property
Model Attribute Check Company Auto Property
Celine George
 
TESDA TM1 REVIEWER FOR NATIONAL ASSESSMENT WRITTEN AND ORAL QUESTIONS WITH A...
TESDA TM1 REVIEWER  FOR NATIONAL ASSESSMENT WRITTEN AND ORAL QUESTIONS WITH A...TESDA TM1 REVIEWER  FOR NATIONAL ASSESSMENT WRITTEN AND ORAL QUESTIONS WITH A...
TESDA TM1 REVIEWER FOR NATIONAL ASSESSMENT WRITTEN AND ORAL QUESTIONS WITH A...
EugeneSaldivar
 
Palestine last event orientationfvgnh .pptx
Palestine last event orientationfvgnh .pptxPalestine last event orientationfvgnh .pptx
Palestine last event orientationfvgnh .pptx
RaedMohamed3
 
Language Across the Curriculm LAC B.Ed.
Language Across the  Curriculm LAC B.Ed.Language Across the  Curriculm LAC B.Ed.
Language Across the Curriculm LAC B.Ed.
Atul Kumar Singh
 
A Strategic Approach: GenAI in Education
A Strategic Approach: GenAI in EducationA Strategic Approach: GenAI in Education
A Strategic Approach: GenAI in Education
Peter Windle
 

Recently uploaded (20)

Honest Reviews of Tim Han LMA Course Program.pptx
Honest Reviews of Tim Han LMA Course Program.pptxHonest Reviews of Tim Han LMA Course Program.pptx
Honest Reviews of Tim Han LMA Course Program.pptx
 
June 3, 2024 Anti-Semitism Letter Sent to MIT President Kornbluth and MIT Cor...
June 3, 2024 Anti-Semitism Letter Sent to MIT President Kornbluth and MIT Cor...June 3, 2024 Anti-Semitism Letter Sent to MIT President Kornbluth and MIT Cor...
June 3, 2024 Anti-Semitism Letter Sent to MIT President Kornbluth and MIT Cor...
 
Synthetic Fiber Construction in lab .pptx
Synthetic Fiber Construction in lab .pptxSynthetic Fiber Construction in lab .pptx
Synthetic Fiber Construction in lab .pptx
 
678020731-Sumas-y-Restas-Para-Colorear.pdf
678020731-Sumas-y-Restas-Para-Colorear.pdf678020731-Sumas-y-Restas-Para-Colorear.pdf
678020731-Sumas-y-Restas-Para-Colorear.pdf
 
Supporting (UKRI) OA monographs at Salford.pptx
Supporting (UKRI) OA monographs at Salford.pptxSupporting (UKRI) OA monographs at Salford.pptx
Supporting (UKRI) OA monographs at Salford.pptx
 
Thesis Statement for students diagnonsed withADHD.ppt
Thesis Statement for students diagnonsed withADHD.pptThesis Statement for students diagnonsed withADHD.ppt
Thesis Statement for students diagnonsed withADHD.ppt
 
Additional Benefits for Employee Website.pdf
Additional Benefits for Employee Website.pdfAdditional Benefits for Employee Website.pdf
Additional Benefits for Employee Website.pdf
 
1.4 modern child centered education - mahatma gandhi-2.pptx
1.4 modern child centered education - mahatma gandhi-2.pptx1.4 modern child centered education - mahatma gandhi-2.pptx
1.4 modern child centered education - mahatma gandhi-2.pptx
 
The Challenger.pdf DNHS Official Publication
The Challenger.pdf DNHS Official PublicationThe Challenger.pdf DNHS Official Publication
The Challenger.pdf DNHS Official Publication
 
Biological Screening of Herbal Drugs in detailed.
Biological Screening of Herbal Drugs in detailed.Biological Screening of Herbal Drugs in detailed.
Biological Screening of Herbal Drugs in detailed.
 
The geography of Taylor Swift - some ideas
The geography of Taylor Swift - some ideasThe geography of Taylor Swift - some ideas
The geography of Taylor Swift - some ideas
 
The Roman Empire A Historical Colossus.pdf
The Roman Empire A Historical Colossus.pdfThe Roman Empire A Historical Colossus.pdf
The Roman Empire A Historical Colossus.pdf
 
Unit 8 - Information and Communication Technology (Paper I).pdf
Unit 8 - Information and Communication Technology (Paper I).pdfUnit 8 - Information and Communication Technology (Paper I).pdf
Unit 8 - Information and Communication Technology (Paper I).pdf
 
special B.ed 2nd year old paper_20240531.pdf
special B.ed 2nd year old paper_20240531.pdfspecial B.ed 2nd year old paper_20240531.pdf
special B.ed 2nd year old paper_20240531.pdf
 
2024.06.01 Introducing a competency framework for languag learning materials ...
2024.06.01 Introducing a competency framework for languag learning materials ...2024.06.01 Introducing a competency framework for languag learning materials ...
2024.06.01 Introducing a competency framework for languag learning materials ...
 
Model Attribute Check Company Auto Property
Model Attribute  Check Company Auto PropertyModel Attribute  Check Company Auto Property
Model Attribute Check Company Auto Property
 
TESDA TM1 REVIEWER FOR NATIONAL ASSESSMENT WRITTEN AND ORAL QUESTIONS WITH A...
TESDA TM1 REVIEWER  FOR NATIONAL ASSESSMENT WRITTEN AND ORAL QUESTIONS WITH A...TESDA TM1 REVIEWER  FOR NATIONAL ASSESSMENT WRITTEN AND ORAL QUESTIONS WITH A...
TESDA TM1 REVIEWER FOR NATIONAL ASSESSMENT WRITTEN AND ORAL QUESTIONS WITH A...
 
Palestine last event orientationfvgnh .pptx
Palestine last event orientationfvgnh .pptxPalestine last event orientationfvgnh .pptx
Palestine last event orientationfvgnh .pptx
 
Language Across the Curriculm LAC B.Ed.
Language Across the  Curriculm LAC B.Ed.Language Across the  Curriculm LAC B.Ed.
Language Across the Curriculm LAC B.Ed.
 
A Strategic Approach: GenAI in Education
A Strategic Approach: GenAI in EducationA Strategic Approach: GenAI in Education
A Strategic Approach: GenAI in Education
 

An Alternative Method to Rate Teacher Performance

  • 1. An Alternative Method to Rate School and Teacher Performance By Patricio A. Rojas, Ph.D. Associate Faculty at University of Phoenix Albuquerque, NM Director of Research, Data, and Assessment Los Lunas Schools, NM June 2012
  • 2. BACKGROUND • Director of Research, Data, and Assessment, Department of Curriculum and Instruction, Los Lunas Schools, Los Lunas – NM. • Member of AAAC (Accountability and Assessment Advisory Committee), nominated by the office of the Education Secretary of State. • New Mexico State Coordinator for the Math EAG (Enhancement Assessment Grant) Project, nominated by the Education Secretary of State. • Associate Professor at University of Phoenix, Albuquerque – NM. • Faculty consulting for: – San Jose State University, San Jose, CA – Universidad de Don Bosco, El Salvador. – Universidad Catolica del Norte, Antofagasta, Chile. 2
  • 3. PRELIMINARIES The legislation for No Child Left behind Act was proposed by President George W. Bush on January 23, 2001. It was coauthored by Representatives Boehner (R-OH), Miller (D- CA), and Senator Gregg (R-NH). The United States House of Representatives passed the bill on May 23, 2001 (voting 384–45), and the United States Senate passed it on June 14, 2001 (voting 91–8). President Bush signed it into law on January 8, 2002. 3
  • 4. No Child Left Behind No Child Left Behind requires all government-run schools receiving federal funding to administer a state-wide standardized test (all students take the same test under the same conditions) annually to all students. The students' scores are used to determine whether the school/teacher has taught the students well. Schools which receive Title I funding through the Elementary and Secondary Education Act of 1965 must make Adequate Yearly Progress (AYP) in test scores (e.g. each year, its fifth graders must do better on standardized tests than the previous year's fifth graders). 4
  • 5. RESEARCH • Research shows that every year fewer schools are making AYP using SBA-Proficiency model. In 2006, 29% of schools in the nation did not make AYP; last year 2011, 35% did not make AYP, and the forecast for 2012, indicates that the percentage of schools not making AYP will be 45%. Source: CEP (Center on Education Policy, Dec 2011) • In 2006, 54% of districts in New Mexico did not make AYP; last year 2011, 80% did not make AYP, and the forecast for 2012, indicates that the percentage of schools not making AYP will be 85%. Source: CEP (Center on Education Policy, Dec 2011) 5
  • 6. NCLB WAIVERS • Obviously, the “attainment proficiency model“ or SBA-Proficiency model is not working at national/state/ district level neither is the growth model, using either SBA or MAP scores. • With the addition of eight new states, so far, we have 19 states on waivers, while another 17 states and the District of Columbia are under review. • States granted waivers are exempt from the laws’ requirement that all students pass achievement tests by 2014 and make progress toward that goal each year. 6
  • 7. Consequences •Last year we proposed an alternative growth model based on the concept of students “on track to graduation (OTTG)” if the student is either proficient or makes expected growth. •The state of New Mexico changed the scale score making each grade ranging X00-X80 with the proficiency level at X40, where X represents the grade, for example scale scores for grade 5 ranges 500-580 with proficiency level set at 540. •This change eliminated the OTTG model we presented last year. 7
  • 8. More changes • In 2011, the state released a preliminary report named the School Grading Report 2010-2011, giving schools ratings of A-F using a statistical tool not very well explained to the stakeholders. The state is planning to make this report official for the year 2011-2012, while promising a guide for stakeholders to understand and replicate the scores generated by the statistical tool they are using. 8
  • 9. NEW PROPOSAL Because of this dramatic change in data and regulations, this year we are proposing a combination of the attainment proficiency and growth models based on trend analysis to rate schools and teachers performance. 9
  • 10. NEW MODEL • The new model is based on 6 trend analysis for the following parameters: – SBA Math Proficiency (SMP) – SBA Reading Proficiency (SRP) – MAP Math Growth (MMG) – MAP Reading Growth (MRG) – MAP Math Proficiency (MPP) – MAP Reading Proficiency (MRP) • Next year we could add two more parameters: – SBA Math Growth (SMG) – SBA Reading Growth (SRG) 10
  • 11. REGRESSION ANALYSIS • We collected information for the six parameters as shown below PERCENTAGE OF PROFICIENT 2004-2005 2005-2006 2006-2007 2007-2008 2008-2009 2009-2010 2010-2011 2011-2012 STUDENTS SCHOOL A MATH 42.0 43.2 43.2 30.7 36.8 41.1 33.5 34.5 SBA PROFICIENCY READING 65.6 58.6 63.7 57.2 59.0 46.2 43.3 38.6 SCHOOL A MATH 28.0 47.6 55.2 57.4 68.9 79.6 76.1 72.1 MAP PROFICIENCY READING 57.0 60.0 65.5 70.3 74.0 79.1 75.1 71.3 SCHOOL A MATH 40.2 42.1 43.9 41.3 43.3 39.9 37.8 39.0 MAP GROWTH READING 32.0 27.3 26.4 20.9 29.3 36.9 28.8 24.0 • Next we performed a regression analysis in each of these parameters to find the regression line equation. We used the slope of the lines to create a rank by using the average of the slopes computed for each parameter. 11
  • 12. SCHOOL A PERCENTAGE OF STUDENTS SBA READ PROFICIENCY 65.6 y = -3.77x + 70.99 63.7 59.0 57.2 58.6 46.2 43.3 38.6 2004-2005 2005-2006 2006-2007 2007-2008 2008-2009 2009-2010 2010-2011 2011-2012 12 READING Linear (READING)
  • 13. SCHOOL A PERCENTAGE OF STUDENTS SBA MATH PROFICIENCY 43.2 y = -1.21x + 43.57 43.2 42.0 41.1 36.8 34.5 33.5 30.7 2004-2005 2005-2006 2006-2007 2007-2008 2008-2009 2009-2010 2010-2011 2011-2012 MATH Linear (MATH) 13
  • 14. SCHOOL A PERCENTAGE OF STUDENTS MAP MATH GROWTH y = -0.48x + 43.09 43.9 43.3 42.1 41.3 40.2 39.9 39.0 37.8 2004-2005 2005-2006 2006-2007 2007-2008 2008-2009 2009-2010 2010-2011 2011-2012 14 MATH Linear (MATH)
  • 15. SCHOOL A PERCENTAGE OFSTUDENTS MAP MATH PROFICIENCY 79.6 76.1 72.1 68.9 y = 6.38x + 31.91 55.2 57.4 47.6 28.0 2004-2005 2005-2006 2006-2007 2007-2008 2008-2009 2009-2010 2010-2011 2011-2012 15 MATH Linear (MATH)
  • 16. SCHOOL A PERCENTAGE OF STUDENTS MAP READ PROFICIENCY y = 2.62x + 57.24 79.1 75.1 74.0 71.3 70.3 65.5 60.0 57.0 2004-2005 2005-2006 2006-2007 2007-2008 2008-2009 2009-2010 2010-2011 2011-2012 16 READING Linear (READING)
  • 17. SCHOOL A PERCENTAGE OF STUDENTS MAP READ GROWTH y = -0.10x + 28.64 36.9 32.0 29.3 28.8 27.3 26.4 24.0 20.9 2004-2005 2005-2006 2006-2007 2007-2008 2008-2009 2009-2010 2010-2011 2011-2012 17 READING Linear (READING)
  • 18. SCHOOL A SCHOOL A SCHOOL A y = 6.38x + 31.91 SCHOOL A y = 2.62x + 57.24 PERCENT OF STUDENTS y = -3.77x + 70.99 PERCENT OFSTUDENTS PERCENT OF STUDENTS SBA READ PROFICIENCY MAP MATH PROFICIENCY MAP READ PROFICIENCY 65.6 63.7 79.676.1 72.1 79.1 57.2 59.0 74.0 75.1 58.6 68.9 55.2 71.3 47.6 57.4 65.5 70.3 46.2 43.3 38.6 60.0 28.0 57.0 READING Linear (READING) MATH Linear (MATH) READING Linear (READING) SCHOOL A SCHOOL A y = -0.48x + 43.09 PERCENT OF STUDENTS y = -1.21x + 43.57 PERCENT OF STUDENTS SCHOOL A y = -0.10x + 28.64 SBA MATH PROFICIENCY MAP MATH GROWTH PERCENT OF STUDENTS 43.2 MAP READ GROWTH 42.0 43.2 41.1 43.9 43.3 42.1 36.9 40.2 41.3 39.9 32.0 36.8 39.0 27.3 26.4 29.3 28.8 37.8 24.0 34.5 30.7 33.5 20.9 MATH Linear (MATH) MATH Linear (MATH) READING Linear (READING) This is a view of all six graphs at once. It is hard to make a decision if this school is performing as desired. We need to find a measure to rate the school, we will use the slopes of the regression lines as explained in the next slide 18
  • 19. MEASURE TO RATE SCHOOLS • The following are the six regression lines – SRP y 3.77 x 70.99 – SMP y 1.21x 43.57 – MMG y 0.48x 43.09 – MMP y 6.38x 31.91 – MRP y 2.62x 57.24 – MRG y 0.10x 28.64 • We compute the average of the slopes and we called the rank, in this case RANK = 1.41 • Now we need to decide a scale to assign a grade. 19
  • 20. MEASURE TO RATE SCHOOLS • This is a tentative scale that requires some more research RANK GRADE 4+ A 2.00 – 3.99 B 0.00 – 1.99 C -1.99 - -0.01 D -2.00 - F • The school in the example with rank = 1.41 will receive a grade C. • Another example is shown on the next slide 20
  • 21. SCHOOL B SCHOOL B y = -3.7381x + 67.121 SCHOOL B y = -2.35x + 54.175 SCHOOL B y = -2.0845x + 64.948 PERCENT OF STUDENTS PERCENT OFSTUDENTS PERCENT OF STUDENTS SBA READ PROFICIENCY MAP MATH PROFICIENCY MAP READ PROFICIENCY 67.6 54.2 63.7 62.5 52.3 52.6 60.6 58.6 58.1 53.7 47.2 45.2 46.2 42.1 42.5 56.9 57.2 39.5 35.2 43.3 38.6 30.4 42.3 45.2 READING Linear (READING) MATH Linear (MATH) READING Linear (READING) SCHOOL B y = 0.0342x + 42.478 SCHOOL B y = -0.3617x + 42.42 SCHOOL B y = -0.3617x + 42.42 PERCENT OF STUDENTS PERCENT OF STUDENTS PERCENT OF STUDENTS SBA MATH PROFICIENCY MAP MATH GROWTH MAP READ GROWTH 45.3 43.2 45.3 43.2 50.1 42.0 42.0 41.1 40.3 42.0 41.1 42.0 36.8 43.5 42.1 36.8 40.3 35.6 42.0 43.2 43.544.1 35.6 32.5 MATH Linear (MATH) MATH Linear (MATH) MATH Linear (MATH) RANK = - 1.45 GRADE = D 21
  • 22. RATING TEACHERS • We could use the same methodology and scale to rate teachers, here are a couple of examples. • Teacher A RANK = 2.81 GRADE = B • Teacher B RANK = 4.19 GRADE = A • Teacher C RANK = - 3.52 GRADE = F 22
  • 23. TEACHER A TEACHER A TEACHER A TEACHER A SBA/READ/PROF MAP/READ/GROWTH MAP/MATH/PROF 65.0 84.5 60.4 48.5 45.0 52.6 68.4 52.6 68.4 46.2 65.0 34.7 35.0 36.2 25.3 2009 2010 2011 2012 2009 2010 2011 2012 2013 2008 2009 2010 2011 2012 2013 TEACHER A TEACHER A TEACHER A SBA/MATH/PROF MAP/MATH/GROWTH MAP/READ/PROF 53.9 45.0 44.7 47.4 37.9 42.7 42.1 45.0 35.0 42.3 33.3 32.6 38.1 28.6 26.3 2009 2010 2011 2012 2008 2009 2010 2011 2012 2013 2009 2010 2011 2012 2013 RANK = 2.81 – GRADE = B
  • 24. TEACHER B TEACHER B TEACHER B TEACHER B SBA/READ/PROF MAP/READ/GROWTH MAP/READ/PROF 88.8 86.0 88.8 86.9 44.4 75.0 42.1 52.1 52.1 35.6 36.1 45.0 30.0 31.2 2009 2010 2011 2012 2009 2010 2011 2012 2013 2009 2010 2011 2012 2013 TEACHER B TEACHER B TEACHER B SBA/MATH/PROF MAP/MATH/GROWTH MAP/MATH/PROF 56.5 61.1 50.8 48.3 54.3 43.5 47.5 47.4 37.5 27.8 25.0 42.4 10.0 10.0 2009 2010 2011 2012 2009 2010 2011 2012 2013 2009 2010 2011 2012 2013 RANK = 4.19 - GRADE = A 24
  • 25. TEACHER C TEACHER C TEACHER C TEACHER C SBA/READ/PROF 91.7 66.6 86.6 MAP/READ/GROWTH 76.0 MAP/READ/PROF 80.0 70.0 80.8 64.0 55.6 52.7 45.4 46.0 38.8 38.4 33.2 45.9 28.5 TEACHER C TEACHER C TEACHER C SBA/MATH/PROF MAP/MATH/GROWTH MAP/MATH/PROF 88.0 76.0 77.6 79.2 86.9 79.2 76.0 62.9 74.1 72.2 38.8 38.4 59.3 38.0 57.7 64.0 16.4 RANK = -3.52 - GRADE = F 25
  • 26. EXTRA VALUE OF THE MODEL • Using forecasting methodologies we could design an expected growth/proficiency for both teachers and schools. • For School A the forecasted values are: PERCENTAGE OF PROFICIENT 2011-2012 FORECAST STUDENTS GOAL SCHOOL A SBA MATH 44.1 42.8 44.1 PROFICIENCY READING 38.6 33.5 38.6 SCHOOL A MAP MATH 35.2 33.0 35.2 PROFICIENCY READING 45.2 46.2 46.2 SCHOOL A MAP MATH 42.0 39.2 42.0 GROWTH 35.2 35.9 READING 35.9 26
  • 27. CONCLUSIONS 1. The new model presented seems to be 1. Fair 2. Easy to use and replicate 3. Easy to explain to families 2. We could easily introduce the concept of “added value” for any other parameter: College readiness, extracurricular activities, sports, etc. 3. Any new parameter should be measured by percentage of students, parents, or teachers participating. 4. We tested six schools and ten teachers. We requested input from principals and administrators, over 90% agreed with the grades assigned by this model. 27
  • 28. •QUESTIONS? Patricio A. Rojas, Ph.D. projas@llschools.net (505)866-8226 THANK YOU 28