Downloaded 762 times


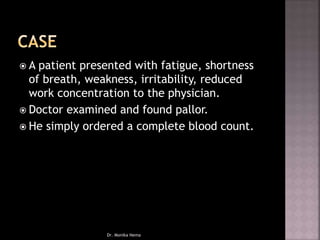
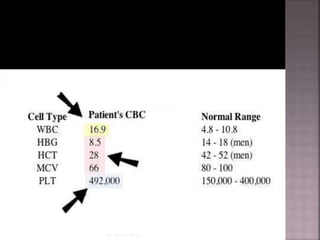
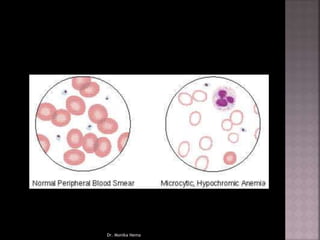
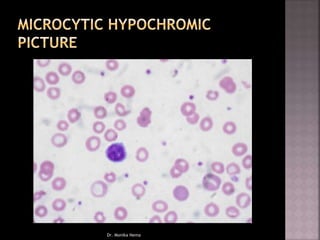


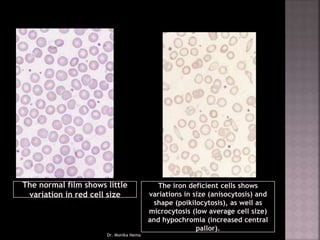


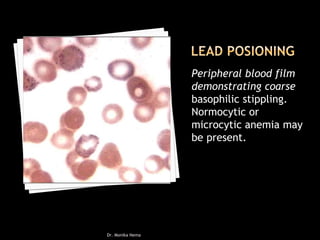
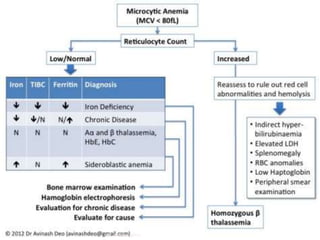
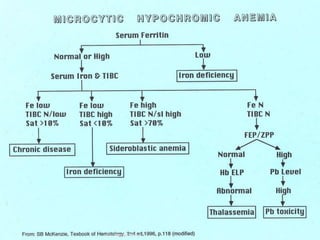


Microcytic anemia is characterized by reduced oxygen delivery due to a decrease in red blood cells and hemoglobin levels. It is most commonly linked to iron deficiency and presents with symptoms such as fatigue and pallor, often diagnosed through a complete blood count. Various causes include chronic blood loss, inadequate iron intake, and genetic disorders like thalassemia.


