Downloaded 130 times
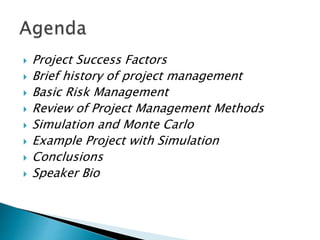
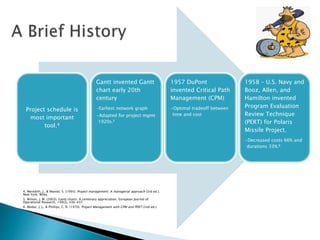
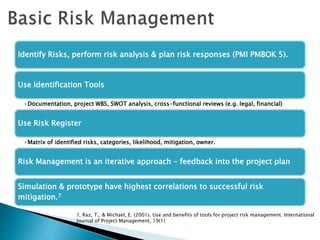
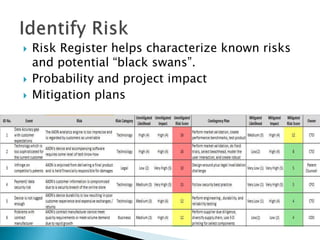


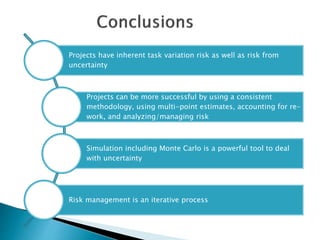


The document discusses improving project management through risk management techniques, emphasizing the importance of methodologies like Monte Carlo simulations and risk registers. It highlights the historical context of project management tools and techniques, including PERT and CPM, and stresses the iterative nature of risk management for project success. The speaker, Mike Tulkoff, brings extensive experience in software engineering and seeks to enhance project planning and execution efficiency.


![Primavera Monte Carlo[1]](https://cdn.slidesharecdn.com/ss_thumbnails/29e0ac57-26a3-45d1-b4bf-c67f2218016c-160504153318-thumbnail.jpg?width=640&height=640&fit=bounds)


