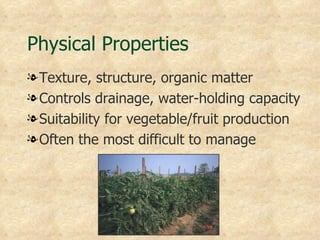
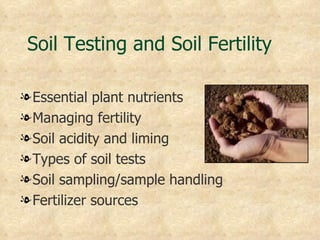
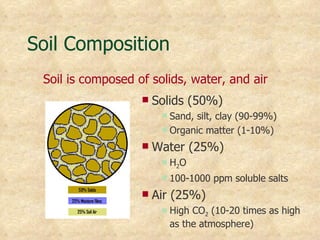
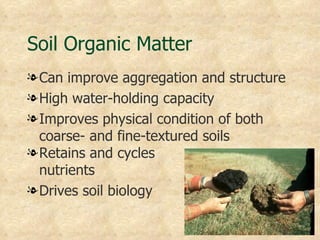
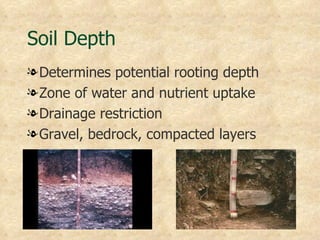
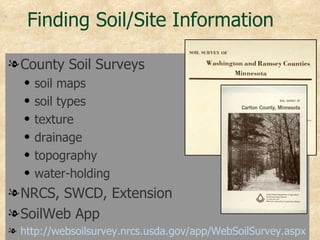
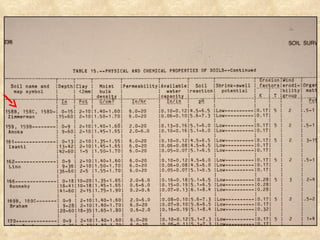
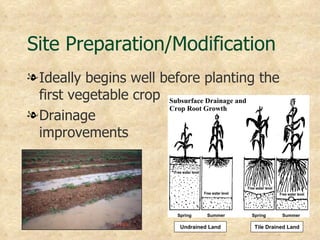
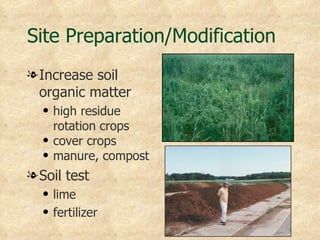
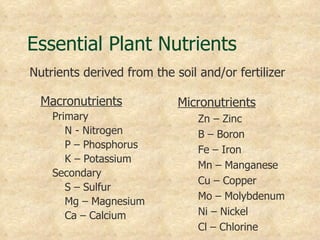
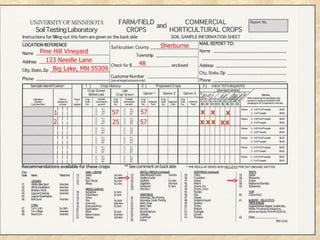
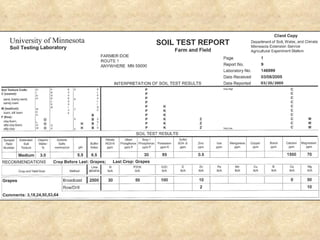
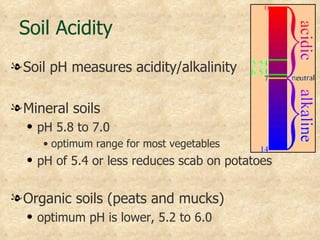
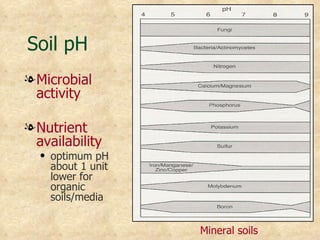
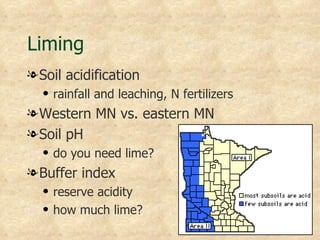
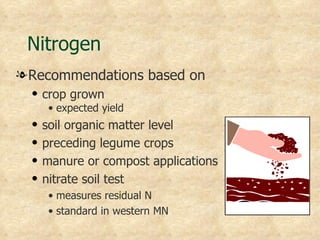
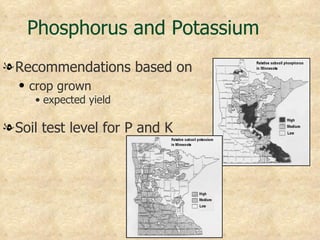
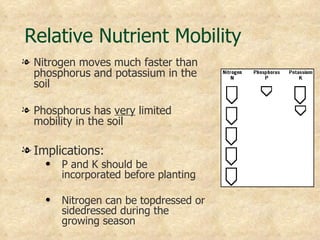
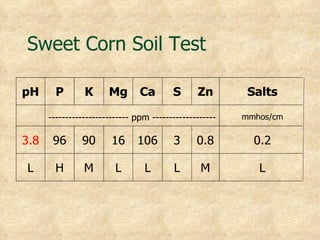
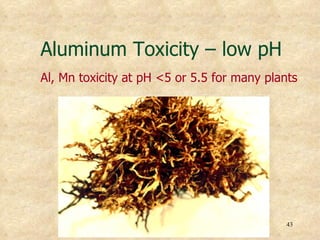
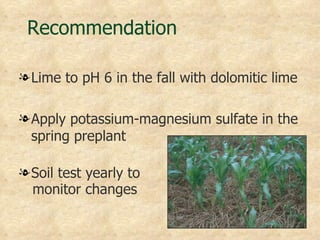
Soils 101:
    Soil Physical & Chemical Properties

             Peter Bierman and Carl Rosen
          Department of Soil, Water, and Climate
                 University of Minnesota

MFVGA Beginning Grower Workshop
       January 18, 2012
Physical Properties
l Texture, structure, organic matter
l Controls drainage, water-holding capacity
l Suitability for vegetable/fruit production
l Often the most difficult to manage
Soil Testing and Soil Fertility

l Essential plant nutrients
l Managing fertility
l Soil acidity and liming
l Types of soil tests
l Soil sampling/sample handling
l Fertilizer sources
Soil Composition
 Soil is composed of solids, water, and air
                      Solids (50%)
                         Sand, silt, clay (90-99%)
                         Organic matter (1-10%)

                      Water (25%)
                           H 2O
                           100-1000 ppm soluble salts
                      Air (25%)
                           High CO2 (10-20 times as high
                            as the atmosphere)
Importance of Soil Physical Properties

l Healthy crop root growth
  q   roots require both air and water


l Determines infiltration, drainage,
  aeration, water-holding capacity
  q   control the balance
      between air and water
      in the root zone
Soil Texture
l Relative proportions of sand-, silt-, and
  clay-sized particles
  q   sand > silt > clay
l Soil “textural class”
  q   loamy sand, silt loam, clay
l Texture is a fixed
  soil property
  q   not altered by management under ordinary
      conditions
Soil Texture
l Coarse-textured soils
  q   dominated by sand
       • well-drained/aerated
       • low water and nutrient holding capacity
l Fine-textured soils
  q   dominated by clay
       • poorly drained/aerated
       • high water and nutrient holding capacity
l Loams
  q   intermediate texture and properties
Textural Triangle   Feel
Soil Structure
l Sand, silt, clay combined into
  aggregates
l Aggregates arranged with pore spaces
  between them
l “Good” structure
  q   ~50% solids and 50% pore space
  q   pore space evenly distributed
      • large, air-filled pores (drain readily)
      • smaller, water holding pores
Soil Structure
                      Soil Air & Water
      Tightly Held
      Water Film

       Water-filled
       Pore Space


   Air-filled
  Macropore


                            Soil
                          Aggregate
Soil Structure
   l Soil structure can be altered by
     management
      q   improved or degraded


Granular aggregation promoted Compaction reduces pore space
by organic matter
Soil Organic Matter
 Organic matter affects most soil properties
  Forms of organic matter
    • Plant/animal residues
       • Various stages of
         decomposition
    • Humus
       • Decomposition by-product
       • Resistant to further
         degradation
Soil Organic Matter
l Can improve aggregation and structure
l High water-holding capacity
l Improves physical condition of both
  coarse- and fine-textured soils
l Retains and cycles
  nutrients
l Drives soil biology
Soil Depth
l Determines potential rooting depth
l Zone of water and nutrient uptake
l Drainage restriction
l Gravel, bedrock, compacted layers
Finding Soil/Site Information

l County Soil Surveys
   q   soil maps
   q   soil types
   q   texture
   q   drainage
   q   topography
   q   water-holding
l NRCS, SWCD, Extension
l SoilWeb App
l http://websoilsurvey.nrcs.usda.gov/app/WebSoilSurvey.aspx
Soil Survey
Soil Survey
Site Preparation/Modification
l Ideally begins well before planting the
  first vegetable crop Subsurface Drainage and
                       Crop Root Growth
l Drainage
  improvements

                          Free water level


                                                                Free water level
                                             Free water level                      Free water level


                           Spring             Summer              Spring            Summer

                             Undrained Land                         Tile Drained Land
Site Preparation/Modification
l Increase soil
  organic matter
  q   high residue
      rotation crops
  q   cover crops
  q   manure, compost
l Soil test
  q   lime
  q   fertilizer
Soil Testing and Soil Fertility
l Essential plant nutrients
l Soil sampling/handling
l Types of soil tests
l Soil acidity and liming
l Cation exchange capacity
l Organic/inorganic fertilizers
l Value of soil testing
   q   example field
Essential Plant Nutrients
Nutrients derived from the soil and/or fertilizer

  Macronutrients            Micronutrients
    Primary                     Zn – Zinc
       N - Nitrogen             B – Boron
       P – Phosphorus           Fe – Iron
       K – Potassium
                                Mn – Manganese
    Secondary
                                Cu – Copper
       S – Sulfur
       Mg – Magnesium           Mo – Molybdenum
       Ca – Calcium             Ni – Nickel
                                Cl – Chlorine
Soil Sampling
l Collect representative samples
  q   Soil tests are only as accurate as
      the samples you submit
  q   Sampling is often the weakest link
      in a soil testing program


l Follow sampling and handling
  guidelines of the laboratory you
  submit samples to
Sampling Guidelines
l Divide fields into uniform areas
  q   soil type, slope, crop history, tillage,
      previous lime, fertilizer, manure, compost
      applications
l No more than 20 acres for a single
  sample
l Collect 20-30 soil cores
  q   random, zig-zag pattern across the field
l Standard depth 6-8 inches
  q   2 feet for soil nitrate test
Soil Sampling
l Thoroughly mix sub-samples in a clean,
  plastic container
  q   submit about a pint of this composite
      sample to a laboratory for analysis
l If soil is wet
  q   air dry
       • spread in a thin layer on a
         clean surface before mixing
  q   oven dry at <97° F
Soil Tests
l Standard series
  q   do on a regular basis
  q   P, K, soil pH, buffer pH, OM, texture
       • lime requirements are based on a Buffer Index
l Additional tests
  q   first time a new site is sampled
       • or when a problem is suspected
  q   Ca, Mg, Zn, B
       • Cu and Mn on organic soils
Sherburne
Pine Hill Vineyard
  123 Needle Lane
                               48
     Big Lake, MN 55309


    1                     57   57               x x    x
    2                     25   57               x x x xx
03/20/2005
Soil Acidity
l Soil pH measures acidity/alkalinity

l Mineral soils
  q   pH 5.8 to 7.0
       • optimum range for most vegetables
  q   pH of 5.4 or less reduces scab on potatoes


l Organic soils (peats and mucks)
  q   optimum pH is lower, 5.2 to 6.0
Soil pH
l Microbial
  activity

l Nutrient
  availability
  q   optimum pH
      about 1 unit
      lower for
      organic
      soils/media


                     Mineral soils
Liming
l Soil acidification
  q   rainfall and leaching, N fertilizers
l Western MN vs. eastern MN
l Soil pH
  q   do you need lime?
l Buffer index
  q   reserve acidity
  q   how much lime?
Nitrogen
l Recommendations based on
  q   crop grown
       • expected yield
  q   soil organic matter level
  q   preceding legume crops
  q   manure or compost applications
  q   nitrate soil test
       • measures residual N
       • standard in western MN
Phosphorus and Potassium
l Recommendations based on
  q   crop grown
      • expected yield

l Soil test level for P and K
Relative Nutrient Mobility
l Nitrogen moves much faster than
  phosphorus and potassium in the
  soil

l Phosphorus has very limited
  mobility in the soil

l Implications:
    q   P and K should be
        incorporated before planting

    q   Nitrogen can be topdressed or
        sidedressed during the
        growing season
Soil Cation Exchange Capacity
 CEC is the amount of positively charged ions a
 soil can hold – reduces leaching and buffers
 the soil solution


                                 Soil Solution
                                   K+           Mg2+

                                        Ca2+

                                               H+
Sources of Plant Nutrients
 Plant nutrients come from both organic and
 chemical sources
Organic vs. Inorganic Fertilizers
l Organic
   q   Nutrients slowly released
   q   Low burn potential
   q   Improve soil structure
   q   May contain weed seeds
   q   Usually higher cost
   q   Acceptability for certified organic crop
       production depends upon the certifying agency
l Inorganic (manufactured soluble fertilizers)
   q   Nutrients quickly available
   q   High burn potential
   q   Lower cost/unit of nutrient
Inorganic Fertilizers
Inorganic Fertilizer                     %N                     % P2O5                      % K2O
___________________________________________________________________________________________________________

Ammonium sulfate                           21                         0                           0
Ammonium nitrate                           34                         0                           0
Urea                                       45                         0                           0
Calcium nitrate                            15                         0                           0
Monoammonium phosphate                     11                        48                           0
Diammonium phosphate                       18                        46                           0
Rock phosphate                              0                         5                           0
Superphosphate                              0                        20                           0
Conc. superphosphate                        0                        46                           0
Green sand                                  0                         1                           6
Muriate of potash                           0                         0                          60
Potassium sulfate                           0                         0                          50
Potassium – magnesium sulfate               0                         0                          22
Blends (N, P, K)                           10                        10                          10
                                           12                        12                          12
                                           27                         3                           3
                                            6                        12                          12
                                           18                         6                          12
___________________________________________________________________________________________________________
Organic Fertilizers
 Organic Fertilizer                       %N                        % P2O5                      % K2O
 ___________________________________________________________________________________________________________

 Manure (fresh)
                bat                        6.0                         9.0                         3.0
                cattle                     0.55                        0.55                        0.45
                hog                        0.50                        0.35                        0.45
                horse                      0.65                        0.25                        0.50
                poultry                    1.00                        0.85                        0.45
                rabbit                     2.4                         1.4                         0.6
                sheep                      0.9                         0.5                         0.8
 Alfalfa hay                               2.5                         0.5                         2.1
 Bone meal (steamed)                       1.0                        15.0                         0.0
 Fish scraps                               9.0                         7.0                         0.0
 Lawn clippings                            1.2                         0.3                         2.0
 Leaves (sugar maple)                      0.7                         0.1                         0.8
 Milorganite *                             5.0                         3.0                         2.0
 Straw (wheat)                             0.6                         0.2                         1.0
 Grain straw                               0.6                         0.2                         2.1
 Sawdust                                   0.2                         0.1                         0.2
 Wood ashes                                0.0                         2.0                         6.0
 ___________________________________________________________________________________________________________

   * Not acceptable for organic fruit and vegetable production
Value of Soil Testing
Sweet Corn Tissue Analysis
Element   Conc.   Interp.   Element   Conc.   Interp.
           (%)                        (ppm)
  N        1.72    Def.       Fe        79     Suff.

   P      0.16     Def.       Mn       860    Excess

  K       2.01     Low        Cu        8      Suff.

  Ca      0.28     Def.       Zn       22      Suff.

  Mg      0.15     Def.       B         4      Low

   S      0.09     Def.
Sweet Corn Soil Test

pH      P       K      Mg       Ca       S      Zn        Salts

      ------------------------ ppm -------------------   mmhos/cm


3.8    96      90       16     106       3      0.8        0.2

L       H       M        L       L       L       M          L
Aluminum Toxicity – low pH
Al, Mn toxicity at pH <5 or 5.5 for many plants


                                             43
Recommendation

l Lime to pH 6 in the fall with dolomitic lime

l Apply potassium-magnesium sulfate in the
  spring preplant

l Soil test yearly to
  monitor changes
Additional Information
l Nutrient Management for Commercial Fruit
  and Vegetable Crops in Minnesota
 BU-5886-E - 2005

 University of Minnesota Extension Service
  q   http://www.extension.umn.edu/

l University of Minnesota Soil Testing Lab
  q   http://soiltest.cfans.umn.edu/
  q   Phone: 612-625-3101

Soils 101 for High Tunnels 2012

  • 1.
    Soils 101: Soil Physical & Chemical Properties Peter Bierman and Carl Rosen Department of Soil, Water, and Climate University of Minnesota MFVGA Beginning Grower Workshop January 18, 2012
  • 2.
    Physical Properties l Texture,structure, organic matter l Controls drainage, water-holding capacity l Suitability for vegetable/fruit production l Often the most difficult to manage
  • 3.
    Soil Testing andSoil Fertility l Essential plant nutrients l Managing fertility l Soil acidity and liming l Types of soil tests l Soil sampling/sample handling l Fertilizer sources
  • 4.
    Soil Composition Soilis composed of solids, water, and air  Solids (50%)  Sand, silt, clay (90-99%)  Organic matter (1-10%)  Water (25%)  H 2O  100-1000 ppm soluble salts  Air (25%)  High CO2 (10-20 times as high as the atmosphere)
  • 5.
    Importance of SoilPhysical Properties l Healthy crop root growth q roots require both air and water l Determines infiltration, drainage, aeration, water-holding capacity q control the balance between air and water in the root zone
  • 6.
    Soil Texture l Relativeproportions of sand-, silt-, and clay-sized particles q sand > silt > clay l Soil “textural class” q loamy sand, silt loam, clay l Texture is a fixed soil property q not altered by management under ordinary conditions
  • 7.
    Soil Texture l Coarse-texturedsoils q dominated by sand • well-drained/aerated • low water and nutrient holding capacity l Fine-textured soils q dominated by clay • poorly drained/aerated • high water and nutrient holding capacity l Loams q intermediate texture and properties
  • 8.
  • 9.
    Soil Structure l Sand,silt, clay combined into aggregates l Aggregates arranged with pore spaces between them l “Good” structure q ~50% solids and 50% pore space q pore space evenly distributed • large, air-filled pores (drain readily) • smaller, water holding pores
  • 10.
    Soil Structure Soil Air & Water Tightly Held Water Film Water-filled Pore Space Air-filled Macropore Soil Aggregate
  • 11.
    Soil Structure l Soil structure can be altered by management q improved or degraded Granular aggregation promoted Compaction reduces pore space by organic matter
  • 12.
    Soil Organic Matter Organic matter affects most soil properties  Forms of organic matter • Plant/animal residues • Various stages of decomposition • Humus • Decomposition by-product • Resistant to further degradation
  • 13.
    Soil Organic Matter lCan improve aggregation and structure l High water-holding capacity l Improves physical condition of both coarse- and fine-textured soils l Retains and cycles nutrients l Drives soil biology
  • 14.
    Soil Depth l Determinespotential rooting depth l Zone of water and nutrient uptake l Drainage restriction l Gravel, bedrock, compacted layers
  • 15.
    Finding Soil/Site Information lCounty Soil Surveys q soil maps q soil types q texture q drainage q topography q water-holding l NRCS, SWCD, Extension l SoilWeb App l http://websoilsurvey.nrcs.usda.gov/app/WebSoilSurvey.aspx
  • 16.
  • 17.
  • 18.
    Site Preparation/Modification l Ideallybegins well before planting the first vegetable crop Subsurface Drainage and Crop Root Growth l Drainage improvements Free water level Free water level Free water level Free water level Spring Summer Spring Summer Undrained Land Tile Drained Land
  • 19.
    Site Preparation/Modification l Increasesoil organic matter q high residue rotation crops q cover crops q manure, compost l Soil test q lime q fertilizer
  • 20.
    Soil Testing andSoil Fertility l Essential plant nutrients l Soil sampling/handling l Types of soil tests l Soil acidity and liming l Cation exchange capacity l Organic/inorganic fertilizers l Value of soil testing q example field
  • 21.
    Essential Plant Nutrients Nutrientsderived from the soil and/or fertilizer Macronutrients Micronutrients Primary Zn – Zinc N - Nitrogen B – Boron P – Phosphorus Fe – Iron K – Potassium Mn – Manganese Secondary Cu – Copper S – Sulfur Mg – Magnesium Mo – Molybdenum Ca – Calcium Ni – Nickel Cl – Chlorine
  • 22.
    Soil Sampling l Collectrepresentative samples q Soil tests are only as accurate as the samples you submit q Sampling is often the weakest link in a soil testing program l Follow sampling and handling guidelines of the laboratory you submit samples to
  • 23.
    Sampling Guidelines l Dividefields into uniform areas q soil type, slope, crop history, tillage, previous lime, fertilizer, manure, compost applications l No more than 20 acres for a single sample l Collect 20-30 soil cores q random, zig-zag pattern across the field l Standard depth 6-8 inches q 2 feet for soil nitrate test
  • 24.
    Soil Sampling l Thoroughlymix sub-samples in a clean, plastic container q submit about a pint of this composite sample to a laboratory for analysis l If soil is wet q air dry • spread in a thin layer on a clean surface before mixing q oven dry at <97° F
  • 25.
    Soil Tests l Standardseries q do on a regular basis q P, K, soil pH, buffer pH, OM, texture • lime requirements are based on a Buffer Index l Additional tests q first time a new site is sampled • or when a problem is suspected q Ca, Mg, Zn, B • Cu and Mn on organic soils
  • 26.
    Sherburne Pine Hill Vineyard 123 Needle Lane 48 Big Lake, MN 55309 1 57 57 x x x 2 25 57 x x x xx
  • 27.
  • 28.
    Soil Acidity l SoilpH measures acidity/alkalinity l Mineral soils q pH 5.8 to 7.0 • optimum range for most vegetables q pH of 5.4 or less reduces scab on potatoes l Organic soils (peats and mucks) q optimum pH is lower, 5.2 to 6.0
  • 29.
    Soil pH l Microbial activity l Nutrient availability q optimum pH about 1 unit lower for organic soils/media Mineral soils
  • 30.
    Liming l Soil acidification q rainfall and leaching, N fertilizers l Western MN vs. eastern MN l Soil pH q do you need lime? l Buffer index q reserve acidity q how much lime?
  • 31.
    Nitrogen l Recommendations basedon q crop grown • expected yield q soil organic matter level q preceding legume crops q manure or compost applications q nitrate soil test • measures residual N • standard in western MN
  • 32.
    Phosphorus and Potassium lRecommendations based on q crop grown • expected yield l Soil test level for P and K
  • 33.
    Relative Nutrient Mobility lNitrogen moves much faster than phosphorus and potassium in the soil l Phosphorus has very limited mobility in the soil l Implications: q P and K should be incorporated before planting q Nitrogen can be topdressed or sidedressed during the growing season
  • 34.
    Soil Cation ExchangeCapacity CEC is the amount of positively charged ions a soil can hold – reduces leaching and buffers the soil solution Soil Solution K+ Mg2+ Ca2+ H+
  • 35.
    Sources of PlantNutrients Plant nutrients come from both organic and chemical sources
  • 36.
    Organic vs. InorganicFertilizers l Organic q Nutrients slowly released q Low burn potential q Improve soil structure q May contain weed seeds q Usually higher cost q Acceptability for certified organic crop production depends upon the certifying agency l Inorganic (manufactured soluble fertilizers) q Nutrients quickly available q High burn potential q Lower cost/unit of nutrient
  • 37.
    Inorganic Fertilizers Inorganic Fertilizer %N % P2O5 % K2O ___________________________________________________________________________________________________________ Ammonium sulfate 21 0 0 Ammonium nitrate 34 0 0 Urea 45 0 0 Calcium nitrate 15 0 0 Monoammonium phosphate 11 48 0 Diammonium phosphate 18 46 0 Rock phosphate 0 5 0 Superphosphate 0 20 0 Conc. superphosphate 0 46 0 Green sand 0 1 6 Muriate of potash 0 0 60 Potassium sulfate 0 0 50 Potassium – magnesium sulfate 0 0 22 Blends (N, P, K) 10 10 10 12 12 12 27 3 3 6 12 12 18 6 12 ___________________________________________________________________________________________________________
  • 38.
    Organic Fertilizers OrganicFertilizer %N % P2O5 % K2O ___________________________________________________________________________________________________________ Manure (fresh) bat 6.0 9.0 3.0 cattle 0.55 0.55 0.45 hog 0.50 0.35 0.45 horse 0.65 0.25 0.50 poultry 1.00 0.85 0.45 rabbit 2.4 1.4 0.6 sheep 0.9 0.5 0.8 Alfalfa hay 2.5 0.5 2.1 Bone meal (steamed) 1.0 15.0 0.0 Fish scraps 9.0 7.0 0.0 Lawn clippings 1.2 0.3 2.0 Leaves (sugar maple) 0.7 0.1 0.8 Milorganite * 5.0 3.0 2.0 Straw (wheat) 0.6 0.2 1.0 Grain straw 0.6 0.2 2.1 Sawdust 0.2 0.1 0.2 Wood ashes 0.0 2.0 6.0 ___________________________________________________________________________________________________________ * Not acceptable for organic fruit and vegetable production
  • 39.
  • 41.
    Sweet Corn TissueAnalysis Element Conc. Interp. Element Conc. Interp. (%) (ppm) N 1.72 Def. Fe 79 Suff. P 0.16 Def. Mn 860 Excess K 2.01 Low Cu 8 Suff. Ca 0.28 Def. Zn 22 Suff. Mg 0.15 Def. B 4 Low S 0.09 Def.
  • 42.
    Sweet Corn SoilTest pH P K Mg Ca S Zn Salts ------------------------ ppm ------------------- mmhos/cm 3.8 96 90 16 106 3 0.8 0.2 L H M L L L M L
  • 43.
    Aluminum Toxicity –low pH Al, Mn toxicity at pH <5 or 5.5 for many plants 43
  • 44.
    Recommendation l Lime topH 6 in the fall with dolomitic lime l Apply potassium-magnesium sulfate in the spring preplant l Soil test yearly to monitor changes
  • 45.
    Additional Information l NutrientManagement for Commercial Fruit and Vegetable Crops in Minnesota BU-5886-E - 2005  University of Minnesota Extension Service q http://www.extension.umn.edu/ l University of Minnesota Soil Testing Lab q http://soiltest.cfans.umn.edu/ q Phone: 612-625-3101