Download to read offline


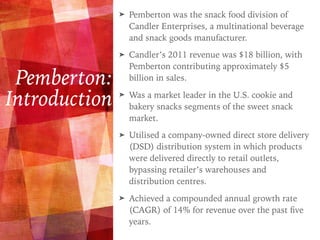


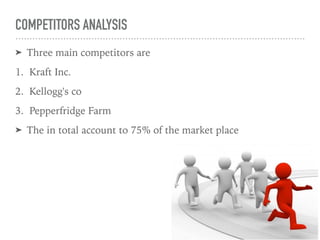


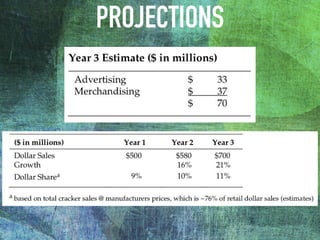
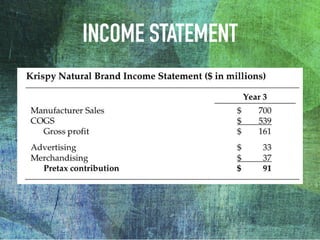


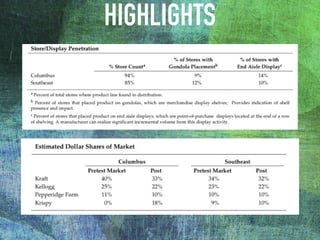


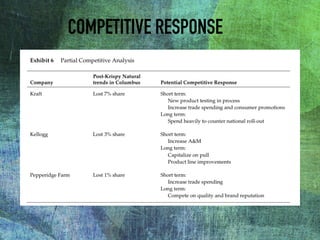


The document outlines the launch strategy and market analysis for Krispy Natural, emphasizing the competitive landscape and marketing tactics in the snack food industry. It highlights Pemberton's strengths, including a robust direct store delivery system, and identifies key competitors like Kraft and Kellogg's. Expectations for market share growth in different regions were met with mixed results, showcasing both strong consumer interest and concerns regarding sustainability of promotional strategies.


