Download as PDF, PPTX
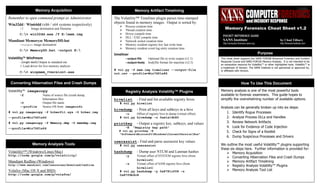
![Dump Suspicious Processes and Drivers
pslist - High level view of running processes
# vol.py pslist
psscan - Scan memory for EPROCESS blocks
# vol.py psscan
pstree - Display parent-process relationships
# vol.py pstree
Identify Rogue Processes
dlllist - List of loaded dlls by process
-p Show information only for specific process identifiers
(PIDs)
# vol.py dlllist –p 4,868
getsids - Print process security identifiers
-p Show information only for specific PIDs
# vol.py getsids –p 868
handles - List of open handles for each process
-p Show information only for specific PIDs
-t Display only handles of a certain type
{Process, Thread, Key, Event, File, Mutant, Token, Port}
# vol.py handles –p 868 –t Process,Mutant
filescan ‐ Scan memory for FILE_OBJECT handles
# vol.py filescan
svcscan - Scan for Windows Service information
# vol.py svcscan
Analyze Process DLLs and Handles
dlldump - Extract DLLs from specific processes
-p Dump DLLs only for specific PIDs
-b Dump DLLs from process at physical memory offset
-r Dump DLLs matching REGEX name
--dump-dir Directory to save extracted files
# vol.py dlldump --dump-dir ./output –r metsrv
moddump - Extract kernel drivers
-o Dump driver using offset address (from modscan)
-r Dump drivers matching REGEX name
--dump-dir Directory to save extracted files
# vol.py moddump --dump-dir ./output –r gaopdx
procmemdump - Dump process to executable sample
-p Dump only specific PIDs
-o Specify process by physical memory offset
--dump-dir Directory to save extracted files
# vol.py procmemdump --dump-dir ./output –p 868
memdump - Dump every memory section into a file
-p Dump memory sections from these PIDs
--dump-dir Directory to save extracted files
# vol.py memdump –dump-dir ./output –p 868
Connections - [XP] List of open TCP connections
# vol.py connections
connscan - [XP] ID TCP connections, including closed
# vol.py connscan
sockets - [XP] Print listening sockets (any protocol)
# vol.py sockets
sockscan - [XP] ID sockets, including closed/unlinked
# vol.py sockscan
netscan - [Win7] Scan for connections and sockets
# vol.py netscan
Review Network Artifacts
malfind - Find injected code and dump sections
-p Show information only for specific PIDs
-o Provide physical offset of single process to scan
--dump-dir Directory to save memory sections
# vol.py malfind --dump-dir ./output_dir
ldrmodules - Detect unlinked DLLs
-p Show information only for specific PIDs
-v Verbose: show full paths from three DLL lists
# vol.py ldrmodules –p 868 -v
Look for Evidence of Code Injection
psxview - Find hidden processes using cross-view
# vol.py psxview
modscan - Scan memory for loaded, unloaded, and
unlinked drivers
# vol.py modscan
apihooks - Find API/DLL function hooks
-p Operate only on specific PIDs
-Q Only scan critical processes and DLLS
# vol.py apihooks
ssdt - Hooks in System Service Descriptor Table
# vol.py ssdt | egrep –v ‘(ntoskrnl|win32k)’
driverirp - Identify I/O Request Packet (IRP) hooks
-r Analyze drivers matching REGEX name pattern
# vol.py driverirp –r tcpip
idt - Display Interrupt Descriptor Table
# vol.py idt
Check for Signs of a Rootkit
Getting Help
# vol.py –h (show options and supported plugins)
# vol.py plugin –h (show plugin usage)
# vol.py plugin --info (show available OS profiles)
Sample Command Line
# vol.py -f image --profile=profile plugin
Identify System Profile
imageinfo - Display memory image metadata
# vol.py –f mem.img imageinfo
Using Environment Variables
Set name of memory image (takes place of -f )
# export VOLATILITY_LOCATION=file:///images/mem.img
Set profile type (takes place of --profile= )
# export VOLATILITY_PROFILE=WinXPSP3x86
Getting Started with Volatility™](https://image.slidesharecdn.com/7tktjgptdsc3nnxoea32-signature-84c45345e90c3c665ed925645903cc80883c8ac6a681e4221fa788e2144b84d8-poli-140822184637-phpapp02/85/Memory-forensics-cheat-sheet-2-320.jpg)

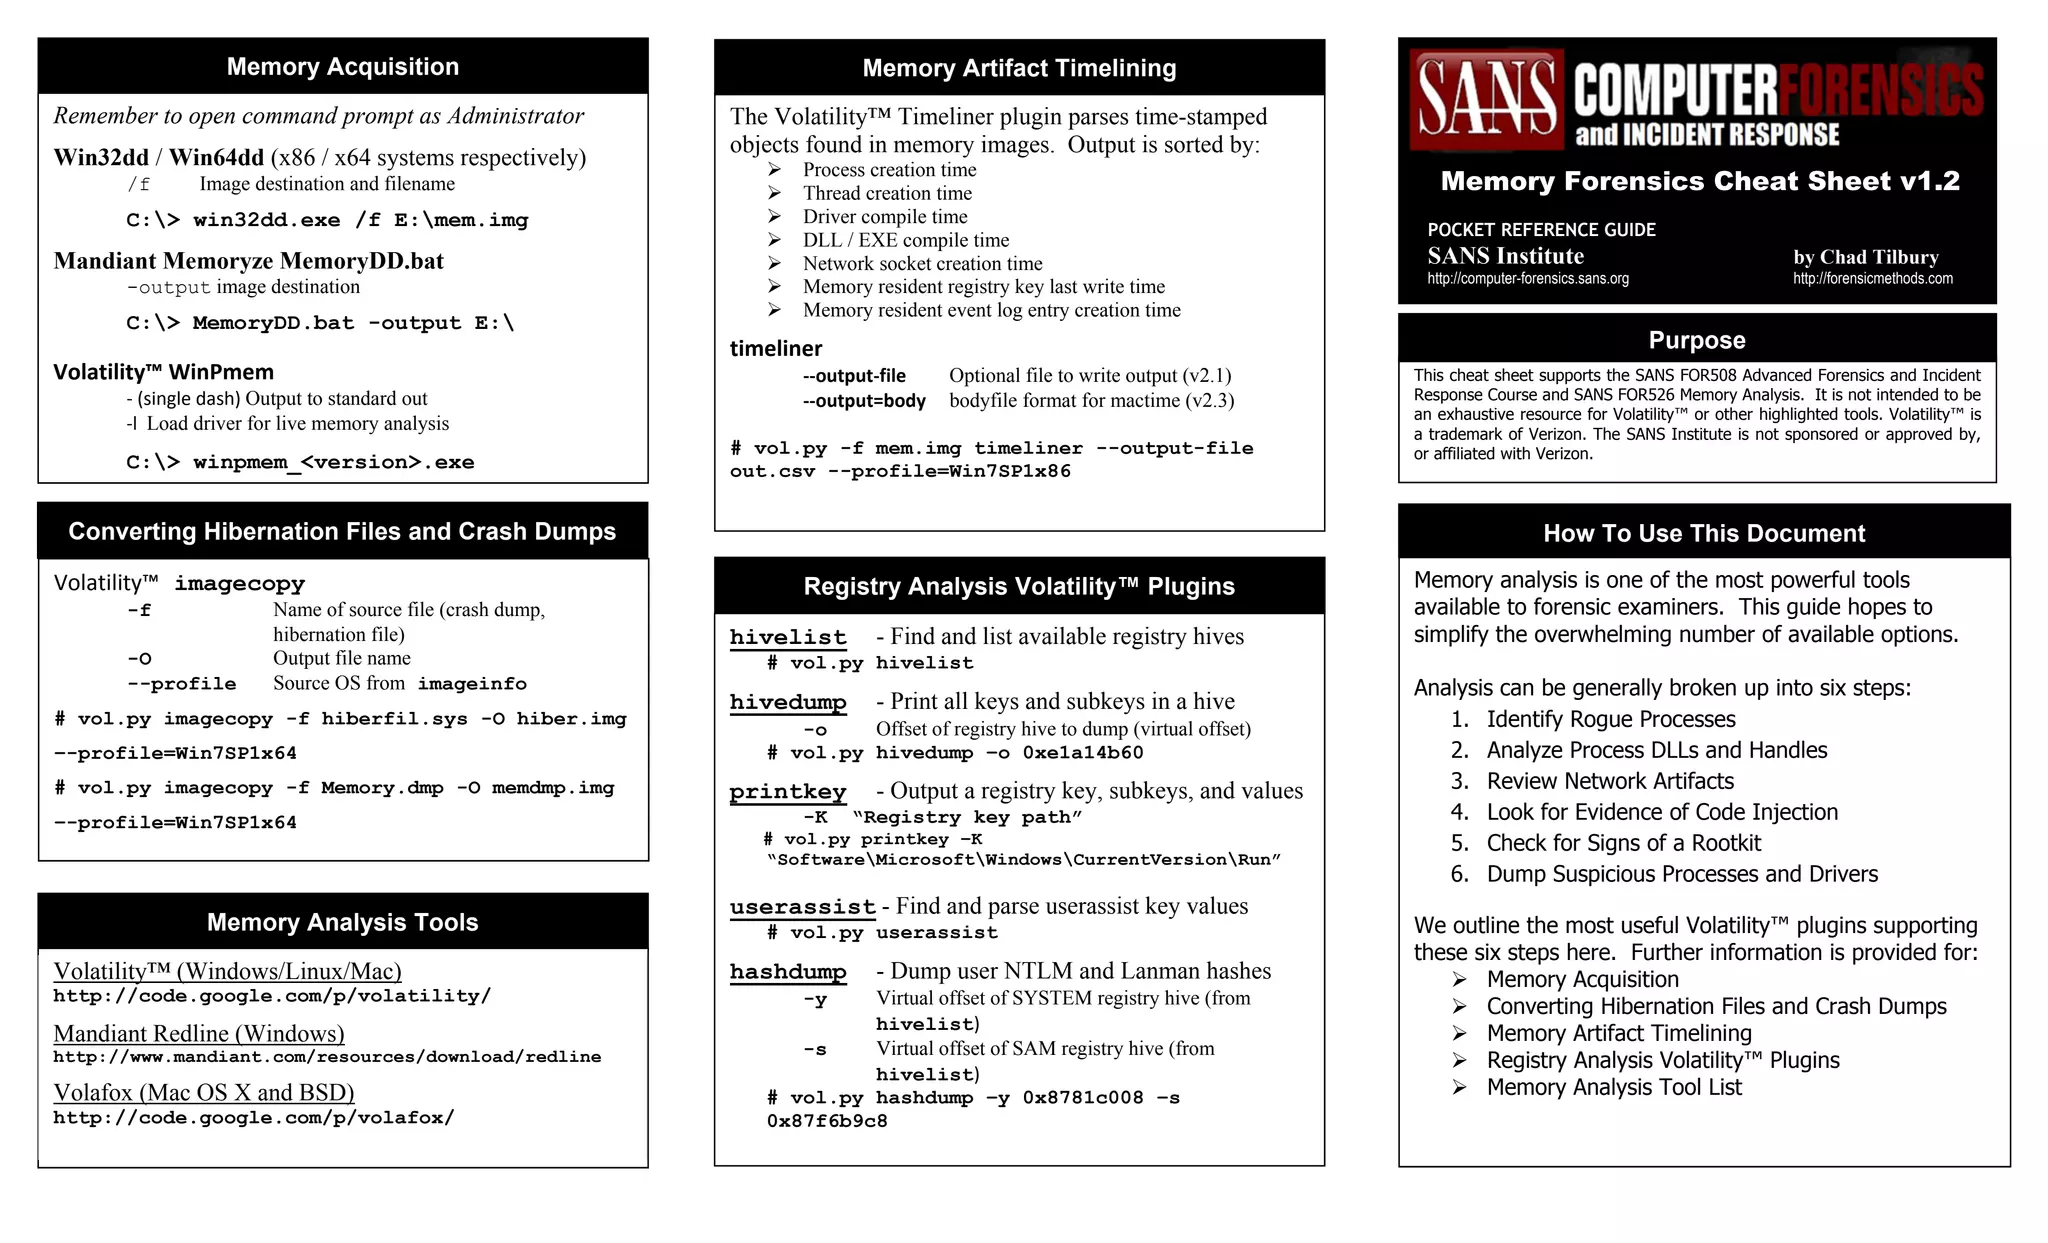
This document provides a summary of key Volatility plugins and memory analysis steps. It outlines plugins for identifying rogue processes, analyzing process DLLs and handles, reviewing network artifacts, checking for code injection evidence, looking for rootkit signs, and dumping suspicious processes/drivers. The document also provides information on memory acquisition, converting hibernation files and dumps, artifact timelining, and registry analysis plugins.


![First Responder Course - Session 9 - Volatile Evidence Collection [2004]](https://cdn.slidesharecdn.com/ss_thumbnails/publiccopy-9-volatileevidencecollection-130419072103-phpapp02-thumbnail.jpg?width=640&height=640&fit=bounds)


