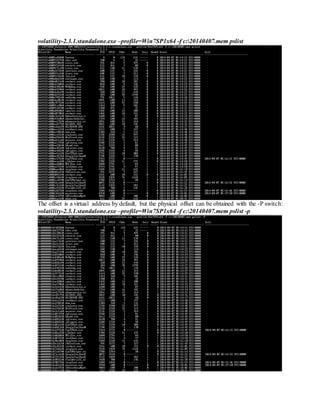
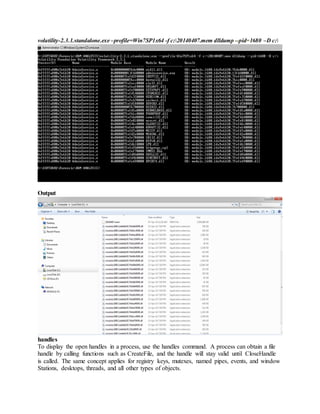
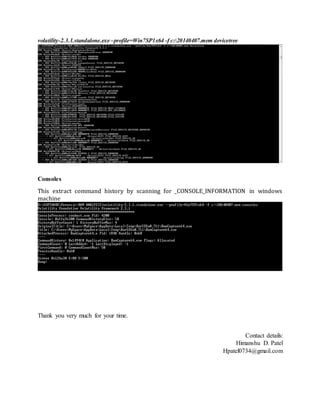
The document discusses the Volatility Framework, which is an open-source tool for extracting digital artifacts from volatile memory (RAM) samples on Windows, Linux, and Mac OS X systems. It provides commands to analyze processes, modules, memory, and other kernel objects in memory images. The summary includes high-level information on the supported operating systems, file formats, and some example commands like pslist, modules, and dlldump.


![hivedump
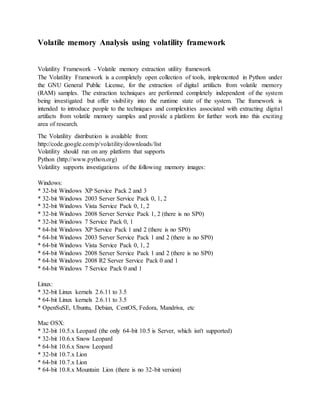
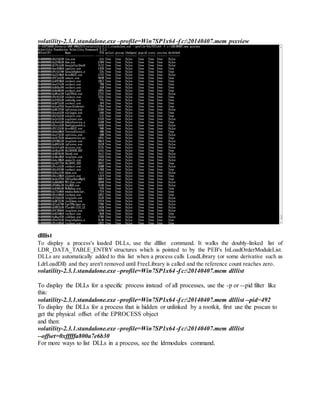
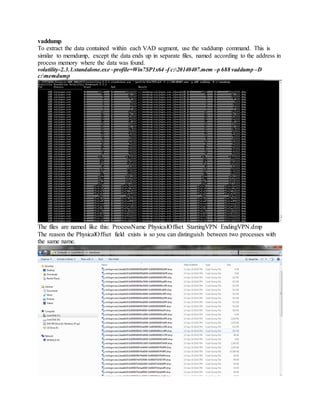
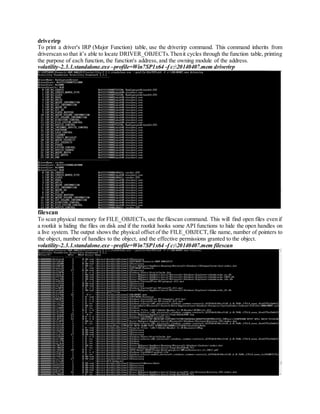
To recursively list all subkeys in a hive, use the hivedump command and pass it the virtual
address to the desired hive.
volatility-2.3.1.standalone.exe –profile=Win7SP1x64 -f c:20140407.mem hivedump
–o 0xfffff8a000024010
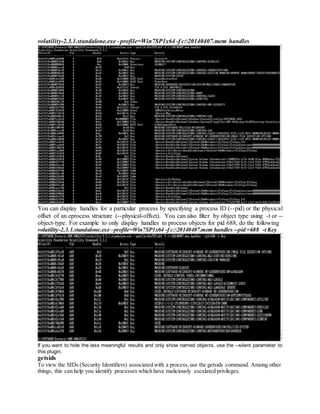
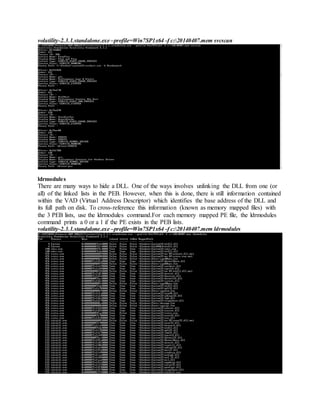
hashdump
To extract and decrypt cached domain credentials stored in the registry, use the hashdump
command.
To use hashdump, pass the virtual address of the SYSTEM hive as -y and the virtual address of
the SAM hive as -s, like this:
volatility-2.3.1.standalone.exe –profile=Win7SP1x64 -f c:20140407.mem hishdump
–y 0xfffff8a000024010 –s 0xfffff8a0013cd010
Hashes can now be cracked using John the Ripper, rainbow tables, etc.It is possible that a registry
key is not available in memory.
You can try to see if the correct keys are available: "CurrentControlSetControllsa" from
SYSTEM and "SAMDomainsAccount" from SAM. First we need to get the "CurrentControlSet",
for this we can use volshell. (replace [SYSTEM REGISTRY ADDRESS] below with the offset
you get from hivelist)](https://image.slidesharecdn.com/volatilememoryanalysis-150814171110-lva1-app6891/85/Volatile-memory-analysis-26-320.jpg)
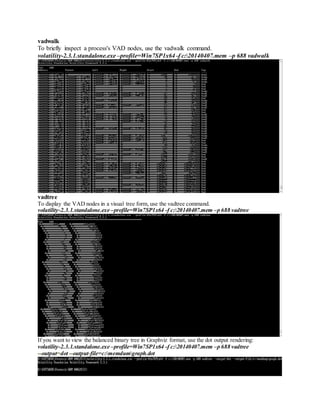
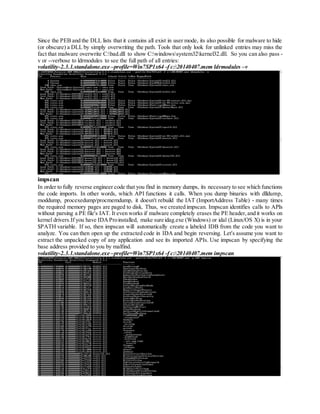
![Crash dump, hibernation, and conversion
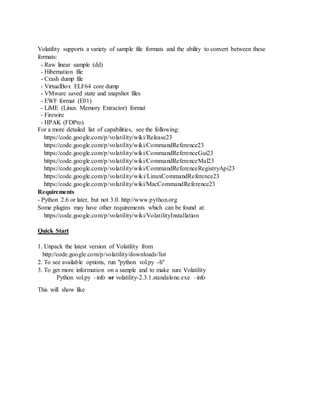
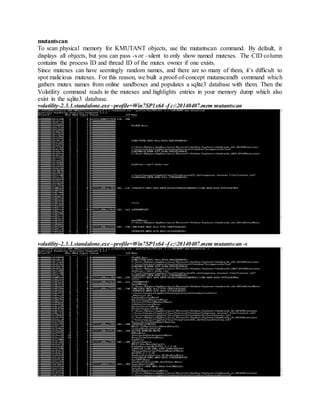
crashinfo
Information from the crashdump header can be printed using the crashinfo command.
volatility-2.3.1.standalone.exe –profile=Win7SP1x64 -f c:20140407.mem crashinfo
it may shows like this
Volatile Systems Volatility Framework 2.0
DUMP_HEADER32:
Majorversion: 0x0000000f (15)
Minorversion: 0x00001db0 (7600)
KdSecondaryVersion 0x00000041
DirectoryTableBase 0x00185000
PfnDataBase 0x83a00000
PsLoadedModuleList 0x82984810
PsActiveProcessHead 0x8297ce98
MachineImageType 0x0000014c
NumberProcessors 0x00000001
BugCheckCode 0x5454414d
PaeEnabled 0x00000001
KdDebuggerDataBlock 0x82964be8
ProductType 0x45474150
SuiteMask 0x45474150
WriterStatus 0x45474150
Physical Memory Description:
Number of runs: 3
FileOffset Start Address Length
00001000 00001000 0009e000
0009f000 00100000 3fdf0000
3fe8f000 3ff00000 00100000
3ff8e000 3ffff000
Hibinfo
The hibinfo command reveals additional information stored in the hibernation file, including the
state of the Control Registers, such as CR0, etc. It also identifies the time at which the hibernation
file was created, the state of the hibernation file, and the version of windows being hibernated.
Example output for the function is shown below:
volatility-2.3.1.standalone.exe -f hiberfil.sys hibinfo
Volatile Systems Volatility Framework 2.0
IMAGE_HIBER_HEADER:
Signature: hibr
SystemTime: 2014-19-04 15:33:26
Control registers flags
CR0: 80010031
CR0[PAGING]: 1
CR3: 1a300060
CR4: 000006f9
CR4[PSE]: 1
CR4[PAE]: 1
Windows Version is 5.1 (2600)](https://image.slidesharecdn.com/volatilememoryanalysis-150814171110-lva1-app6891/85/Volatile-memory-analysis-28-320.jpg)


![[D2] java 애플리케이션 트러블 슈팅 사례 & pinpoint](https://cdn.slidesharecdn.com/ss_thumbnails/d2javapinpoint-150522091509-lva1-app6891-thumbnail.jpg?width=640&height=640&fit=bounds)


![First Responder Course - Session 9 - Volatile Evidence Collection [2004]](https://cdn.slidesharecdn.com/ss_thumbnails/publiccopy-9-volatileevidencecollection-130419072103-phpapp02-thumbnail.jpg?width=640&height=640&fit=bounds)


