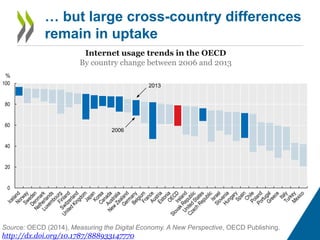
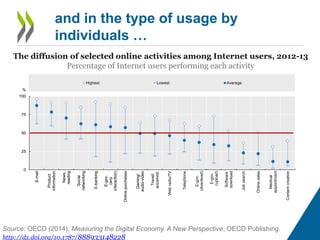
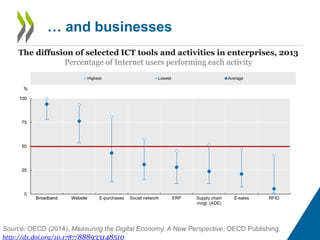
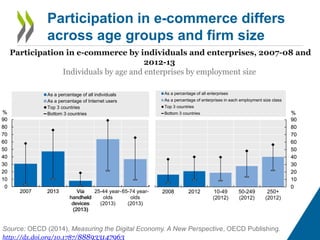
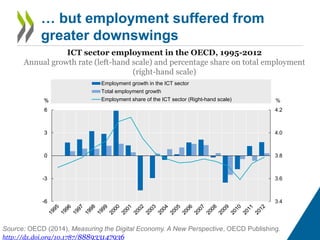
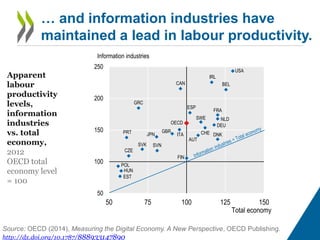
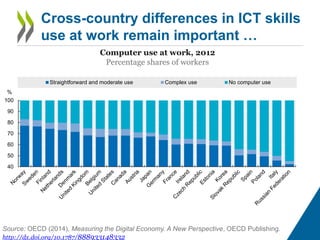
MEASURING THE DIGITAL ECONOMY 
A NEW PERSPECTIVE 
Global Forum on the 
Knowledge Economy 
Tokyo 
2 October 2014 
Andrew Wyckoff 
Director for Science, Technology and Innovation 
OECD
The mobile broadband 
revolution
125 
100 
75 
50 
25 
0 
3 out of 4 OECD inhabitants have a 
mobile wireless broadband 
Mobile wireless broadband penetration, by technology, 
Terrestrial mobile wireless Satellite Terrestrial fixed wireless All technologies, 2009 
Subscriptions per 100 inhabitants 
December 2009 and 2013 
Subscriptions per 100 inhabitants 
Source: OECD (2014), Measuring the Digital Economy. A New Perspective, OECD Publishing. 
http://dx.doi.org/10.1787/888933147973
Millions 
350 
300 
250 
200 
150 
100 
50 
0 
Devices are becoming powerful and 
affordable 
The progress of smartphones, 2010-13 
Quarterly global shipping trends 
Smartphones Other mobile phones 
Source: OECD (2014), Measuring the Digital Economy. A New Perspective, OECD Publishing. 
http://dx.doi.org/10.1787/888933147808
New and more data-intensive 
applications
Fixed (wired) broadband penetration rates by speed tiers, December 2013 
50 
40 
30 
20 
10 
0 
Broadband speed has been increasing … 
> 10 mbps > 4 mbps / < 10 mbps < 4 mbps 
Subscriptions per 100 inhabitants 
As a percentage of subscriptions 
Source: OECD (2014), Measuring the Digital Economy. A New Perspective, OECD Publishing. 
http://dx.doi.org/10.1787/888933148053
… while the cost of data storage has 
been declining 
Average data storage cost for consumers, 1998-2012 
Per Gbit 
60 
50 
40 
30 
20 
10 
0 
1998 1999 2000 2001 2002 2003 2004 2005 2006 2007 2008 2009 2010 2011 2012 
USD 
Hard disk drives Solid-state drives 
Source: OECD (2014), Measuring the Digital Economy. A New Perspective, OECD Publishing. 
http://dx.doi.org/10.1787/888933147819
Emerging data-mining techniques are leading 
to innovations that increase well-being 
Cost of genome sequencing, 2001-14 
Cost per genome, logarithmic scale 
USD current 
100000 
10000 
1000 
100 
10 
1 
1 million USD 
10 000 USD 
Source: OECD (2014), Measuring the Digital Economy. A New Perspective, OECD Publishing. 
http://dx.doi.org/10.1787/888933147871
Usage rates are reaching 
saturation in some countries, 
with catch up potential for 
laggers
People are increasingly using the 
Internet … 
Internet usage trends in the OECD 
By country change between 2006 and 2013 
% 
100 
80 
60 
40 
Inter-country gap (percentage points) Average (all countries) 
Highest ranking country 
20 
0 
Lowest ranking country 
2005 2006 2007 2008 2009 2010 2011 2012 2013 
Source: OECD (2014), Measuring the Digital Economy. A New Perspective, OECD Publishing. 
http://dx.doi.org/10.1787/888933147770
… but large cross-country differences 
remain in uptake 
Internet usage trends in the OECD 
By country change between 2006 and 2013 
% 
100 
80 
60 
40 
20 
0 
2006 
2013 
Source: OECD (2014), Measuring the Digital Economy. A New Perspective, OECD Publishing. 
http://dx.doi.org/10.1787/888933147770
and in the type of usage by 
individuals … 
The diffusion of selected online activities among Internet users, 2012-13 
Percentage of Internet users performing each activity 
100 
75 
50 
25 
0 
E-mail 
Product 
information 
News 
reading 
Social 
networking 
E-banking 
E-gov. 
(any 
interaction) 
Online purchases 
Gaming/ 
audio-video 
Travel/ 
accomod. 
% 
Highest Lowest Average 
Web radio/TV 
Telephone 
E-gov. 
(download) 
E-gov. 
(upload) 
Software 
download 
Job search 
Online sales 
Medical 
appointment 
Content creation 
Source: OECD (2014), Measuring the Digital Economy. A New Perspective, OECD Publishing. 
http://dx.doi.org/10.1787/888933148228
… and businesses 
The diffusion of selected ICT tools and activities in enterprises, 2013 
Percentage of Internet users performing each activity 
100 
75 
50 
25 
0 
Broadband Website 
% 
Highest Lowest Average 
E-purchases Social network ERP Supply chain 
mngt. (ADE) 
E-sales RFID 
Source: OECD (2014), Measuring the Digital Economy. A New Perspective, OECD Publishing. 
http://dx.doi.org/10.1787/888933148510
Participation in e-commerce differs 
across age groups and firm size 
Participation in e-commerce by individuals and enterprises, 2007-08 and 
2012-13 
Individuals by age and enterprises by employment size 
90 
80 
70 
60 
50 
40 
30 
20 
10 
0 
2007 2013 Via 
handheld 
devices 
(2013) 
% 
As a percentage of all individuals 
As a percentage of Internet users 
Top 3 countries 
Bottom 3 countries 
25-44 year-olds 
(2013) 
65-74 year-olds 
(2013) 
90 
80 
70 
60 
50 
40 
30 
20 
10 
0 
2008 2012 
10-49 
(2012) 
50-249 
(2012) 
250+ 
(2012) 
% 
As a percentage of all enterprises 
As a percentage of enterprises in each employment size class 
Top 3 countries 
Bottom 3 countries 
Source: OECD (2014), Measuring the Digital Economy. A New Perspective, OECD Publishing. 
http://dx.doi.org/10.1787/888933147963
ICT industries continue to 
be dynamic and 
innovative, despite 
sluggish employment in 
the crisis
The dynamism of the ICT sector 
showed up also during the crisis … 
Net business population growth between 2009 and 2012 
Average annual growth rate 
% 
10 
8 
6 
4 
2 
0 
-2 
-4 
-6 
ICT sector Business economy 
16 
Source: OECD (2014), Measuring the Digital Economy. A New Perspective, OECD Publishing. 
http://dx.doi.org/10.1787/888933148696
… but employment suffered from 
greater downswings 
ICT sector employment in the OECD, 1995-2012 
Annual growth rate (left-hand scale) and percentage share on total employment 
(right-hand scale) 
% % 
4.2 
4.0 
3.8 
3.6 
3.4 
6 
3 
0 
-3 
-6 
Employment growth in the ICT sector 
Total employment growth 
Employment share of the ICT sector (Right-hand scale) 
Employment growth in the ICT sector 
Total employment growth 
Employment share of the ICT sector (Right-hand scale) 
Source: OECD (2014), Measuring the Digital Economy. A New Perspective, OECD Publishing. 
http://dx.doi.org/10.1787/888933147936
… and information industries have 
maintained a lead in labour productivity. 
Apparent 
labour 
productivity 
levels, 
information 
industries 
vs. total 
economy, 
2012 
OECD total 
economy level 
= 100 
Information industries 
GRC 
PRT 
CAN 
IRL 
USA 
CZE 
ESP 
JPN 
BEL 
SVK 
POL 
OECD 
GBR 
ITA 
SWE 
HUN 
SVN 
FRA 
NLD 
CHE 
EST 
DEU 
AUT 
DNK 
FIN 
250 
200 
150 
100 
50 
50 75 100 125 150 
Total economy 
Source: OECD (2014), Measuring the Digital Economy. A New Perspective, OECD Publishing. 
http://dx.doi.org/10.1787/888933147890
Harnessing the potential 
of the digital economy: 
new skills for workers, firms 
and users are needed
Cross-country differences in ICT skills 
use at work remain important … 
Computer use at work, 2012 
Percentage shares of workers 
% 
100 
90 
80 
70 
60 
50 
40 
Straightforward and moderate use Complex use No computer use 
Source: OECD (2014), Measuring the Digital Economy. A New Perspective, OECD Publishing. 
http://dx.doi.org/10.1787/888933148332
… as the generalised need for further 
acquisition of (new) ICT skills. 
Individuals who judge their computer skills to be sufficient if 
they were to apply for a new job within a year, 2013 
As a percentage of all individuals 
% 
90 
80 
70 
60 
50 
40 
30 
20 
10 
0 
All Individuals Individuals with high formal education Individuals with no or low formal education 
Source: OECD (2014), Measuring the Digital Economy. A New Perspective, OECD Publishing. 
http://dx.doi.org/10.1787/888933148354
Find MORE: 113 indicators 
 The digital economy today 
 Investing in smart infrastructure 
 Empowering society 
 Unleashing creativity and innovation 
 Delivering growth and jobs
An OECD effort to … 
 Mark progress on ICT indicators 
 Identify data gaps 
 Propose actions to advance the 
measurement agenda
MEASURING THE DIGITAL ECONOMY 
A NEW PERSPECTIVE 
Send us feedback: 
sti.contact@oecd.org 
THANKS! 
www.oecd.org/sti/ 
measuring-the-digital-economy.htm

Measuring the Digital Economy: A New Perspective

  • 1.
    MEASURING THE DIGITALECONOMY A NEW PERSPECTIVE Global Forum on the Knowledge Economy Tokyo 2 October 2014 Andrew Wyckoff Director for Science, Technology and Innovation OECD
  • 2.
  • 3.
    125 100 75 50 25 0 3 out of 4 OECD inhabitants have a mobile wireless broadband Mobile wireless broadband penetration, by technology, Terrestrial mobile wireless Satellite Terrestrial fixed wireless All technologies, 2009 Subscriptions per 100 inhabitants December 2009 and 2013 Subscriptions per 100 inhabitants Source: OECD (2014), Measuring the Digital Economy. A New Perspective, OECD Publishing. http://dx.doi.org/10.1787/888933147973
  • 4.
    Millions 350 300 250 200 150 100 50 0 Devices are becoming powerful and affordable The progress of smartphones, 2010-13 Quarterly global shipping trends Smartphones Other mobile phones Source: OECD (2014), Measuring the Digital Economy. A New Perspective, OECD Publishing. http://dx.doi.org/10.1787/888933147808
  • 5.
    New and moredata-intensive applications
  • 6.
    Fixed (wired) broadbandpenetration rates by speed tiers, December 2013 50 40 30 20 10 0 Broadband speed has been increasing … > 10 mbps > 4 mbps / < 10 mbps < 4 mbps Subscriptions per 100 inhabitants As a percentage of subscriptions Source: OECD (2014), Measuring the Digital Economy. A New Perspective, OECD Publishing. http://dx.doi.org/10.1787/888933148053
  • 7.
    … while thecost of data storage has been declining Average data storage cost for consumers, 1998-2012 Per Gbit 60 50 40 30 20 10 0 1998 1999 2000 2001 2002 2003 2004 2005 2006 2007 2008 2009 2010 2011 2012 USD Hard disk drives Solid-state drives Source: OECD (2014), Measuring the Digital Economy. A New Perspective, OECD Publishing. http://dx.doi.org/10.1787/888933147819
  • 8.
    Emerging data-mining techniquesare leading to innovations that increase well-being Cost of genome sequencing, 2001-14 Cost per genome, logarithmic scale USD current 100000 10000 1000 100 10 1 1 million USD 10 000 USD Source: OECD (2014), Measuring the Digital Economy. A New Perspective, OECD Publishing. http://dx.doi.org/10.1787/888933147871
  • 9.
    Usage rates arereaching saturation in some countries, with catch up potential for laggers
  • 10.
    People are increasinglyusing the Internet … Internet usage trends in the OECD By country change between 2006 and 2013 % 100 80 60 40 Inter-country gap (percentage points) Average (all countries) Highest ranking country 20 0 Lowest ranking country 2005 2006 2007 2008 2009 2010 2011 2012 2013 Source: OECD (2014), Measuring the Digital Economy. A New Perspective, OECD Publishing. http://dx.doi.org/10.1787/888933147770
  • 11.
    … but largecross-country differences remain in uptake Internet usage trends in the OECD By country change between 2006 and 2013 % 100 80 60 40 20 0 2006 2013 Source: OECD (2014), Measuring the Digital Economy. A New Perspective, OECD Publishing. http://dx.doi.org/10.1787/888933147770
  • 12.
    and in thetype of usage by individuals … The diffusion of selected online activities among Internet users, 2012-13 Percentage of Internet users performing each activity 100 75 50 25 0 E-mail Product information News reading Social networking E-banking E-gov. (any interaction) Online purchases Gaming/ audio-video Travel/ accomod. % Highest Lowest Average Web radio/TV Telephone E-gov. (download) E-gov. (upload) Software download Job search Online sales Medical appointment Content creation Source: OECD (2014), Measuring the Digital Economy. A New Perspective, OECD Publishing. http://dx.doi.org/10.1787/888933148228
  • 13.
    … and businesses The diffusion of selected ICT tools and activities in enterprises, 2013 Percentage of Internet users performing each activity 100 75 50 25 0 Broadband Website % Highest Lowest Average E-purchases Social network ERP Supply chain mngt. (ADE) E-sales RFID Source: OECD (2014), Measuring the Digital Economy. A New Perspective, OECD Publishing. http://dx.doi.org/10.1787/888933148510
  • 14.
    Participation in e-commercediffers across age groups and firm size Participation in e-commerce by individuals and enterprises, 2007-08 and 2012-13 Individuals by age and enterprises by employment size 90 80 70 60 50 40 30 20 10 0 2007 2013 Via handheld devices (2013) % As a percentage of all individuals As a percentage of Internet users Top 3 countries Bottom 3 countries 25-44 year-olds (2013) 65-74 year-olds (2013) 90 80 70 60 50 40 30 20 10 0 2008 2012 10-49 (2012) 50-249 (2012) 250+ (2012) % As a percentage of all enterprises As a percentage of enterprises in each employment size class Top 3 countries Bottom 3 countries Source: OECD (2014), Measuring the Digital Economy. A New Perspective, OECD Publishing. http://dx.doi.org/10.1787/888933147963
  • 15.
    ICT industries continueto be dynamic and innovative, despite sluggish employment in the crisis
  • 16.
    The dynamism ofthe ICT sector showed up also during the crisis … Net business population growth between 2009 and 2012 Average annual growth rate % 10 8 6 4 2 0 -2 -4 -6 ICT sector Business economy 16 Source: OECD (2014), Measuring the Digital Economy. A New Perspective, OECD Publishing. http://dx.doi.org/10.1787/888933148696
  • 17.
    … but employmentsuffered from greater downswings ICT sector employment in the OECD, 1995-2012 Annual growth rate (left-hand scale) and percentage share on total employment (right-hand scale) % % 4.2 4.0 3.8 3.6 3.4 6 3 0 -3 -6 Employment growth in the ICT sector Total employment growth Employment share of the ICT sector (Right-hand scale) Employment growth in the ICT sector Total employment growth Employment share of the ICT sector (Right-hand scale) Source: OECD (2014), Measuring the Digital Economy. A New Perspective, OECD Publishing. http://dx.doi.org/10.1787/888933147936
  • 18.
    … and informationindustries have maintained a lead in labour productivity. Apparent labour productivity levels, information industries vs. total economy, 2012 OECD total economy level = 100 Information industries GRC PRT CAN IRL USA CZE ESP JPN BEL SVK POL OECD GBR ITA SWE HUN SVN FRA NLD CHE EST DEU AUT DNK FIN 250 200 150 100 50 50 75 100 125 150 Total economy Source: OECD (2014), Measuring the Digital Economy. A New Perspective, OECD Publishing. http://dx.doi.org/10.1787/888933147890
  • 19.
    Harnessing the potential of the digital economy: new skills for workers, firms and users are needed
  • 20.
    Cross-country differences inICT skills use at work remain important … Computer use at work, 2012 Percentage shares of workers % 100 90 80 70 60 50 40 Straightforward and moderate use Complex use No computer use Source: OECD (2014), Measuring the Digital Economy. A New Perspective, OECD Publishing. http://dx.doi.org/10.1787/888933148332
  • 21.
    … as thegeneralised need for further acquisition of (new) ICT skills. Individuals who judge their computer skills to be sufficient if they were to apply for a new job within a year, 2013 As a percentage of all individuals % 90 80 70 60 50 40 30 20 10 0 All Individuals Individuals with high formal education Individuals with no or low formal education Source: OECD (2014), Measuring the Digital Economy. A New Perspective, OECD Publishing. http://dx.doi.org/10.1787/888933148354
  • 22.
    Find MORE: 113indicators  The digital economy today  Investing in smart infrastructure  Empowering society  Unleashing creativity and innovation  Delivering growth and jobs
  • 23.
    An OECD effortto …  Mark progress on ICT indicators  Identify data gaps  Propose actions to advance the measurement agenda
  • 24.
    MEASURING THE DIGITALECONOMY A NEW PERSPECTIVE Send us feedback: sti.contact@oecd.org THANKS! www.oecd.org/sti/ measuring-the-digital-economy.htm