Download to read offline
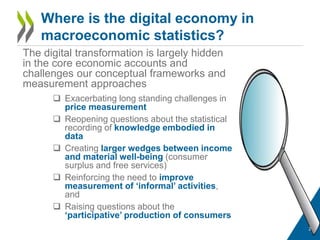
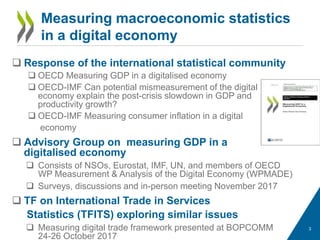
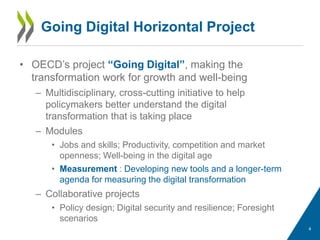
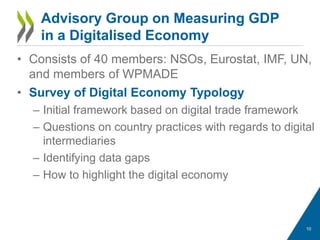
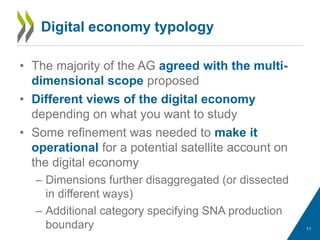
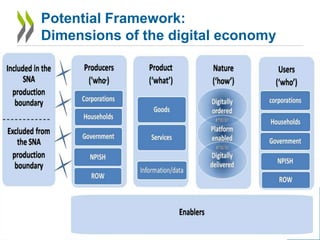
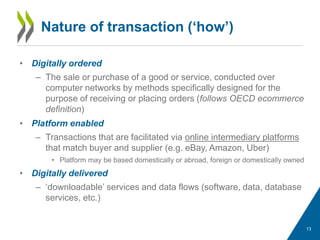
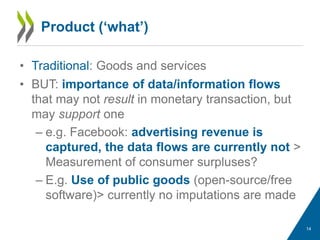
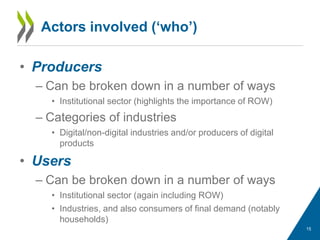
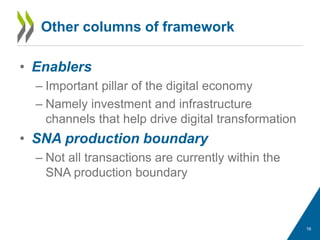

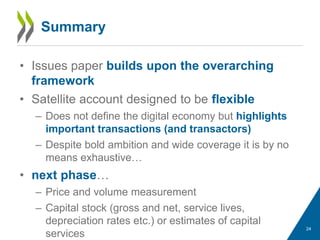
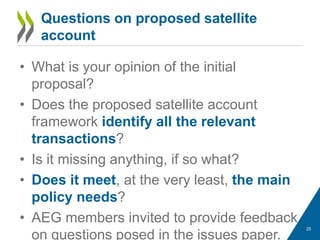


The document discusses challenges in measuring the digital economy within macroeconomic statistics and national accounts. It summarizes various international responses to these challenges, including projects by the OECD, IMF, and advisory groups. An advisory group proposed a multidimensional framework to characterize different aspects of the digital economy, including the nature of transactions, products, actors, and enabling factors. This framework could form the basis of an experimental satellite account to better capture digital economic activity. The document seeks feedback on operationalizing this framework and ensuring it meets key policy needs.


