Download to read offline


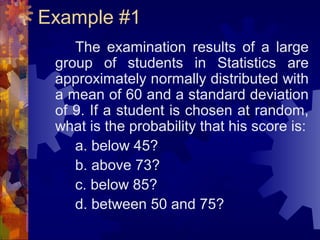


This document provides examples of using the standard normal distribution to calculate probabilities from exam scores and efficiency ratings that follow a normal distribution. The first example calculates the probability of a randomly selected student scoring below 45, above 73, below 85, and between 50 and 75 based on exam results with a mean of 60 and standard deviation of 9. The second example similarly calculates the number of faculty with efficiency ratings above 86, above 80, and between 80 and 90 given a mean of 86 and standard deviation of 4.25.


