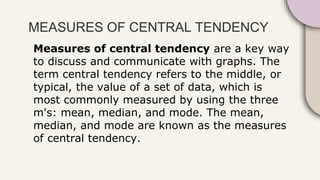
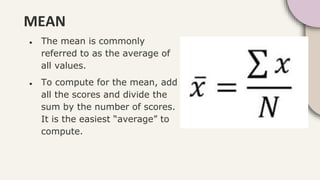
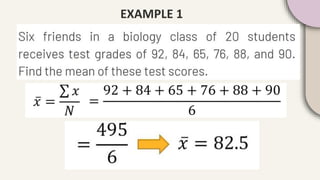
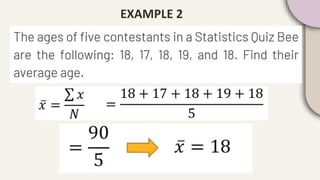
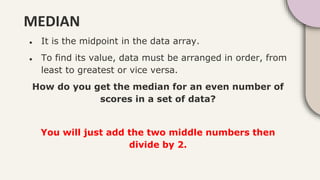
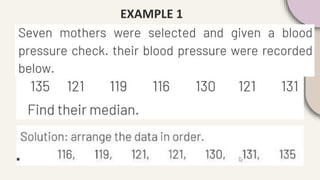
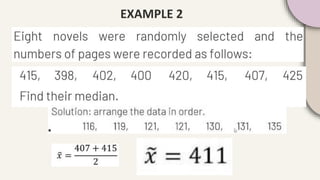
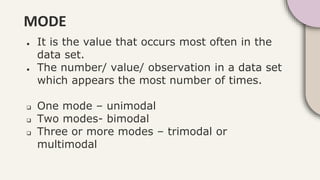
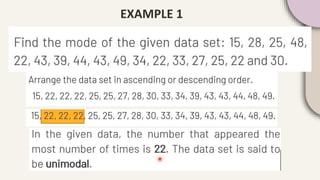
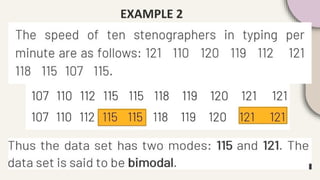
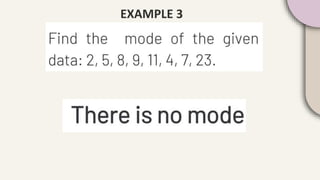
3. MEASURES OF CENTRAL TENDENCY
Measures of central tendency are a key way
to discuss and communicate with graphs. The
term central tendency refers to the middle, or
typical, the value of a set of data, which is
most commonly measured by using the three
m's: mean, median, and mode. The mean,
median, and mode are known as the measures
of central tendency.
4. MEAN
● The mean is commonly
referred to as the average of
all values.
● To compute for the mean, add
all the scores and divide the
sum by the number of scores.
It is the easiest “average” to
compute.
7. MEDIAN
● It is the midpoint in the data array.
● To find its value, data must be arranged in order, from
least to greatest or vice versa.
How do you get the median for an even number of
scores in a set of data?
You will just add the two middle numbers then
divide by 2.
10. MODE
● It is the value that occurs most often in the
data set.
● The number/ value/ observation in a data set
which appears the most number of times.
One mode – unimodal
Two modes- bimodal
Three or more modes – trimodal or
multimodal