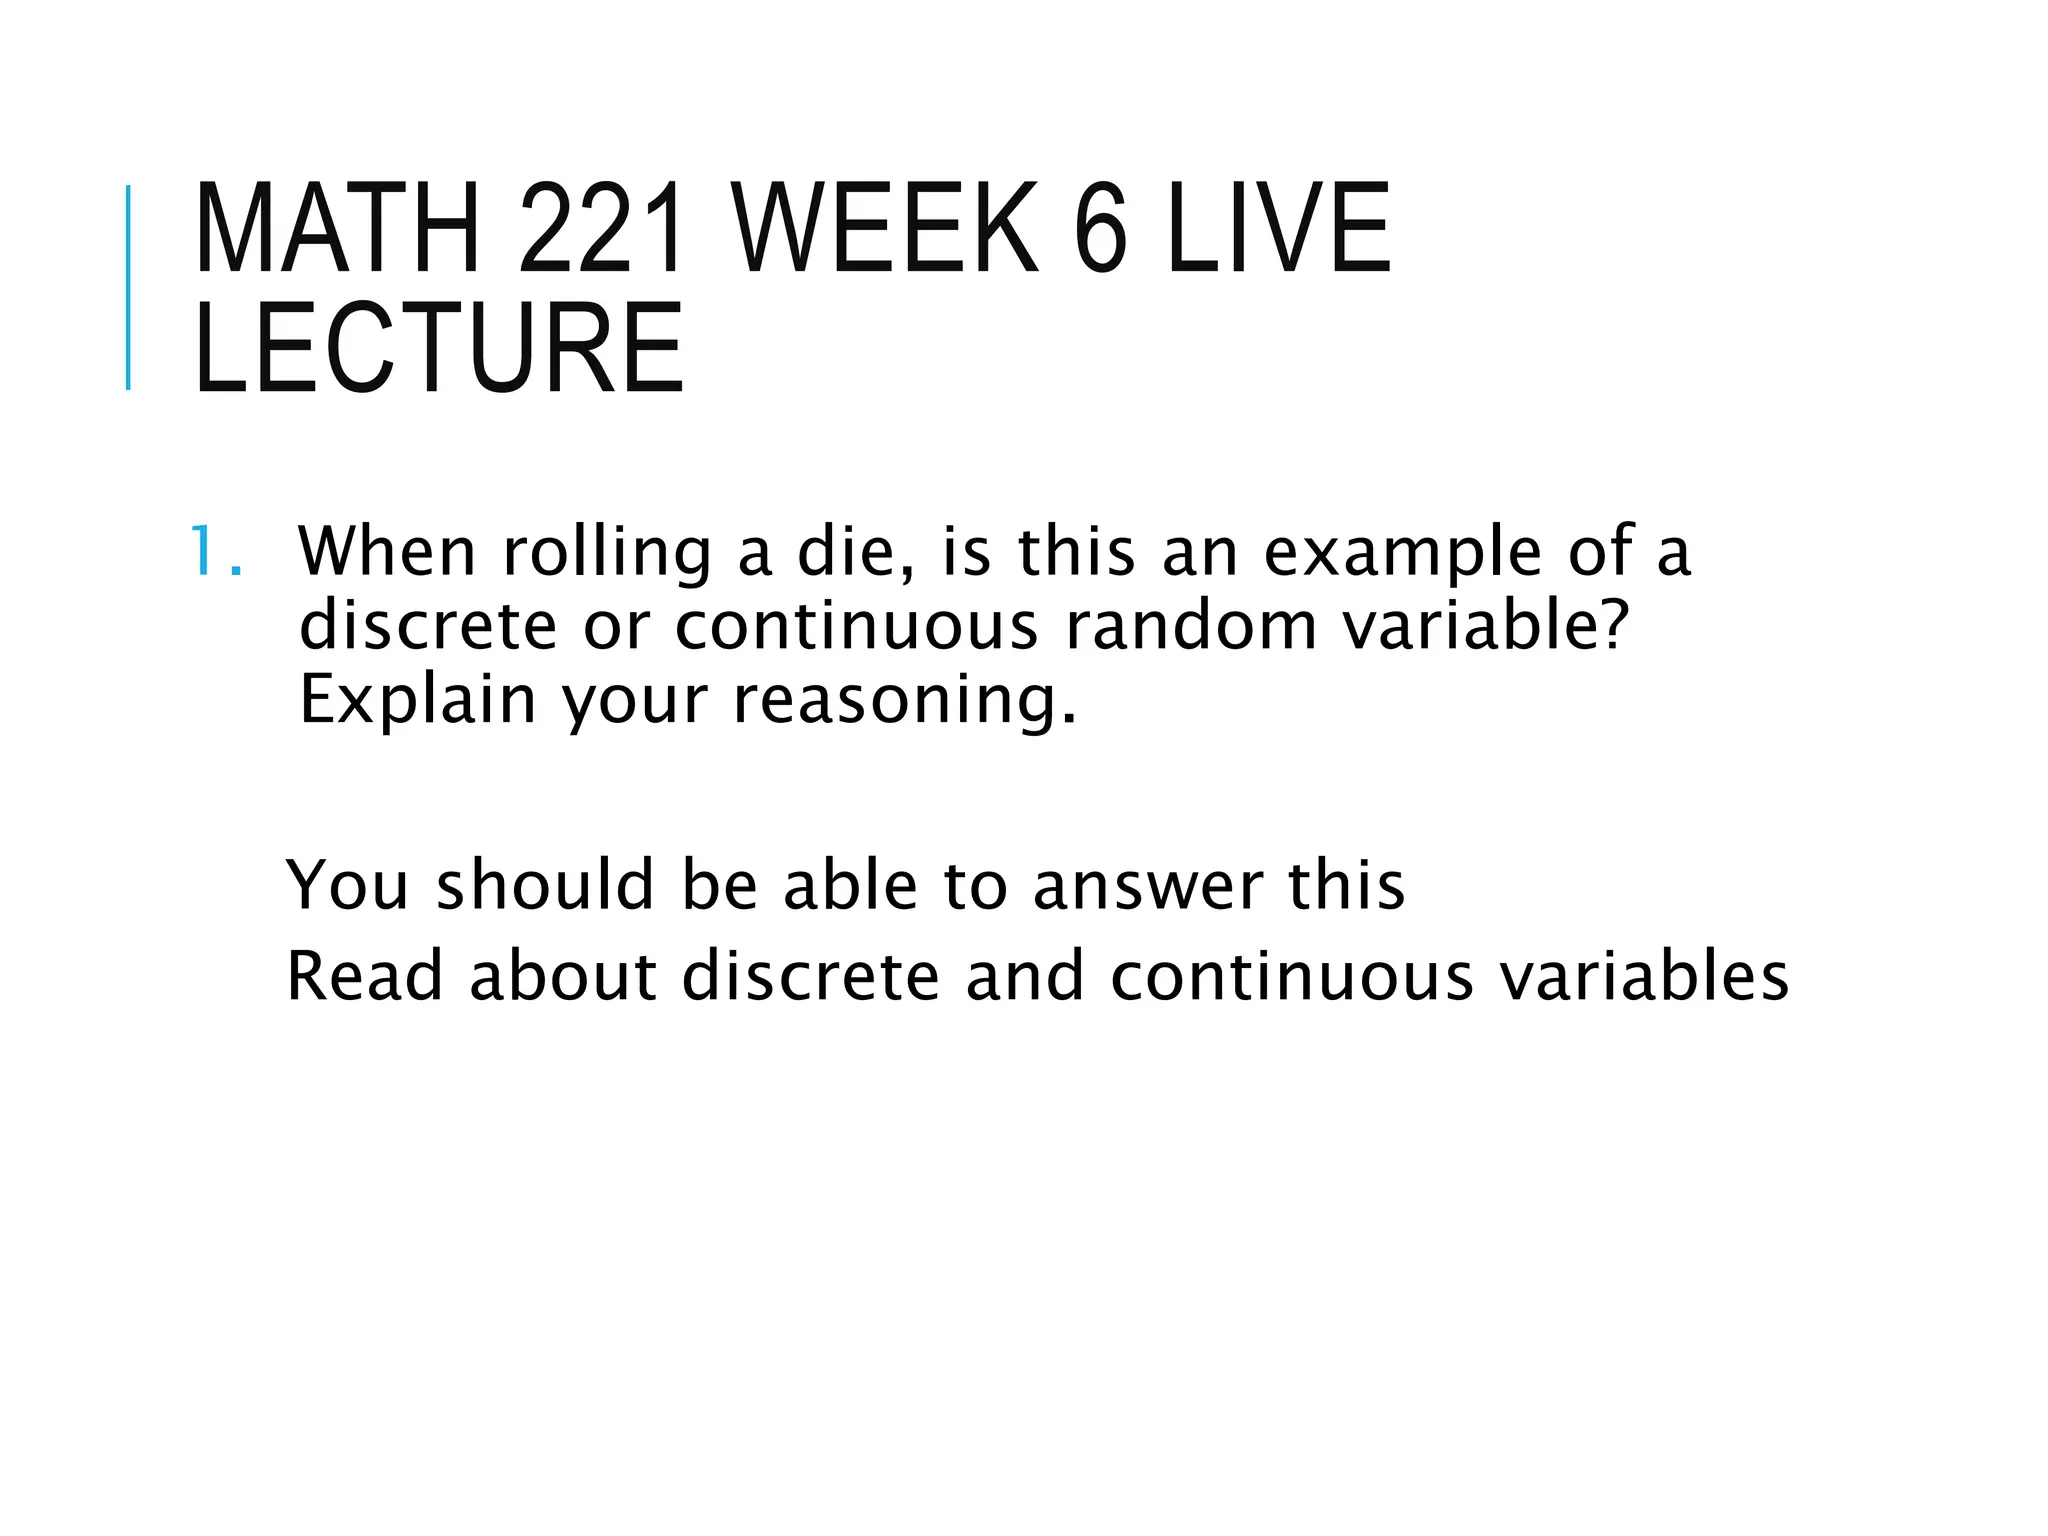
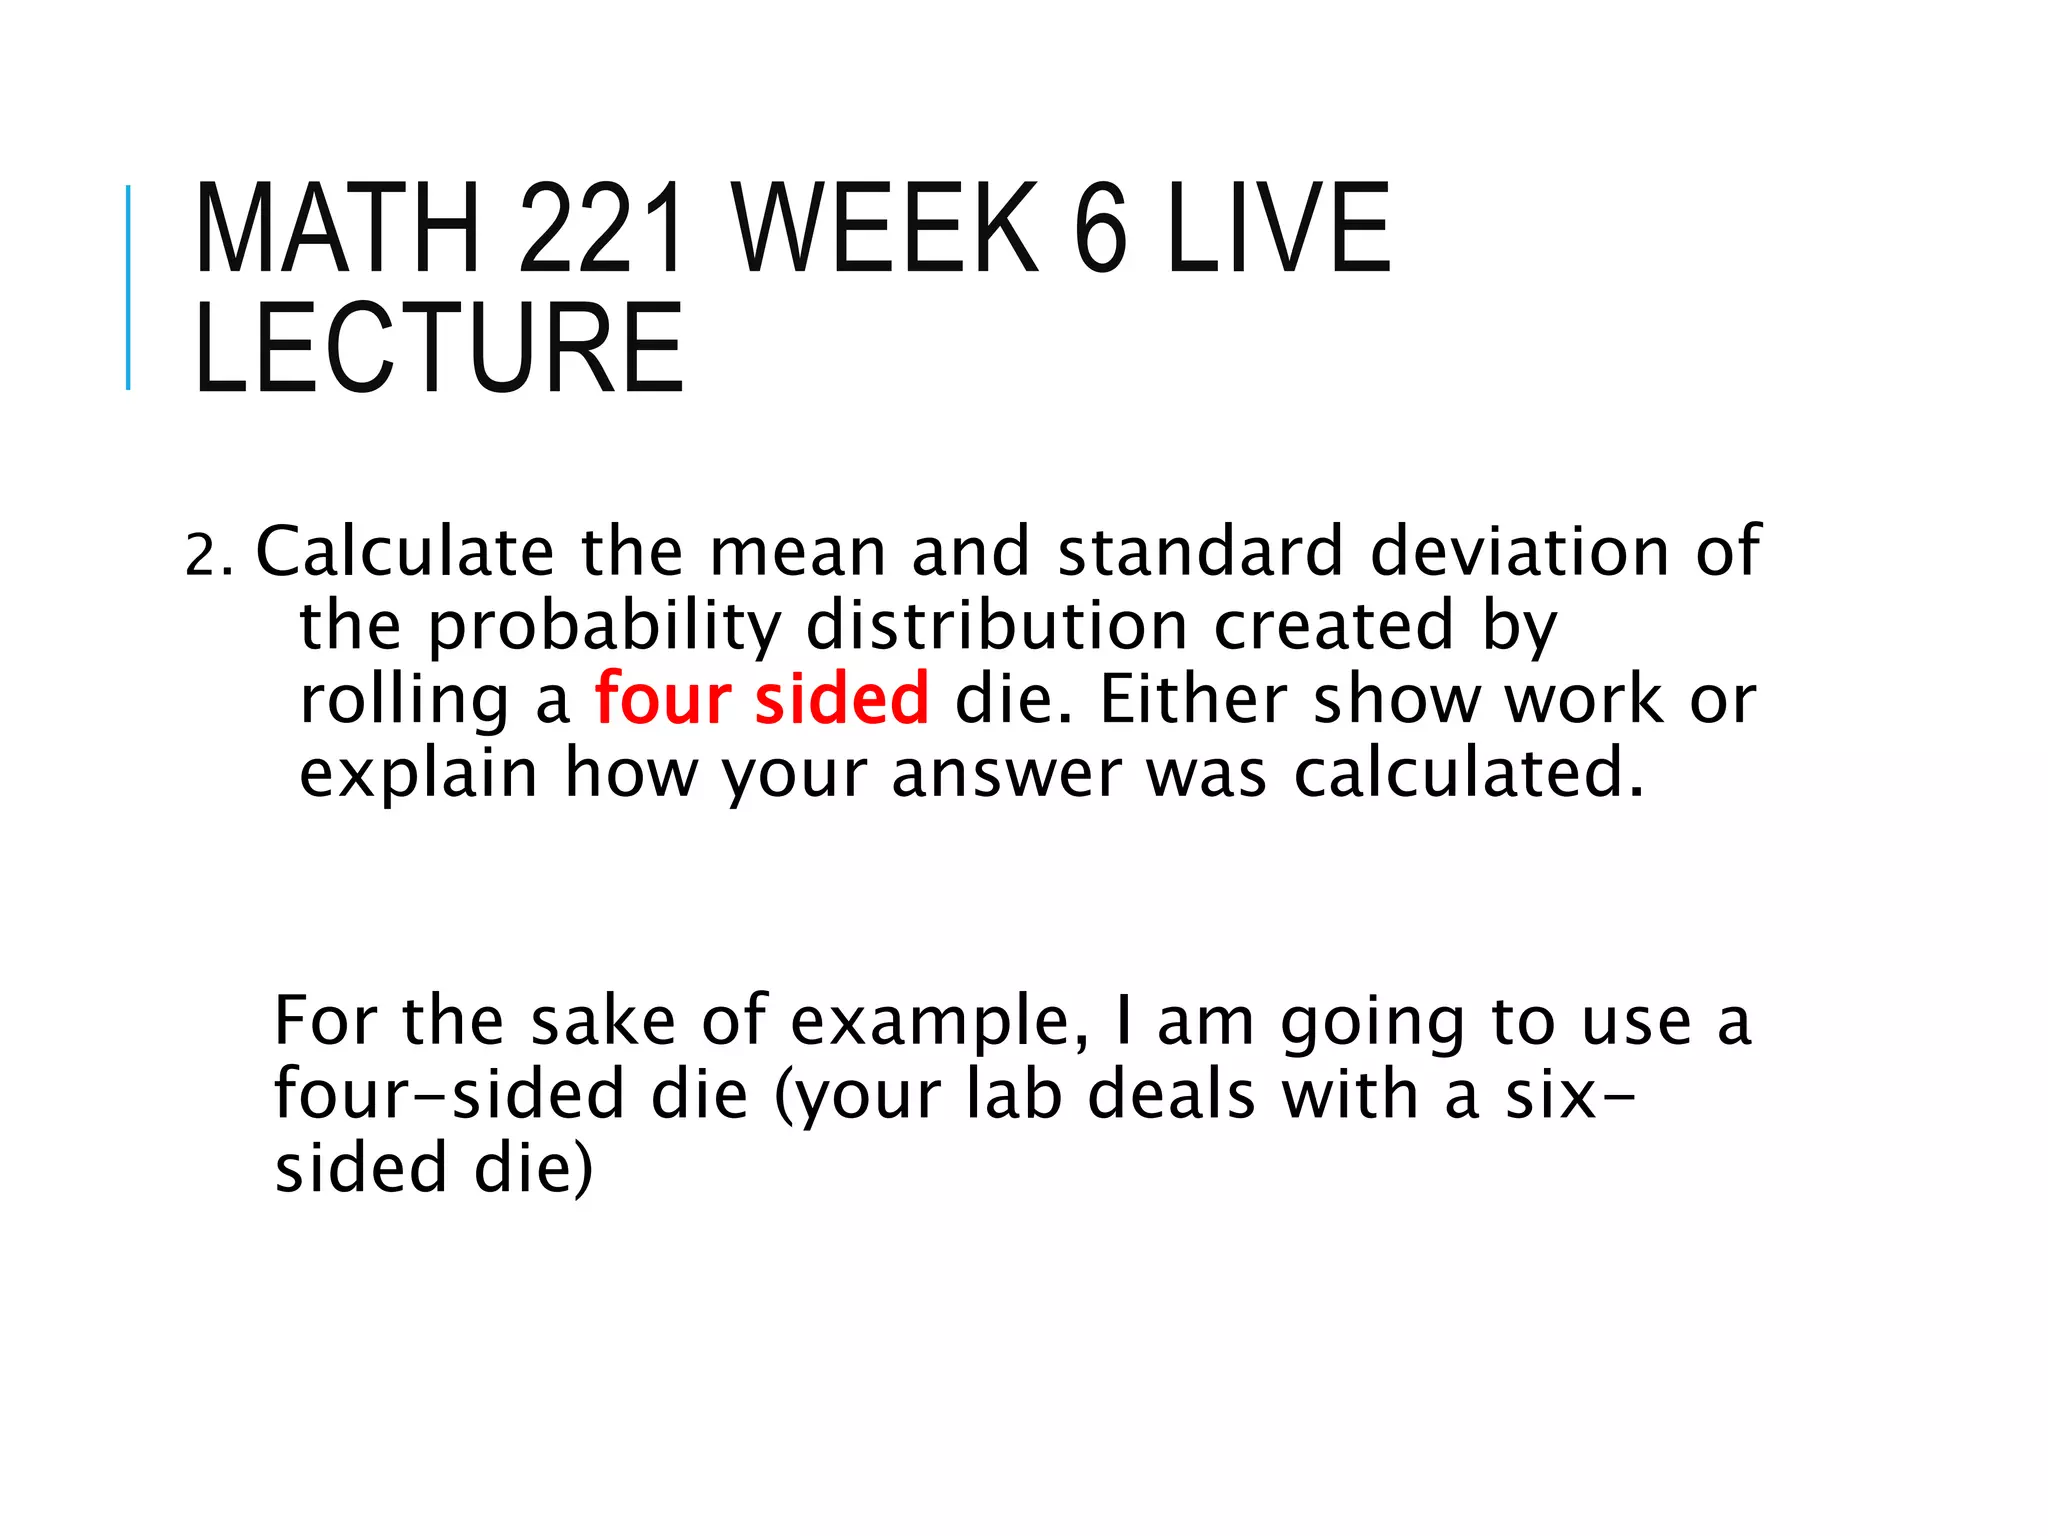
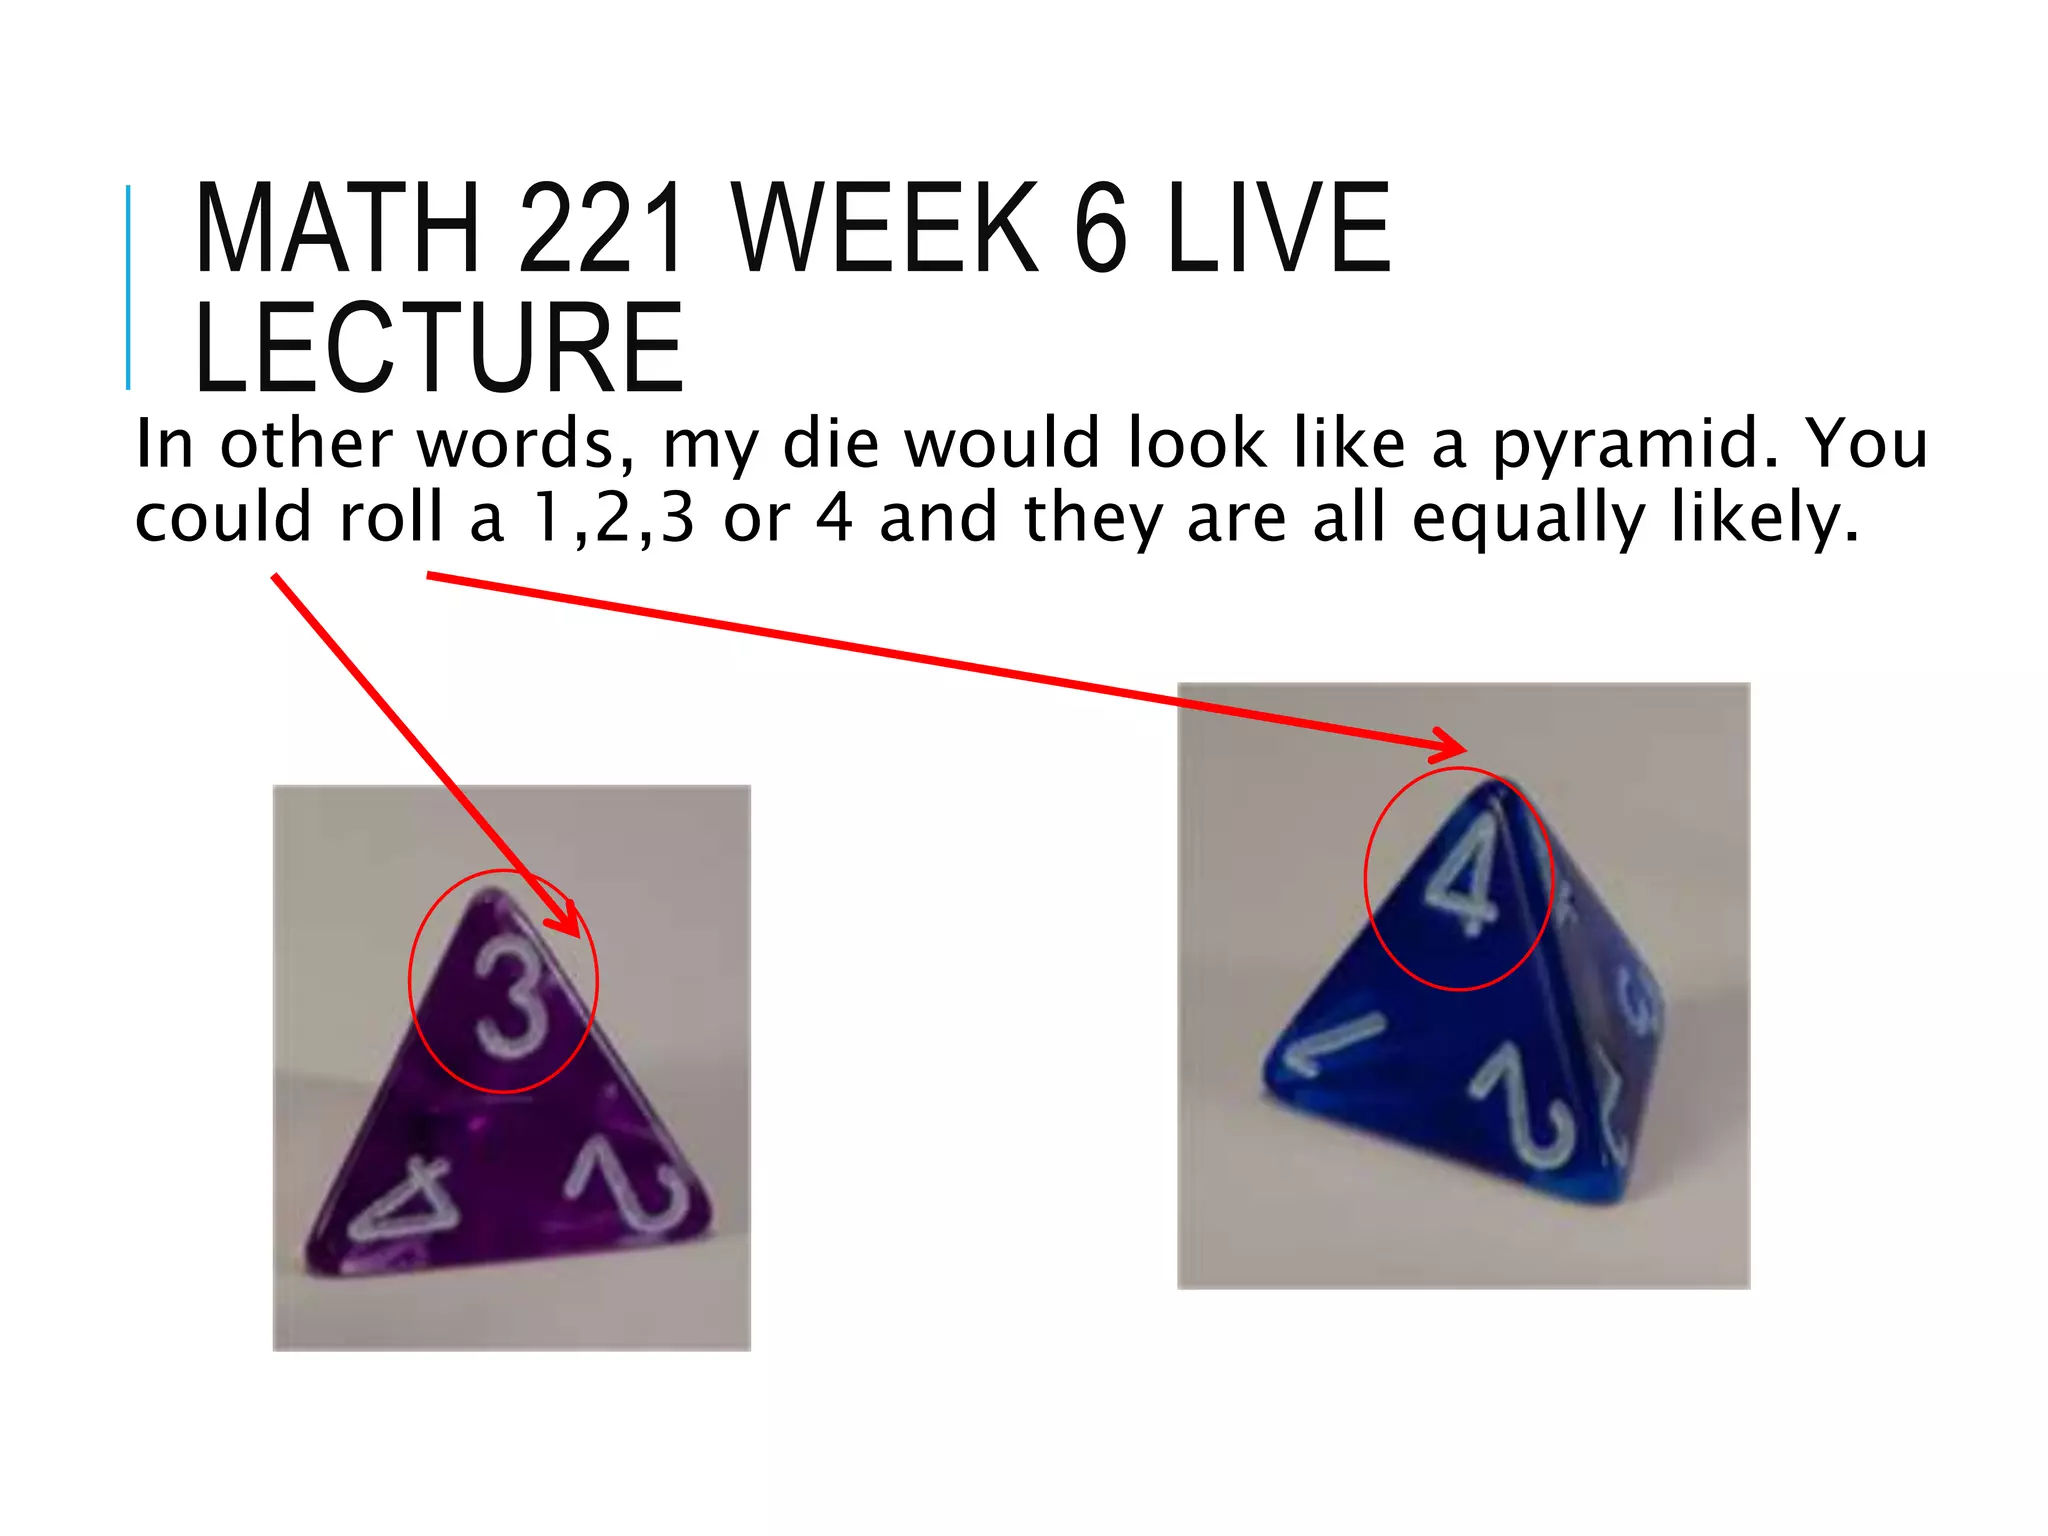
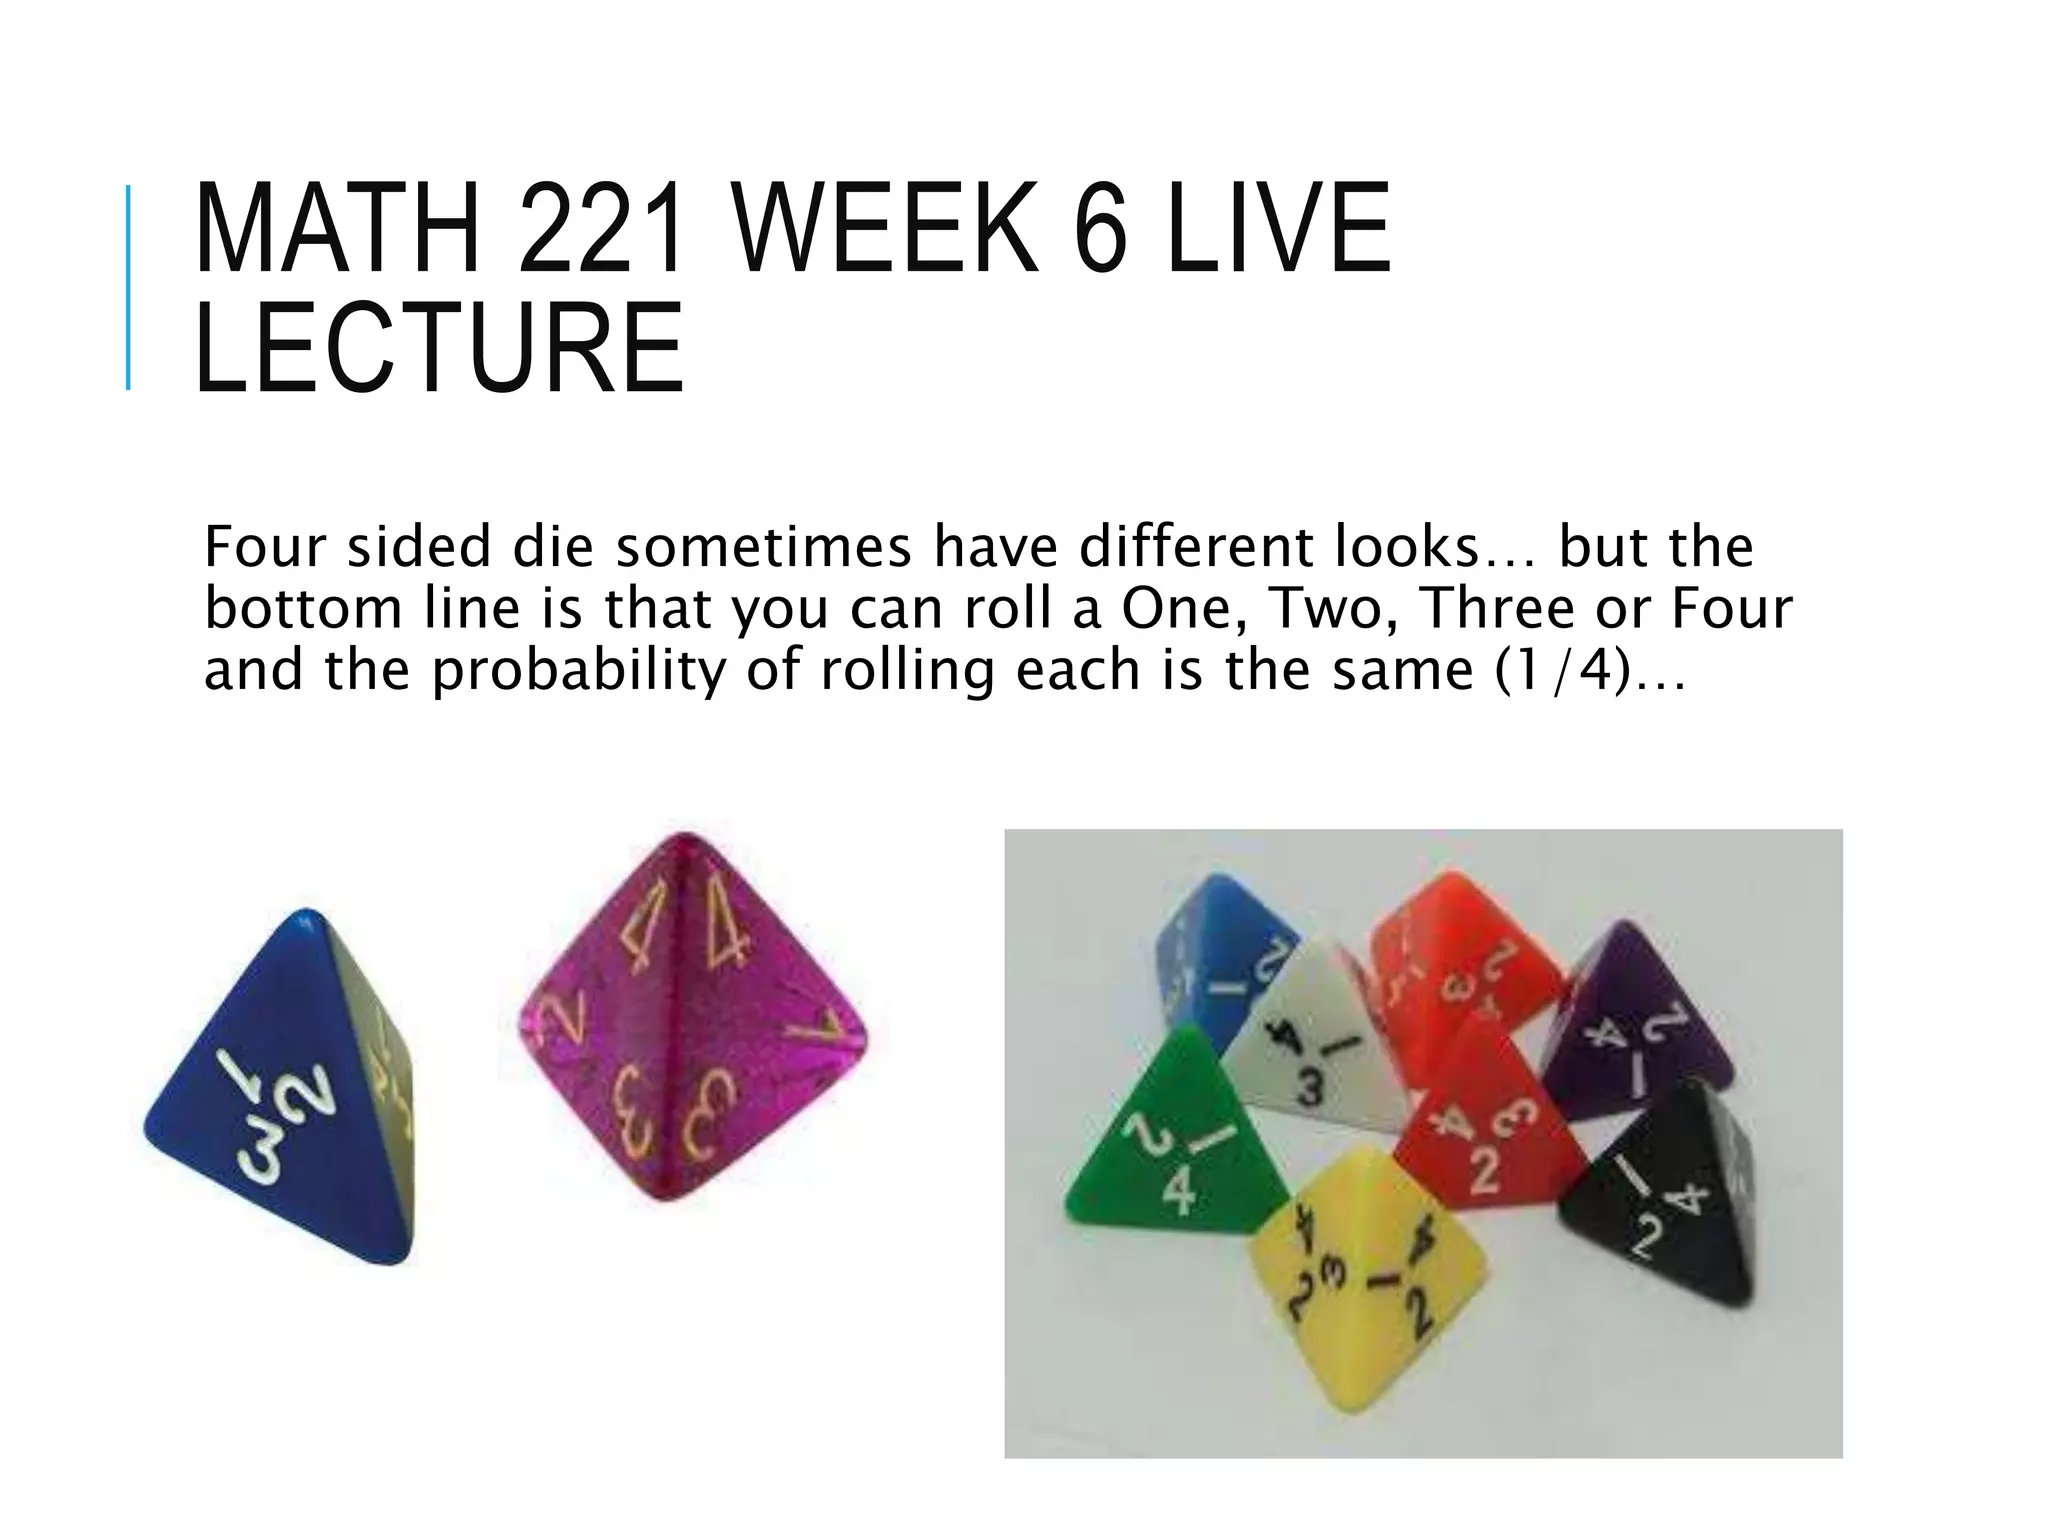
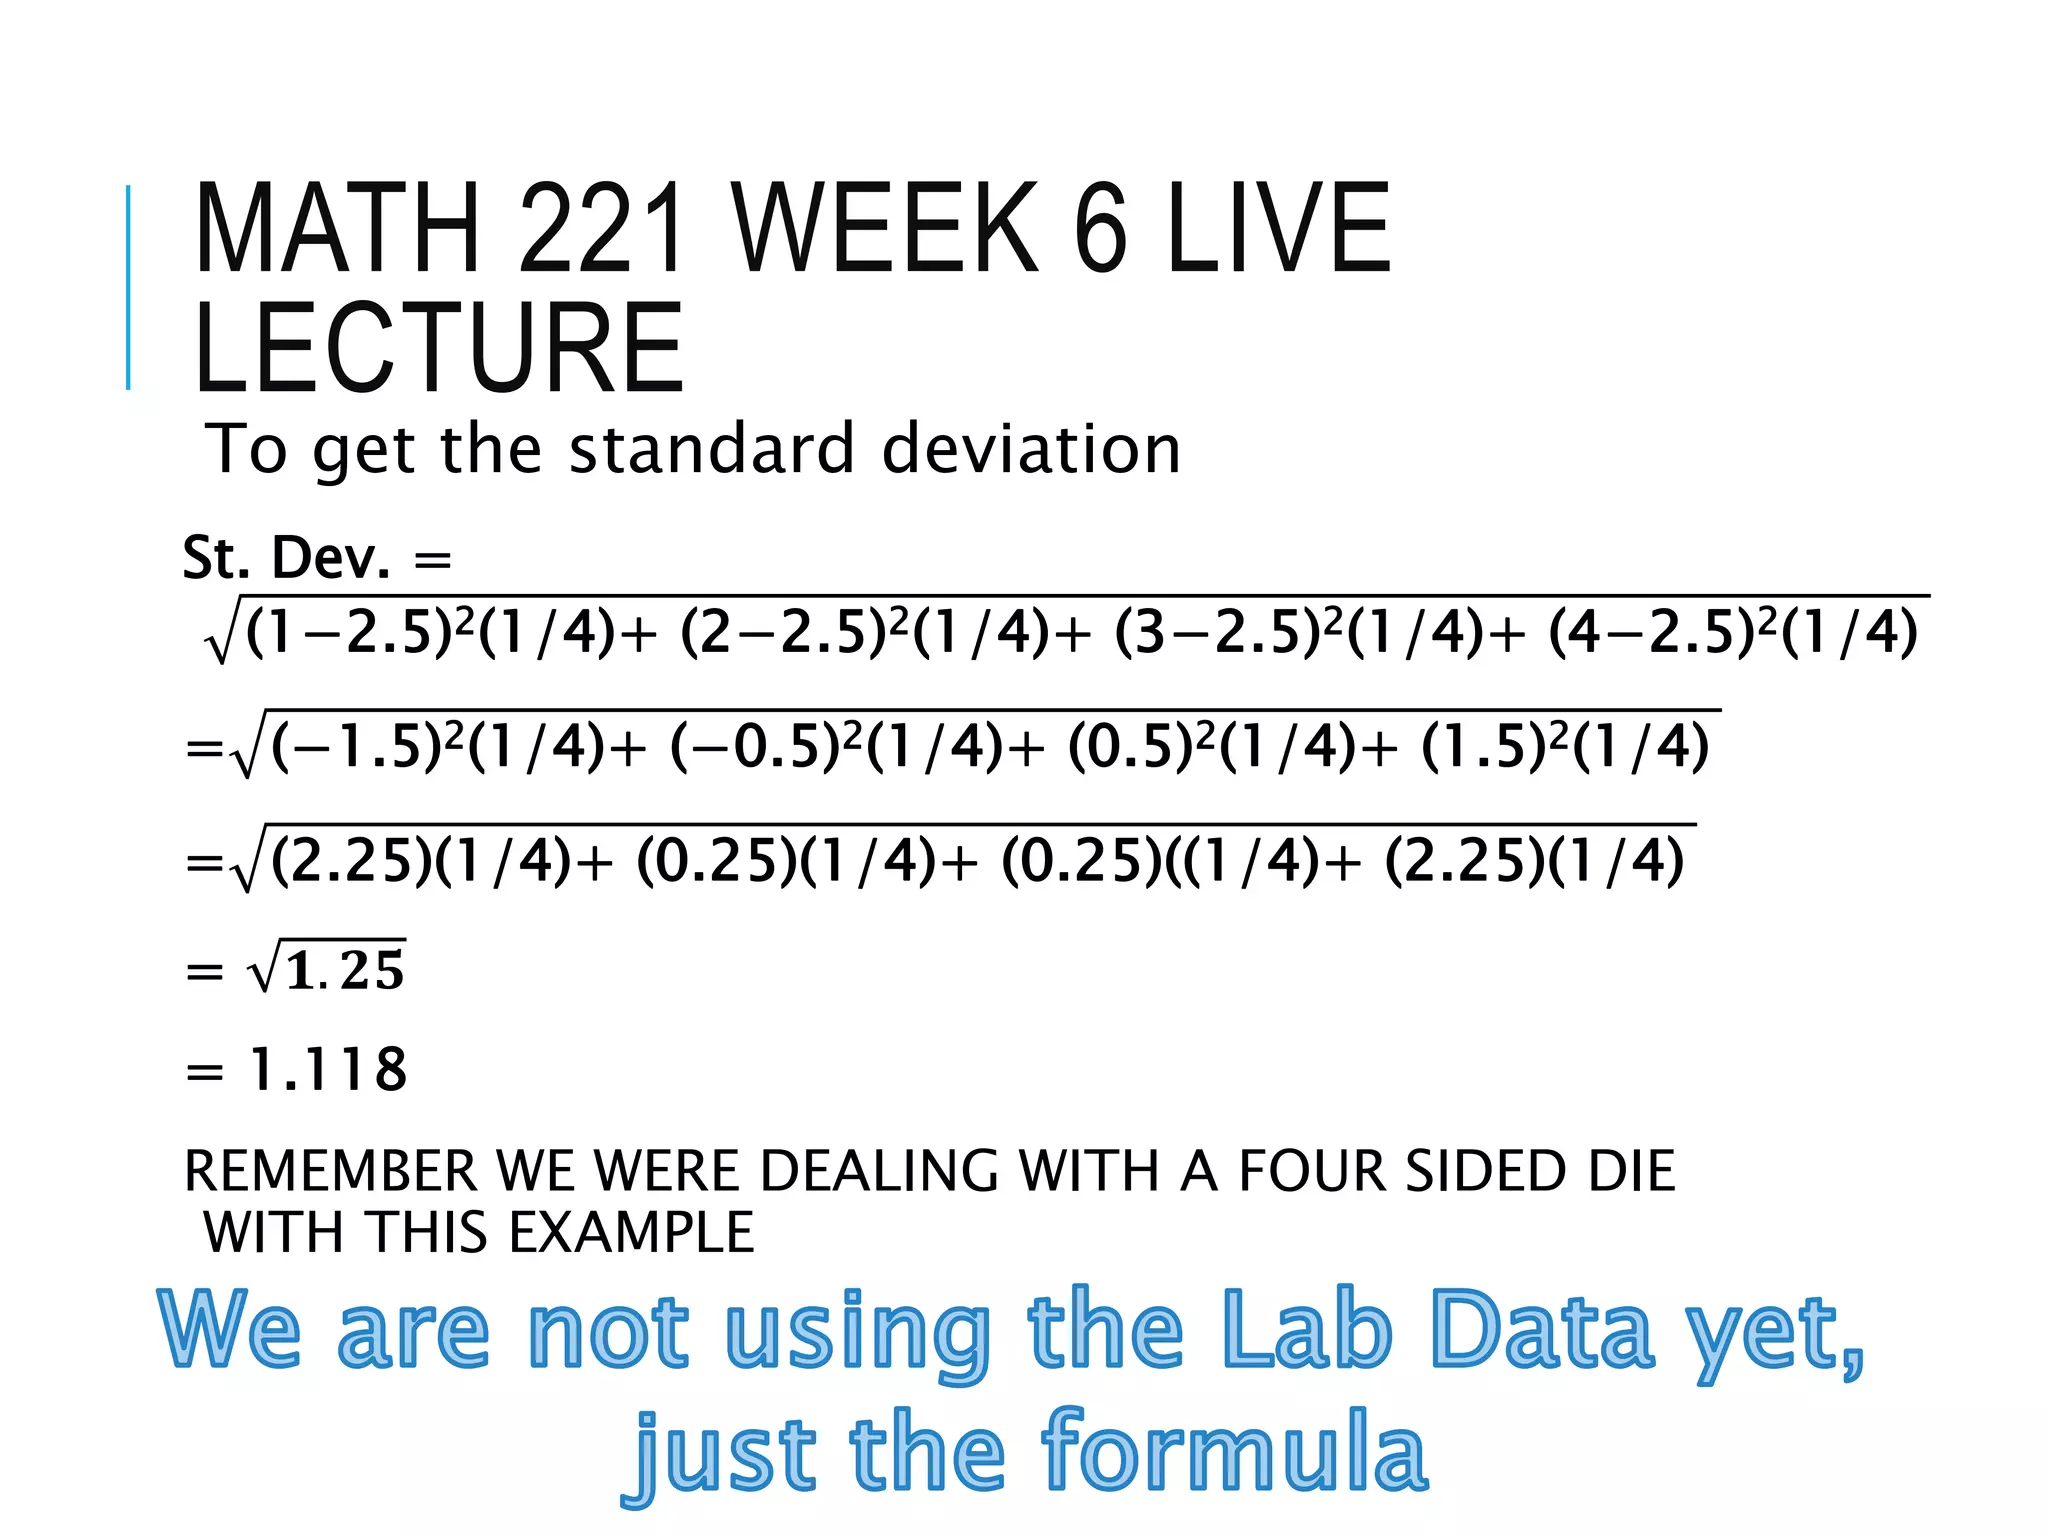
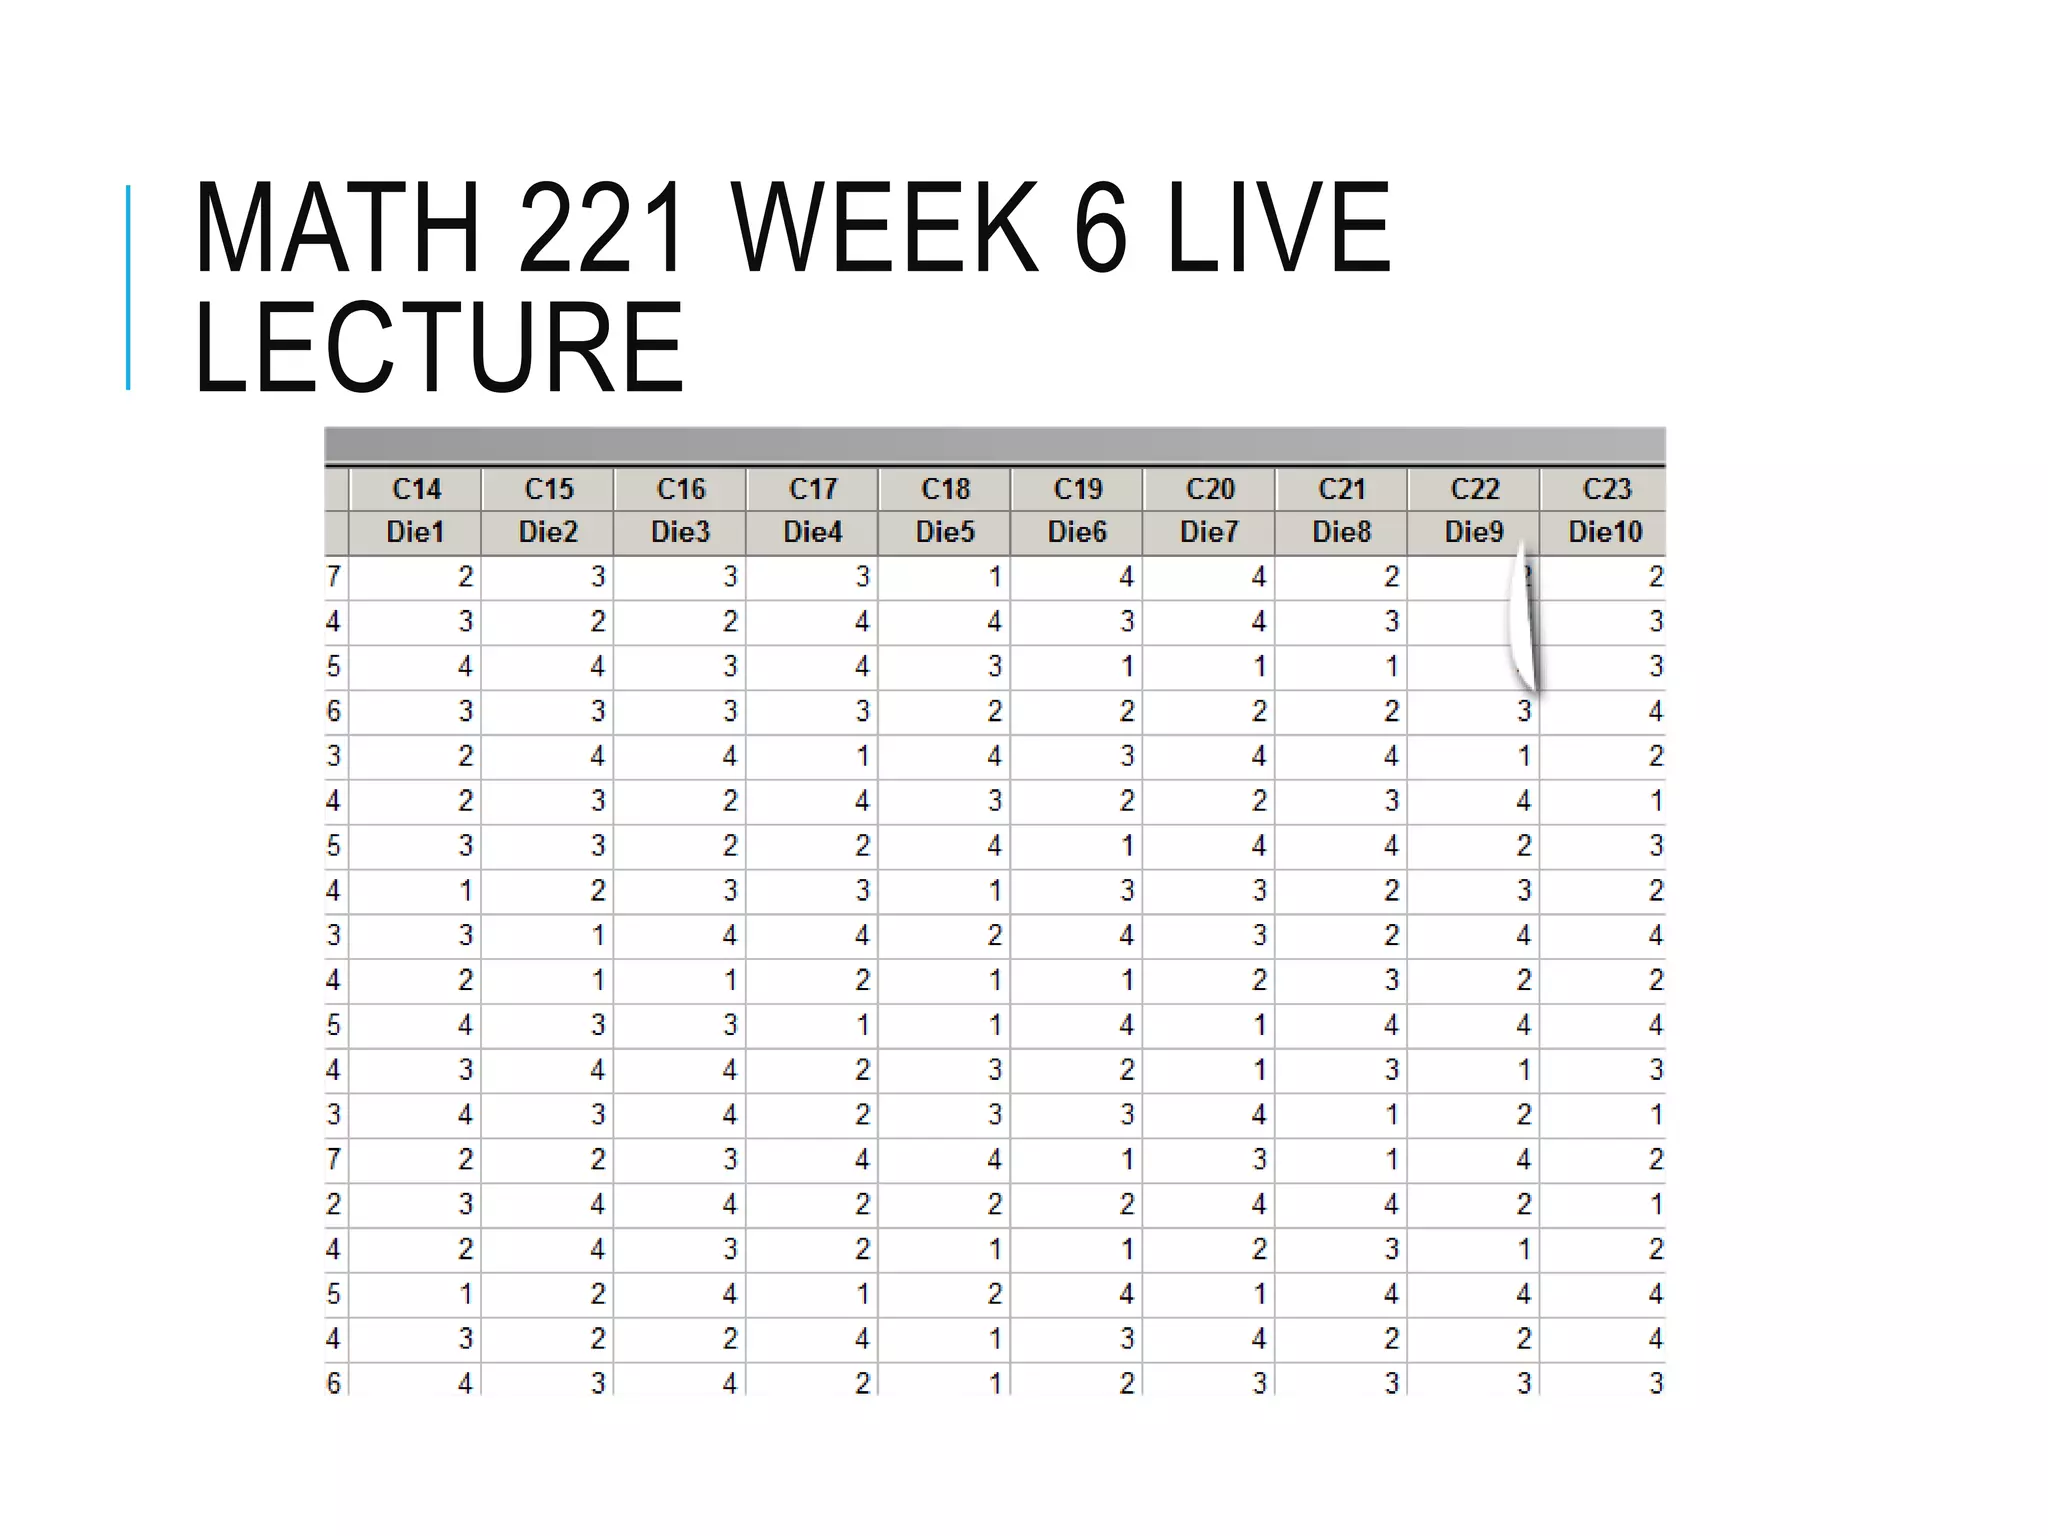
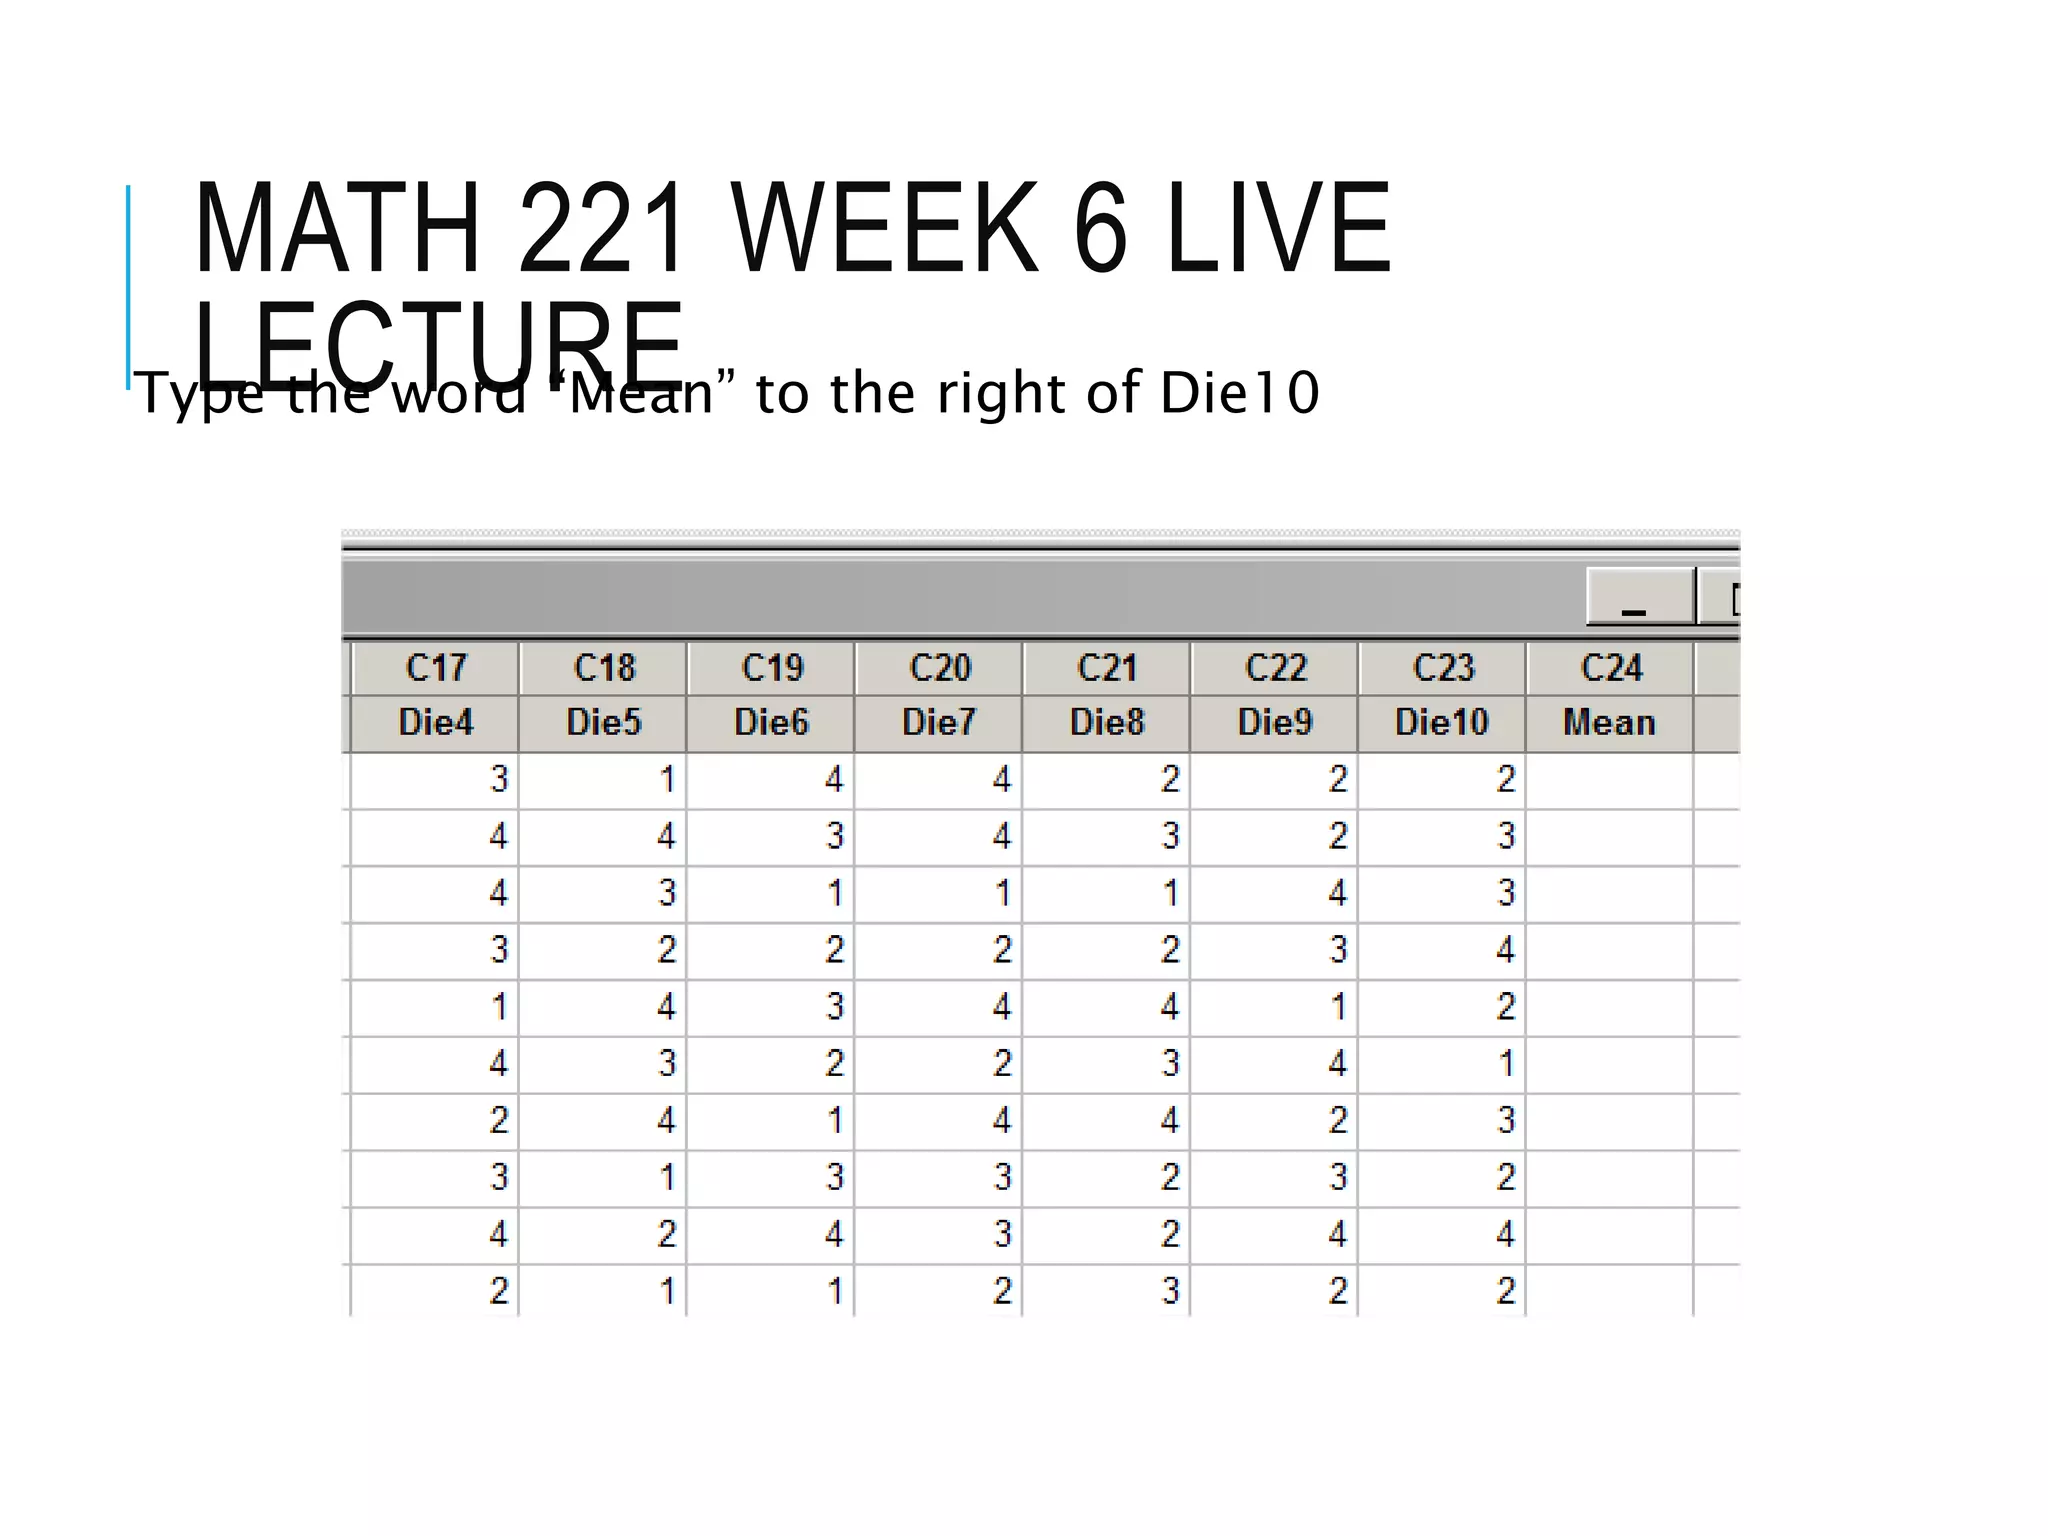
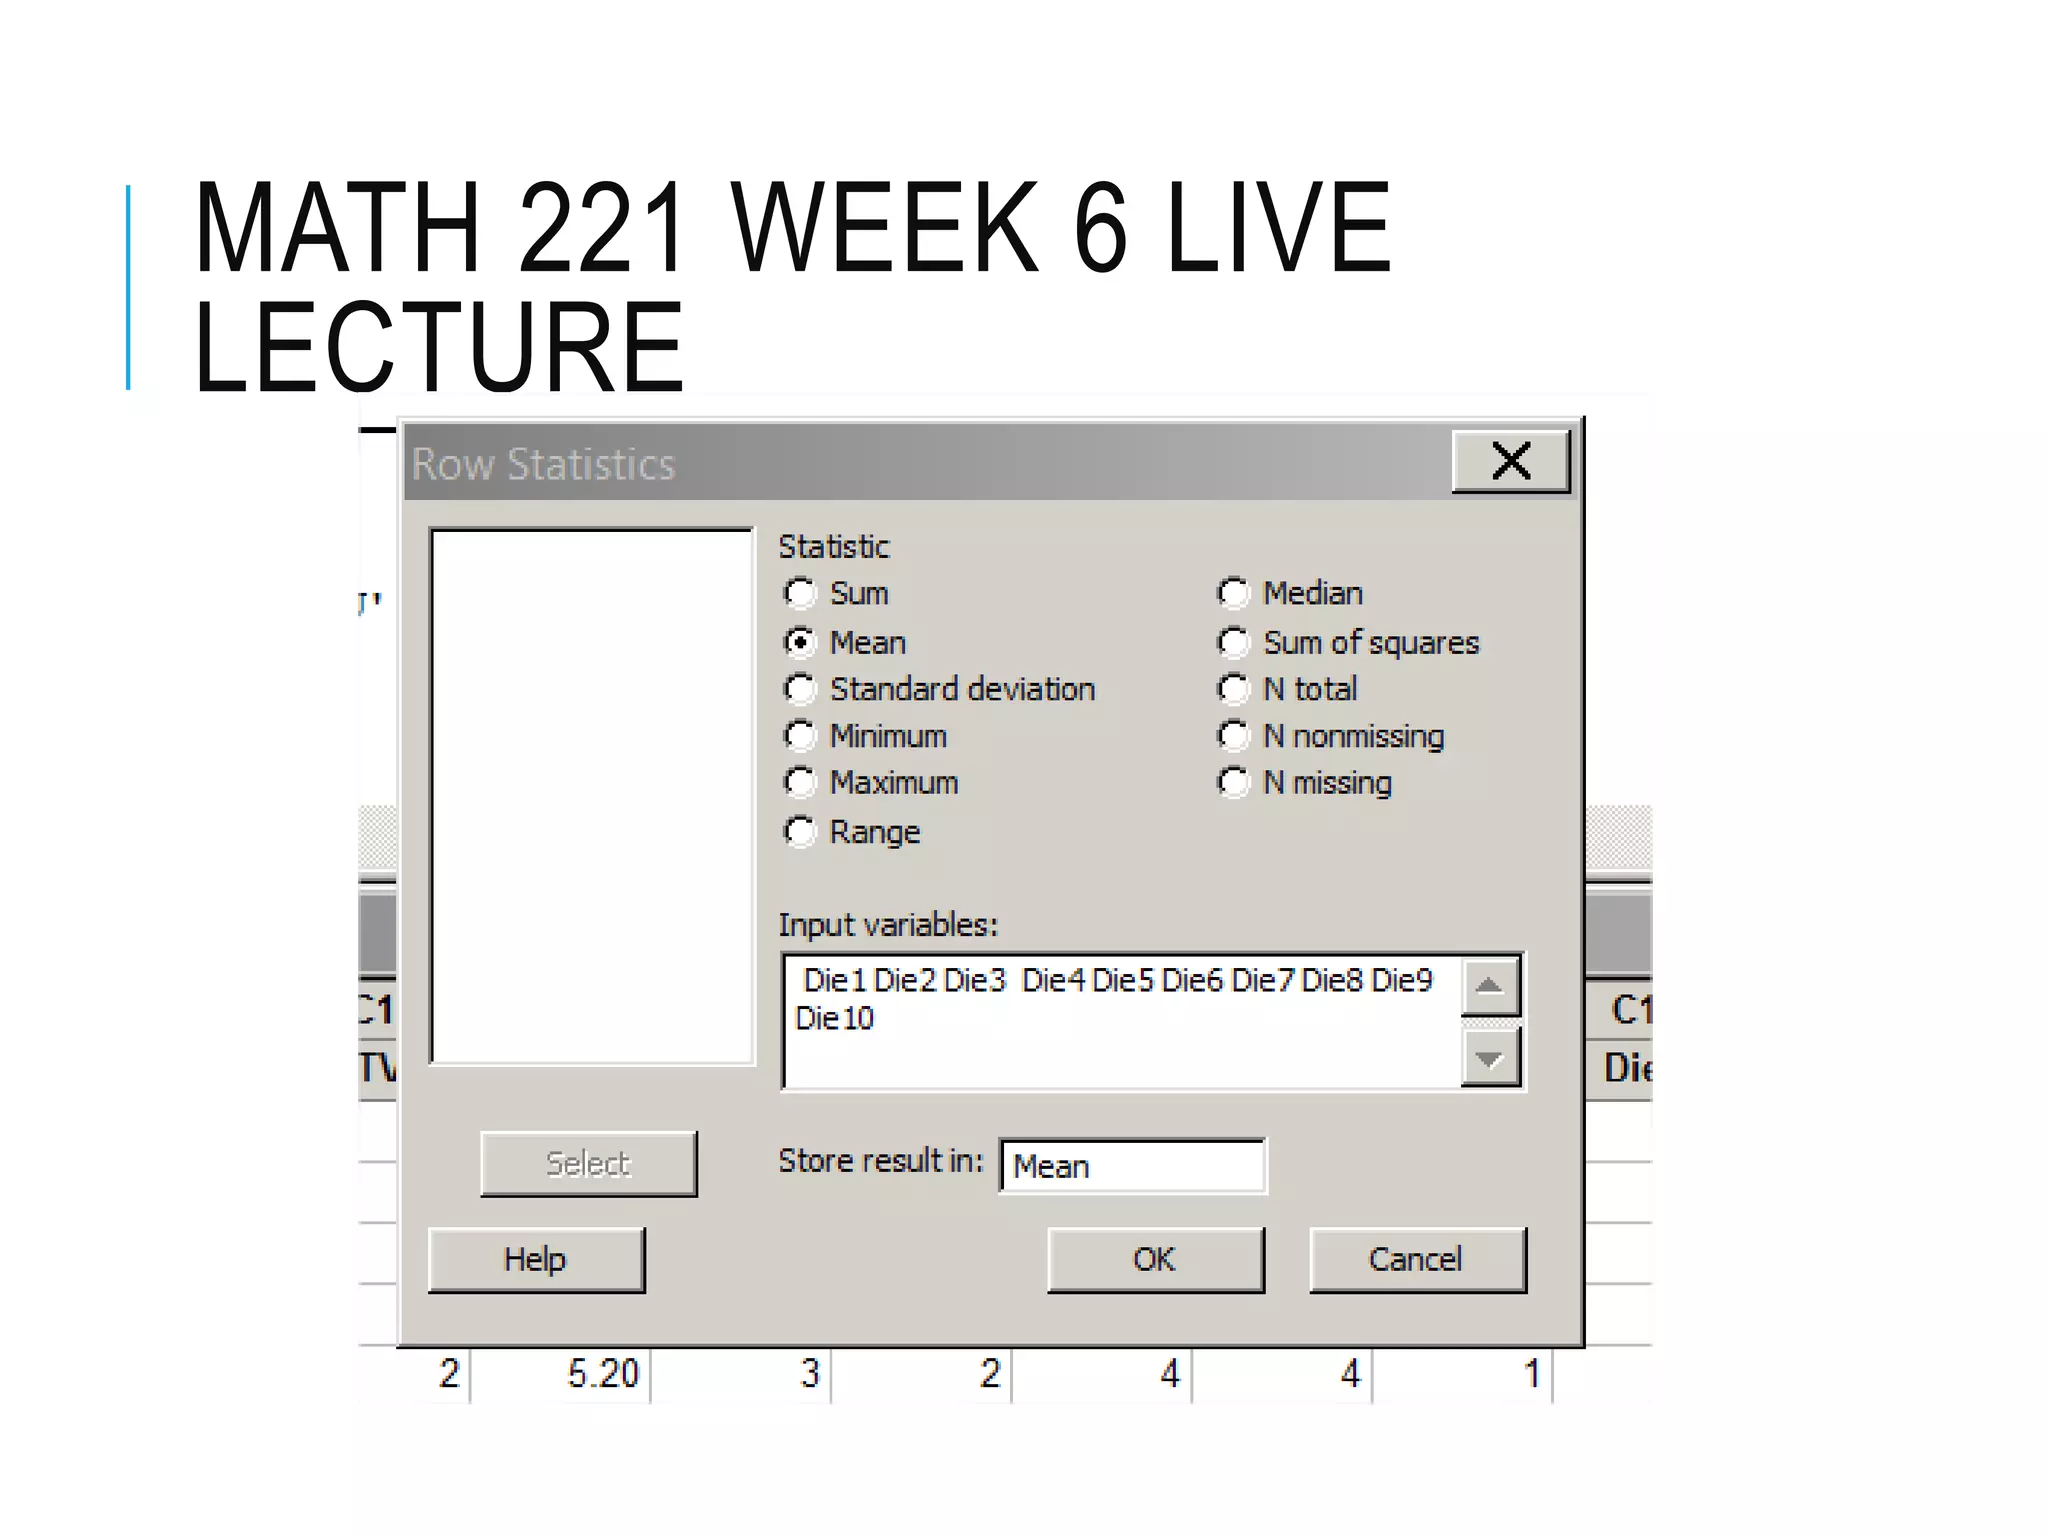
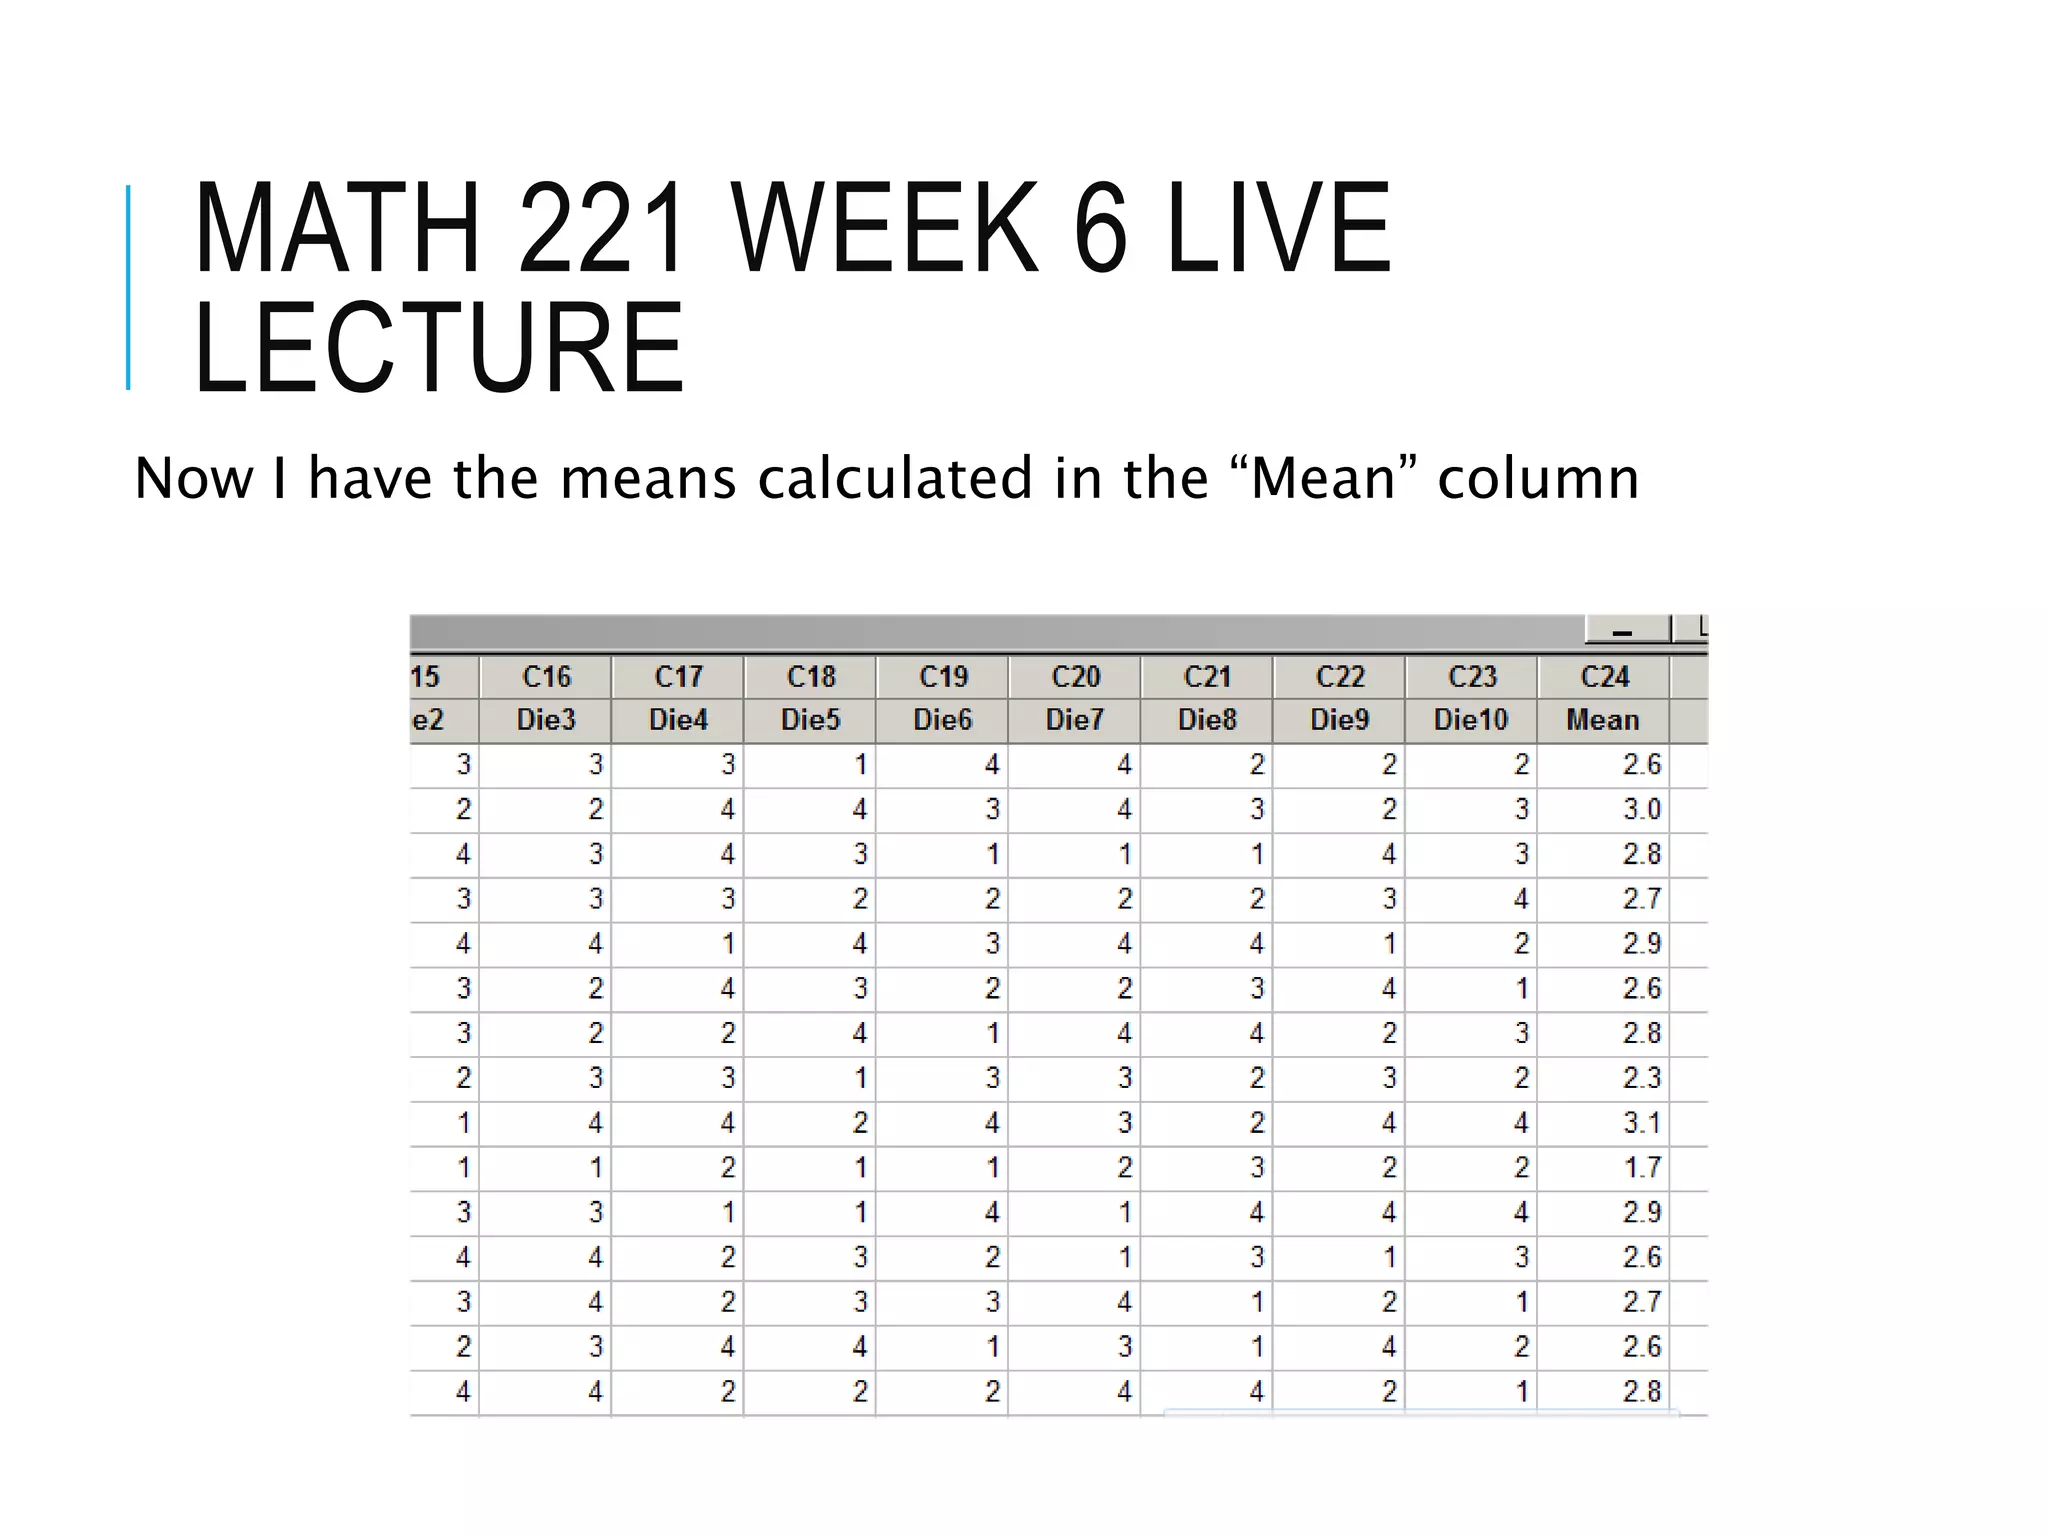
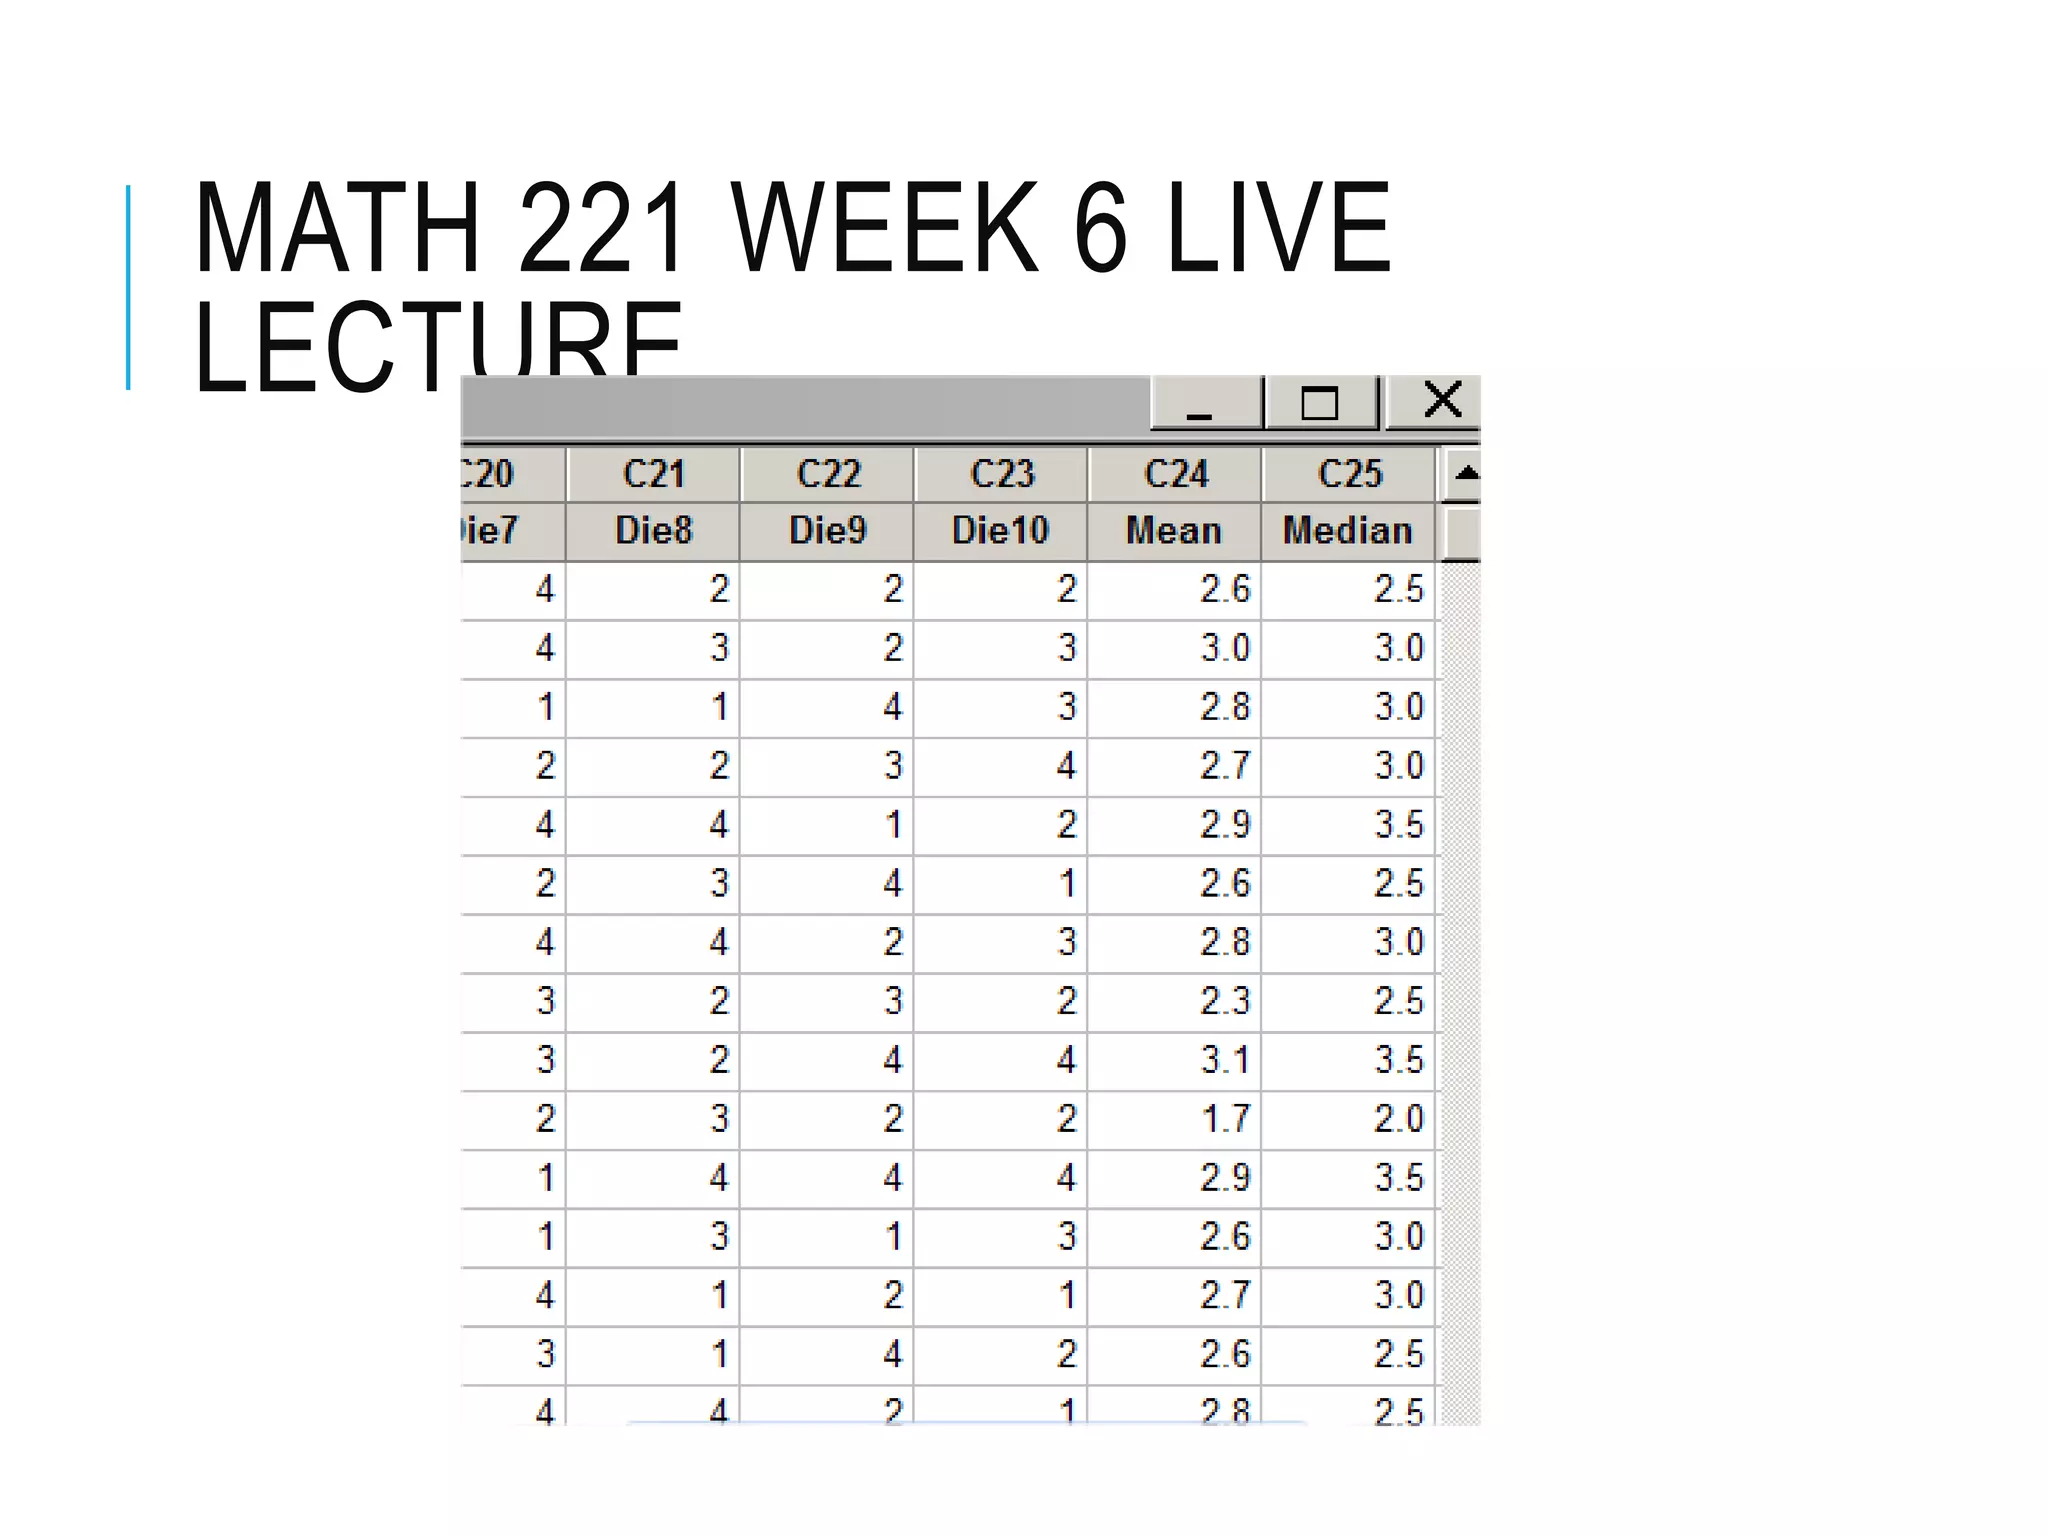
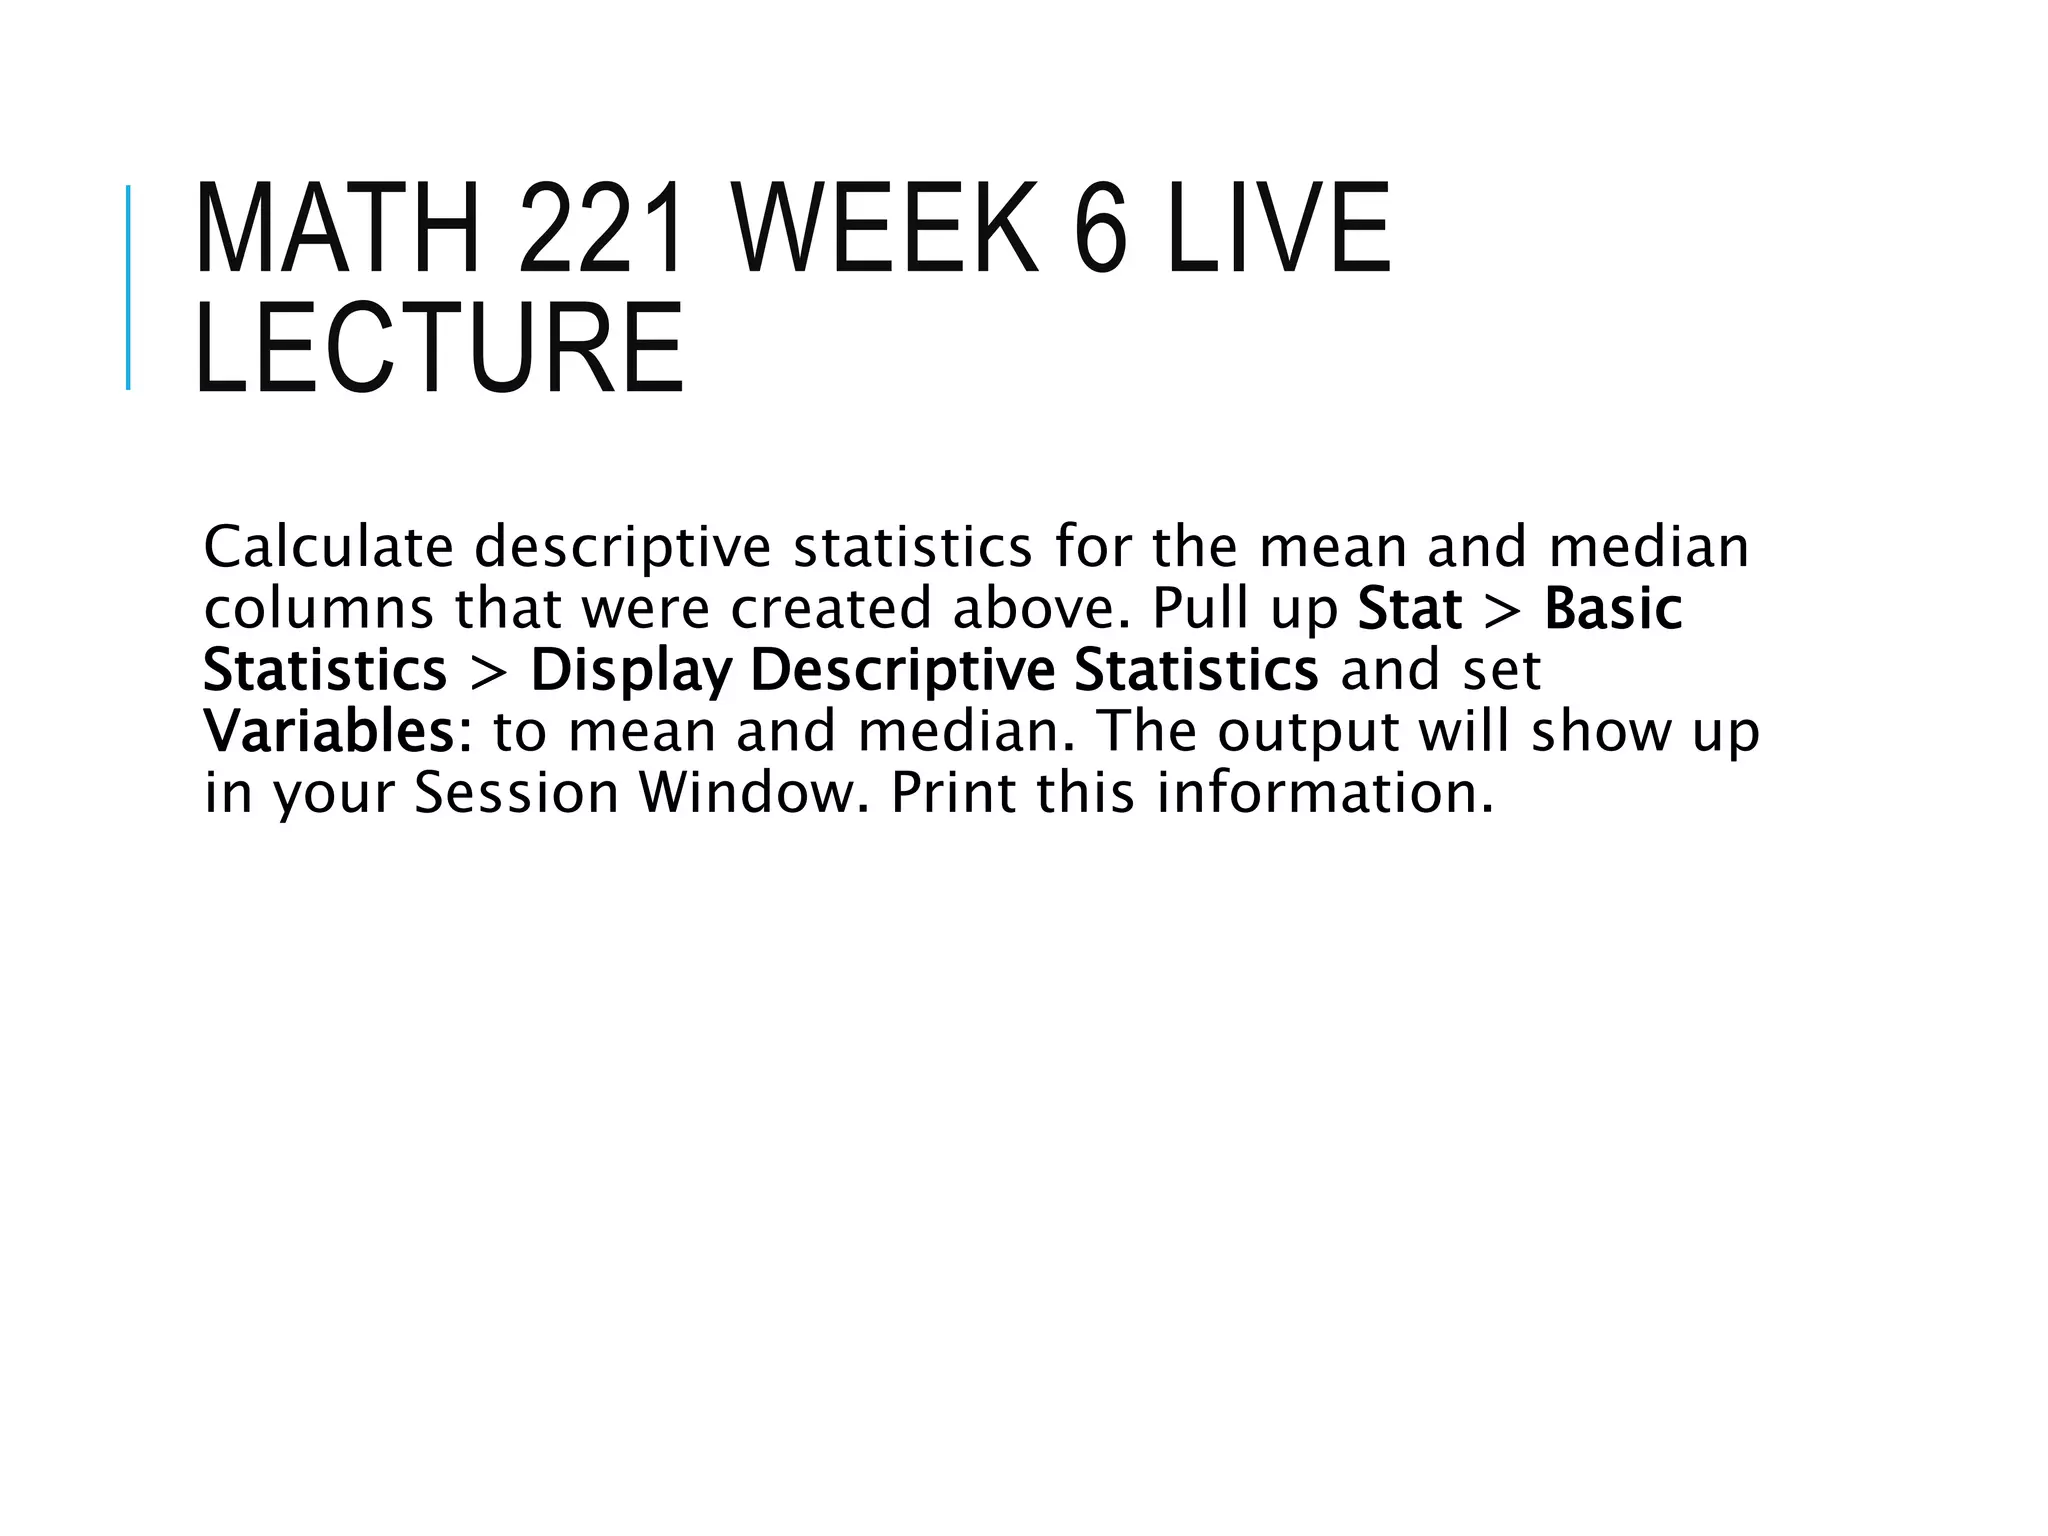
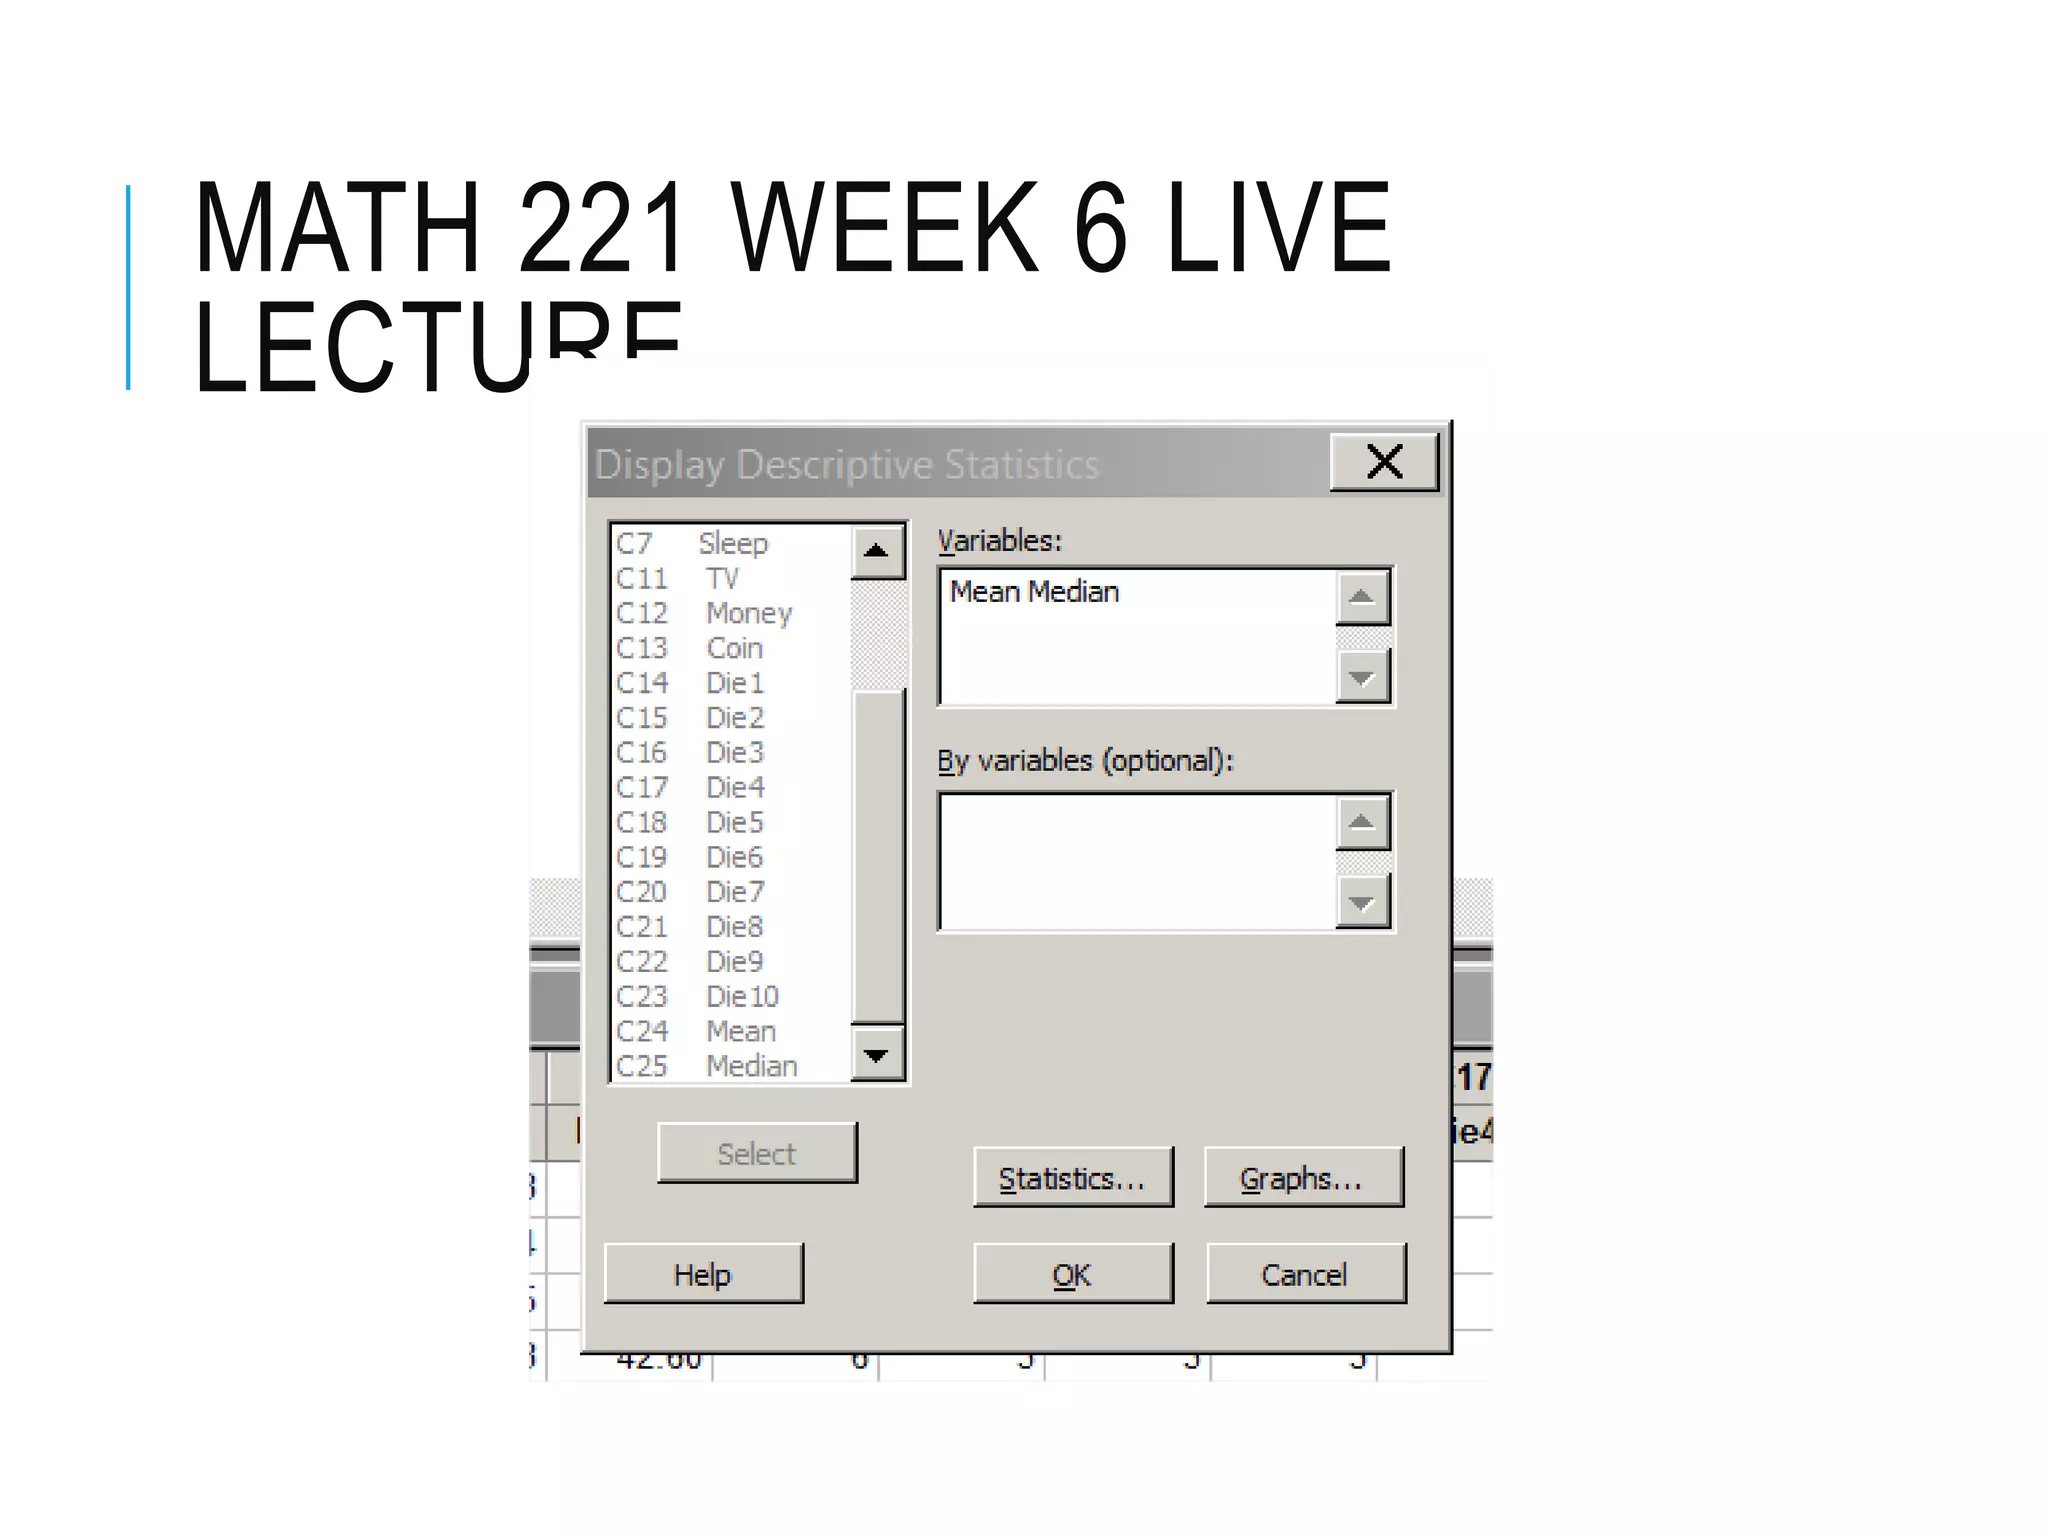
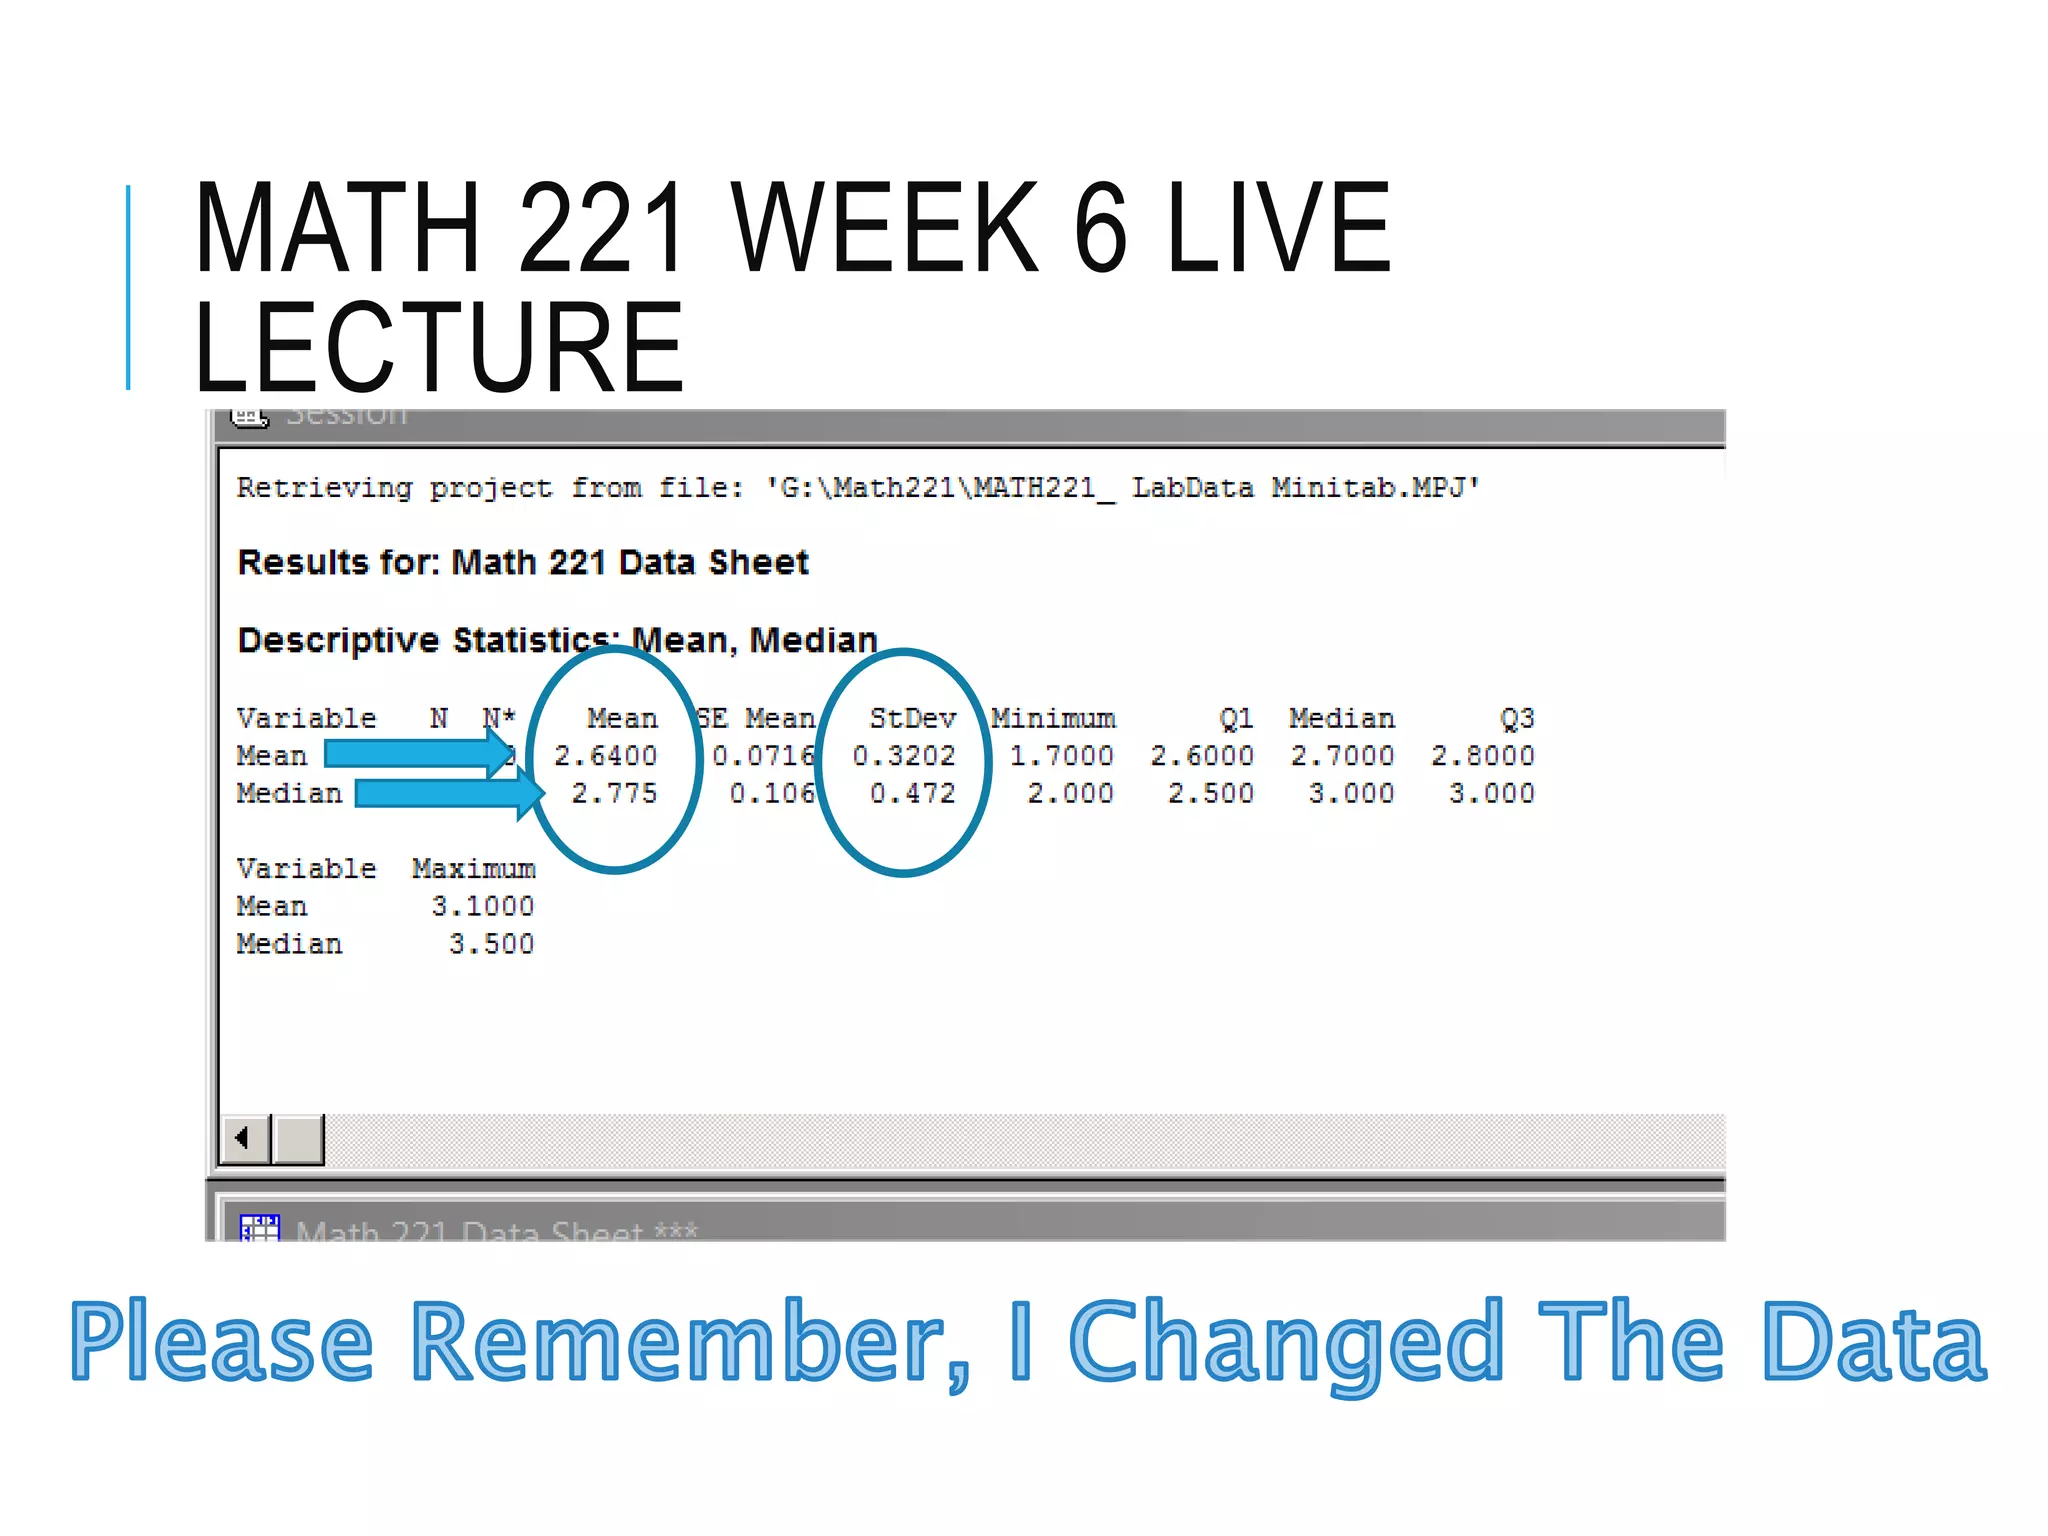
WEEK 6 LECTURE
STATISTICS FOR DECISION
MAKING
B. Heard
These charts are not
to be posted or used
without my written
permission. Students
can download a copy
for their personal use.
B. H
The
to b
with
per
can
for
MATH 221 WEEK 6 LIVE
LECTURE
The following are examples of the
Week 6 Lab
Please note that I CHANGED
the data!
MATH 221 WEEK 6 LIVE
LECTURE
1. When rolling a die, is this an example of a
discrete or continuous random variable?
Explain your reasoning.
You should be able to answer this
Read about discrete and continuous variables
MATH 221 WEEK 6 LIVE
LECTURE
2. Calculate the mean and standard deviation of
the probability distribution created by
rolling a four sided die. Either show work or
explain how your answer was calculated.
For the sake of example, I am going to use a
four-sided die (your lab deals with a six-
sided die)
MATH 221 WEEK 6 LIVE
LECTURE
In other words, my die would look like a pyramid. You
could roll a 1,2,3 or 4 and they are all equally likely.
MATH 221 WEEK 6 LIVE
LECTURE
Four sided die sometimes have different looks… but the
bottom line is that you can roll a One, Two, Three or Four
and the probability of rolling each is the same (1/4)…
MATH 221 WEEK 6 LIVE
LECTURE
2. Calculate the mean and standard deviation of the
probability distribution created by rolling a four sided
die. Either show work or explain how your answer was
calculated.
To get the mean
Mean = ƩxP(x) = 1(1/4)+2(1/4)+3(1/4)+4(1/4) = 10/4 or
2.5
Die Value times the probability
There are four equally likely sides,
so the probability for each would
be ¼.
MATH 221 WEEK 6 LIVE
LECTURE
To get the standard deviation
St. Dev. =
(1−2.5)2(1/4)+ (2−2.5)2(1/4)+ (3−2.5)2(1/4)+ (4−2.5)2(1/4)
= (−1.5)2(1/4)+ (−0.5)2(1/4)+ (0.5)2(1/4)+ (1.5)2(1/4)
= (2.25)(1/4)+ (0.25)(1/4)+ (0.25)((1/4)+ (2.25)(1/4)
= 𝟏. 𝟐𝟓
= 1.118
REMEMBER WE WERE DEALING WITH A FOUR SIDED DIE
WITH THIS EXAMPLE
MATH 221 WEEK 6 LIVE
LECTURE
3. Give the mean for the mean column of the Worksheet.
Is this estimate centered about the parameter of interest
(the parameter of interest is the answer for the mean in
question 2)?
I CHANGED THE DATA
MATH 221 WEEK 6 LIVE
LECTURE
MATH 221 WEEK 6 LIVE
LECTUREType the word “Mean” to the right of Die10
MATH 221 WEEK 6 LIVE
LECTURE
Pull up Calc > Row Statistics and select the radio-button
corresponding to Mean. For Input variables: enter all 10
rows of the die data. Go to the Store result in: and select the
Mean column. Click OK and the mean for each observation
will show up in the Worksheet.
MATH 221 WEEK 6 LIVE
LECTURE
MATH 221 WEEK 6 LIVE
LECTURE
Now I have the means calculated in the “Mean” column
MATH 221 WEEK 6 LIVE
LECTURE
We also want to calculate the median for the 10 rolls of
the die. Label the next column in the Worksheet with the
word Median. Repeat the above steps but select the
radio-button that corresponds to Median and in the
Store results in: text area, place the median column.
MATH 221 WEEK 6 LIVE
LECTURE
MATH 221 WEEK 6 LIVE
LECTURE
Same process as Mean, except choose Median radial
button and change Store result to Median by double
clicking on Median in your list on the left.
MATH 221 WEEK 6 LIVE
LECTURE
MATH 221 WEEK 6 LIVE
LECTURE
MATH 221 WEEK 6 LIVE
LECTURE
Calculate descriptive statistics for the mean and median
columns that were created above. Pull up Stat > Basic
Statistics > Display Descriptive Statistics and set
Variables: to mean and median. The output will show up
in your Session Window. Print this information.
MATH 221 WEEK 6 LIVE
LECTURE
MATH 221 WEEK 6 LIVE
LECTURE
MATH 221 WEEK 6 LIVE
LECTURE
So number 3 wants the “Mean of Means”
(From previous chart)
Mean of means = 2.64 yes, this is generally centered
around the parameter of interest (the 2.5 I calculated in
number 2)
Honestly I would have liked for it to be a tad closer (but
remember I changed data at a whim and probably put
too many 3’s and 4’s in rather than actually rolling a 4-
sided die)
MATH 221 WEEK 6 LIVE
LECTURE
4. Give the mean for the median column of the
Worksheet. Is this estimate centered about the parameter
of interest (the parameter of interest is the answer for
the mean in question 2)?
Mean of medians = 2.775, this is definitely farther away
from the parameter of interest (the 2.5 I calculated
mathematically in number 2)
MATH 221 WEEK 6 LIVE
LECTURE
5. Give the standard deviation for the mean and median
column. Compare these and be sure to identify which has
the least variability?
StDev of means = 0.3202
StDev of medians = 0.472
The standard deviation of the means is smaller, thus it
has less variability than the medians. This would mean
the data for the means is grouped closer together.
MATH 221 WEEK 6 LIVE
LECTURE
6. Based on questions 3, 4, and 5 is the mean or median
a better estimate for the parameter of interest? Explain
your reasoning.
In my case, the mean seems to be a better estimate
because it is closer to the mathematically calculated
mean and the standard deviation is less than that of the
medians meaning the means are grouped closer
together.
MATH 221 WEEK 6 LIVE
LECTURE
7. Give and interpret the 95% confidence interval for the
hours of sleep a student gets.
I changed the data! So these are not the answers to your
lab!
MATH 221 WEEK 6 LIVE
LECTURE
We are interested in calculating a 95% confidence interval
for the hours of sleep a student gets. Pull up Stat > Basic
Statistics > 1-Sample t and set Samples in columns: to
Sleep. Click the OK button and the results will appear in
your Session Window.
MATH 221 WEEK 6 LIVE
LECTUREClick the Options button and make sure the confidence
is set to 95 (95%)
MATH 221 WEEK 6 LIVE
LECTURE
Therefore, the 95% confidence interval would be (6.232, 8.168). I
would be 95% confident that the true mean number of hours a
student sleeps would be between those two values.
I changed the data! So these are not the answers to your lab!
MATH 221 WEEK 6 LIVE
LECTURE
8. Give and interpret the 99% confidence interval for the
hours of sleep a student gets.
(Same approach as number 7, but MAKE SURE you click
options and change confidence to 99%)
MATH 221 WEEK 6 LIVE
LECTURE
9. Compare the 95% and 99% confidence intervals for the
hours of sleep a student gets. Explain the difference
between these intervals and why this difference occurs.
The 99% confidence interval is wider than the 95%, which
is always the case. To get more confidence, the bounds
widened (i.e. it’s the only way you can get more
certainty).
MATH 221 WEEK 6 LIVE
LECTURE
I will see you next week!
Remember Week 7 is the Final Live Lecture of
the term, but in addition to getting you ready
for the Week 7 Quiz, I will also have a
presentation to help you prepare for the Final
Exam that I will upload after next week’s
lecture.

Math 221 week 6 lecture april 2015

  • 1.
    WEEK 6 LECTURE STATISTICSFOR DECISION MAKING B. Heard These charts are not to be posted or used without my written permission. Students can download a copy for their personal use. B. H The to b with per can for
  • 2.
    MATH 221 WEEK6 LIVE LECTURE The following are examples of the Week 6 Lab Please note that I CHANGED the data!
  • 3.
    MATH 221 WEEK6 LIVE LECTURE 1. When rolling a die, is this an example of a discrete or continuous random variable? Explain your reasoning. You should be able to answer this Read about discrete and continuous variables
  • 4.
    MATH 221 WEEK6 LIVE LECTURE 2. Calculate the mean and standard deviation of the probability distribution created by rolling a four sided die. Either show work or explain how your answer was calculated. For the sake of example, I am going to use a four-sided die (your lab deals with a six- sided die)
  • 5.
    MATH 221 WEEK6 LIVE LECTURE In other words, my die would look like a pyramid. You could roll a 1,2,3 or 4 and they are all equally likely.
  • 6.
    MATH 221 WEEK6 LIVE LECTURE Four sided die sometimes have different looks… but the bottom line is that you can roll a One, Two, Three or Four and the probability of rolling each is the same (1/4)…
  • 7.
    MATH 221 WEEK6 LIVE LECTURE 2. Calculate the mean and standard deviation of the probability distribution created by rolling a four sided die. Either show work or explain how your answer was calculated. To get the mean Mean = ƩxP(x) = 1(1/4)+2(1/4)+3(1/4)+4(1/4) = 10/4 or 2.5 Die Value times the probability There are four equally likely sides, so the probability for each would be ¼.
  • 8.
    MATH 221 WEEK6 LIVE LECTURE To get the standard deviation St. Dev. = (1−2.5)2(1/4)+ (2−2.5)2(1/4)+ (3−2.5)2(1/4)+ (4−2.5)2(1/4) = (−1.5)2(1/4)+ (−0.5)2(1/4)+ (0.5)2(1/4)+ (1.5)2(1/4) = (2.25)(1/4)+ (0.25)(1/4)+ (0.25)((1/4)+ (2.25)(1/4) = 𝟏. 𝟐𝟓 = 1.118 REMEMBER WE WERE DEALING WITH A FOUR SIDED DIE WITH THIS EXAMPLE
  • 9.
    MATH 221 WEEK6 LIVE LECTURE 3. Give the mean for the mean column of the Worksheet. Is this estimate centered about the parameter of interest (the parameter of interest is the answer for the mean in question 2)? I CHANGED THE DATA
  • 10.
    MATH 221 WEEK6 LIVE LECTURE
  • 11.
    MATH 221 WEEK6 LIVE LECTUREType the word “Mean” to the right of Die10
  • 12.
    MATH 221 WEEK6 LIVE LECTURE Pull up Calc > Row Statistics and select the radio-button corresponding to Mean. For Input variables: enter all 10 rows of the die data. Go to the Store result in: and select the Mean column. Click OK and the mean for each observation will show up in the Worksheet.
  • 13.
    MATH 221 WEEK6 LIVE LECTURE
  • 14.
    MATH 221 WEEK6 LIVE LECTURE Now I have the means calculated in the “Mean” column
  • 15.
    MATH 221 WEEK6 LIVE LECTURE We also want to calculate the median for the 10 rolls of the die. Label the next column in the Worksheet with the word Median. Repeat the above steps but select the radio-button that corresponds to Median and in the Store results in: text area, place the median column.
  • 16.
    MATH 221 WEEK6 LIVE LECTURE
  • 17.
    MATH 221 WEEK6 LIVE LECTURE Same process as Mean, except choose Median radial button and change Store result to Median by double clicking on Median in your list on the left.
  • 18.
    MATH 221 WEEK6 LIVE LECTURE
  • 19.
    MATH 221 WEEK6 LIVE LECTURE
  • 20.
    MATH 221 WEEK6 LIVE LECTURE Calculate descriptive statistics for the mean and median columns that were created above. Pull up Stat > Basic Statistics > Display Descriptive Statistics and set Variables: to mean and median. The output will show up in your Session Window. Print this information.
  • 21.
    MATH 221 WEEK6 LIVE LECTURE
  • 22.
    MATH 221 WEEK6 LIVE LECTURE
  • 23.
    MATH 221 WEEK6 LIVE LECTURE So number 3 wants the “Mean of Means” (From previous chart) Mean of means = 2.64 yes, this is generally centered around the parameter of interest (the 2.5 I calculated in number 2) Honestly I would have liked for it to be a tad closer (but remember I changed data at a whim and probably put too many 3’s and 4’s in rather than actually rolling a 4- sided die)
  • 24.
    MATH 221 WEEK6 LIVE LECTURE 4. Give the mean for the median column of the Worksheet. Is this estimate centered about the parameter of interest (the parameter of interest is the answer for the mean in question 2)? Mean of medians = 2.775, this is definitely farther away from the parameter of interest (the 2.5 I calculated mathematically in number 2)
  • 25.
    MATH 221 WEEK6 LIVE LECTURE 5. Give the standard deviation for the mean and median column. Compare these and be sure to identify which has the least variability? StDev of means = 0.3202 StDev of medians = 0.472 The standard deviation of the means is smaller, thus it has less variability than the medians. This would mean the data for the means is grouped closer together.
  • 26.
    MATH 221 WEEK6 LIVE LECTURE 6. Based on questions 3, 4, and 5 is the mean or median a better estimate for the parameter of interest? Explain your reasoning. In my case, the mean seems to be a better estimate because it is closer to the mathematically calculated mean and the standard deviation is less than that of the medians meaning the means are grouped closer together.
  • 27.
    MATH 221 WEEK6 LIVE LECTURE 7. Give and interpret the 95% confidence interval for the hours of sleep a student gets. I changed the data! So these are not the answers to your lab!
  • 28.
    MATH 221 WEEK6 LIVE LECTURE We are interested in calculating a 95% confidence interval for the hours of sleep a student gets. Pull up Stat > Basic Statistics > 1-Sample t and set Samples in columns: to Sleep. Click the OK button and the results will appear in your Session Window.
  • 29.
    MATH 221 WEEK6 LIVE LECTUREClick the Options button and make sure the confidence is set to 95 (95%)
  • 30.
    MATH 221 WEEK6 LIVE LECTURE Therefore, the 95% confidence interval would be (6.232, 8.168). I would be 95% confident that the true mean number of hours a student sleeps would be between those two values. I changed the data! So these are not the answers to your lab!
  • 31.
    MATH 221 WEEK6 LIVE LECTURE 8. Give and interpret the 99% confidence interval for the hours of sleep a student gets. (Same approach as number 7, but MAKE SURE you click options and change confidence to 99%)
  • 32.
    MATH 221 WEEK6 LIVE LECTURE 9. Compare the 95% and 99% confidence intervals for the hours of sleep a student gets. Explain the difference between these intervals and why this difference occurs. The 99% confidence interval is wider than the 95%, which is always the case. To get more confidence, the bounds widened (i.e. it’s the only way you can get more certainty).
  • 33.
    MATH 221 WEEK6 LIVE LECTURE I will see you next week! Remember Week 7 is the Final Live Lecture of the term, but in addition to getting you ready for the Week 7 Quiz, I will also have a presentation to help you prepare for the Final Exam that I will upload after next week’s lecture.