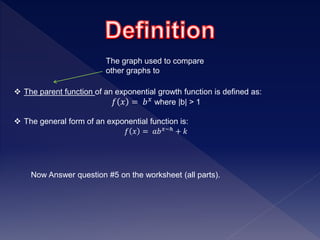
1) The document discusses exponential growth functions and how changing the parameters a, h, and k transforms the graph of the exponential function f(x) = abx-h + k.
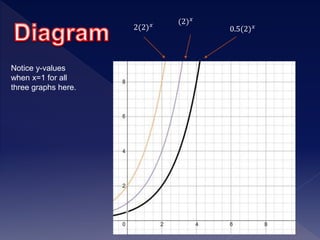
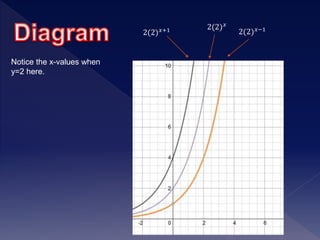
2) It explains that changing a stretches or compresses the graph vertically, changing h shifts the graph left or right, and changing k shifts the graph up or down.
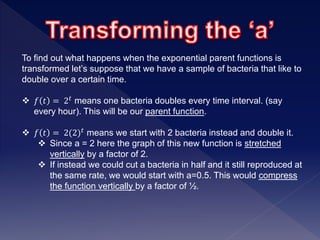
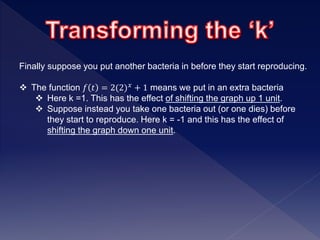
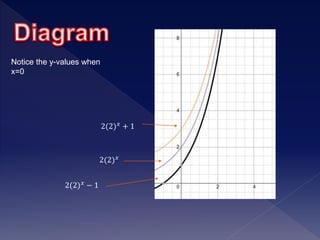
3) Examples are given of exponential growth scenarios involving bacteria reproduction and how changes to the starting amount, time, or vertical shift would be represented by transformations to the parameters a, h, and k.