SlideShare a Scribd company logo
MAT 255 Business Statistics I
Chapter 3
Describing Data: Numerical
Measures
Text: Lind, Statistical Techniques in
Business and Economics, 15e
Chapter 3 Objectives
Objective Section
Explain the concept of central tendency. 3.1
Identify and compute the arithmetic mean. 3.2, 3.3, 3.4
Compute and interpret the weighted mean. 3.5
Determine the median. 3.6
Identify the mode. 3.7
Describe the shape of a distribution based on the positions of the mean,
median, and mode.
3.9
Calculate the geometric mean. 3.10
Explain and apply measures of dispersion. 3.11, 3.12
Explain Chebyshev’s Theorem and the empirical rule. 3.14
Compute the mean and standard deviation of grouped data. 3.15
What should you do?
Learning Activities Details
Read Chapter 3. Pages 22 - 46
View the MAT 255 Chapter 3 Video Lecture
Playlist and take notes as if you were in a lecture
class.
There are videos on the
following topics:
• Measures of Location
Overview
• Page 62, exercise 8
• Page 62, exercise 10
• Page 64, exercise 16
• Page 67, exercise 20
• The Relative Positions of the
Mean, Median, and Mode
• Page 73, exercise 28
• Page 74, exercise 32
• Measures of Dispersion Overview
• Page 77, example
• Page 79, exercise 38
• Page 82, exercise 46
• Page 85, exercise 50
• Page 87, exercise 54
• Page 87, exercise 56
• Page 91, exercise 58
Complete exercise 1 – 11 odd, 15 – 29 odd, 35,
39, 41, 47 – 55 odd 59, 61, 65, 69, 73, 75, 85.
Complete homework for self-assessment purposes. The answers to odd
questions are found in the back of the book.
Complete the Chapter 3 Practice Worksheet and
view the worked out solutions.
The practice worksheet is for self-assessment purposes. You can view the
worked out solutions to the worksheet after you complete it.
Post a relevant comment, insight or question to
the MAT 255-4H1 Fall 2014 Google+ Community.
The Google+ Community allows you to communicate with classmates in an
online open forum.
Complete MAT 255 Chapter 3 Survey. Communicate to the instructor the areas where you still need help.
Measures of Location Overview
Text: Lind, Statistical Techniques in
Business and Economics, 15e
Delaware Technical Community College
• The purpose of a measure of location is to
pinpoint the center of a distribution of data.
• In addition to measures of locations, we
should consider the dispersion – often called
the variation or spread – in the data.
• Five measures of location:
1. The arithmetic mean
2. The weighted mean
3. The median
4. The mode
5. The geometric mean
Population Mean: 𝝁 =
𝑿
𝑵
• 𝜇 represents the population mean. It is the
Greek lower case letter “mu.”
• 𝑁 is the number of values in the population.
• 𝑋 represents any particular value.
• is the Greek capital letter “sigma” and
indicates the operation of adding.
• 𝑋 is the sum of the 𝑋 values in a population.
A parameter is a characteristic of a population.
Sample Mean: 𝑿 =
𝑿
𝒏
• 𝑋 represents the sample mean. It is read “X bar.”
• 𝑛 is the number of values in the sample.
• 𝑋 represents any particular value.
• is the Greek capital letter “sigma” and
indicates the operation of adding.
• 𝑋 is the sum of the 𝑋 values in a population.
A statistic is a characteristic of a sample.
Important properties of the arithmetic mean:
1. Every set of interval- or ratio- level has a mean.
2. All the values are included in computing the mean.
3. The mean is unique.
4. The sum of the deviations of each value from the mean is
0.
𝑋 − 𝑋 = 0
One disadvantage: if one or two values are either extremely
high or extremely low compared to the majority of the data,
then the mean might not be an appropriate average to
represent the data.
Weighted Mean:
𝑿 𝒘 =
𝒘 𝟏 𝑿 𝟏+𝒘 𝟐 𝑿 𝟐+𝒘 𝟑 𝑿 𝟑+⋯+𝒘 𝒏 𝑿 𝒏
𝒘 𝟏+𝒘 𝟐+𝒘 𝟑+⋯𝒘 𝒏
Pronounced “X bar sub w”
Or
𝑿 𝒘 =
𝒘𝑿
𝒘
Median: The midpoint of the values after they
have been ordered from the smallest to the
largest, or the largest to the smallest.
The median is not affected by extremely large
of small values.
The median can be computed for ordinal-level
data or higher.
Mode: The value of the observation that appears most
frequently.
The mode is especially useful in summarizing nominal-
level data.
The mode can be determined for all levels of data –
nominal, ordinal, interval, and ratio. The mode is not
affected by extremely high or low values. For many
data sets, though, there is no mode, causing it to be
used less often than the mean and median.
There can be one mode, multiple modes, or no mode for
a set of dat.
Page 62, exercise 8
Text: Lind, Statistical Techniques in
Business and Economics, 15e
Delaware Technical Community College
Page 62, exercise 8:
The accounting department at a mail-order
company counted the following numbers of
incoming calls per day to the company’s toll-free
number during the first 7 days in May:
14, 24, 19, 31, 36, 26, 17.
a. Compute the arithmetic mean.
b. Indicate whether it is a statistic or a parameter.
Page 62, exercise 10
Text: Lind, Statistical Techniques in
Business and Economics, 15e
Delaware Technical Community College
Page 62, exercise 10:
The Human Relations Director at Ford began a study
of the overtime hours in the Inspection
Department. A sample of 15 showed they worked
the following number of overtime hours last month:
13, 13, 12, 15, 7, 15, 5, 12, 6, 7, 12, 10, 9, 13, 12
a. Compute the arithmetic mean.
b. Indicate whether it is a statistic or a parameter.
Page 64, exercise 16
Text: Lind, Statistical Techniques in
Business and Economics, 15e
Delaware Technical Community College
Page 64, exercise 16:
Andrews and Associates specializes in corporate
law. They charge $100 an hour for researching a
case, $75 an hour for consultations, and $200 an
hour for writing a brief. Last week one of the
associates spent 10 hours consulting with her
client, 10 hours researching the case, and 20
hours writing the brief. What was the weighted
mean hourly charge for her legal services?
Page 67, exercise 20
Text: Lind, Statistical Techniques in
Business and Economics, 15e
Delaware Technical Community College
Page 67, exercise 20:
The following are the ages of the 10 people in
the video arcade at the Southwyck Shopping
Mall at 10 A.M.
12, 8, 17, 6, 11, 14, 8, 17, 10, 8
Determine the median age. Determine the
mode.
The Relative Positions of the
Mean, Median, and Mode
Text: Lind, Statistical Techniques in
Business and Economics, 15e
Delaware Technical Community College
The Relative Positions of the Mean,
Median, and Mode
A histogram is a graphical display of a frequency
distribution for quantitative data. That
distribution can take various shapes. Here we
will discuss characteristics for a symmetric
distribution, a positively skewed distribution,
and a negatively skewed distribution.
A Symmetric Distribution
0
0.5
1
1.5
2
2.5
3
3.5
4
4.5
0 up to 5 5 up to 10 10 up to 15 15 up to 20 20 up to 25 25 up to 30 30 up to 35
A Positively Skewed Distribution
0
1
2
3
4
5
6
7
8
9
0 up to 5 5 up to 10 10 up to 15 15 up to 20 20 up to 25 25 up to 30 30 up to 35
A Negatively Skewed Distribution
0
1
2
3
4
5
6
7
8
9
0 up to 5 5 up to 10 10 up to 15 15 up to 20 20 up to 25 25 up to 30 30 up to 35
Page 73, exercise 28
Text: Lind, Statistical Techniques in
Business and Economics, 15e
Delaware Technical Community College
Page 73, exercise 28:
Compute the geometric mean of the following
percent increases: 2, 8, 6, 4, 10, 6, 8
Geometric Mean: 𝐺𝑀 =
𝑛
𝑋1 𝑋2 ⋯ 𝑋 𝑛
The geometric mean is useful in finding the
average change of percentages, ratios, indexes,
or growth rates over time. The geometric mean
will always be less than or equal to the
arithmetic mean.
Page 74, exercise 32
Text: Lind, Statistical Techniques in
Business and Economics, 15e
Delaware Technical Community College
Page 74, exercise 32:
JetBlue Airways is an American low-cost airline
headquartered in New York City. Its main base is
John F. Kennedy International Airport. JetBlue’s
revenue in 2002 was $635.2 million. By 2009,
revenue had increased to $3,290.0 million.
What was the geometric mean annual increase
for the period?
Rate of Increase Over Time:
𝐺𝑀 =
𝑛 Value at end of period
Value at start of period
− 1
Measures of Dispersion
Overview
Text: Lind, Statistical Techniques in
Business and Economics, 15e
Delaware Technical Community College
A measure of location only describes the center of
data. You would also want to know about the
variation (or dispersion) of the data as well in order
to have a more complete picture.
A small value for a measure of dispersion indicates
that the data are clustered closely. The mean is
therefore considered representative of the data.
Conversely, a large measure of dispersion indicates
that he mean is not reliable.
Comparing the measures of dispersions of multiple
distributions is also helpful.
Range: The difference between the largest and
the smallest values in a data set.
Range = Largest Value – Smallest Value
Mean Deviation: The arithmetic mean of the
absolute values of the deviations from the
arithmetic mean. It measures the mean
amount by which the values in a population, or
sample vary from their mean.
Mean Deviation: 𝑴𝑫 =
𝑿− 𝑿
𝒏
Variance: The arithmetic mean of the squared
deviations from the mean.
Population Variance: 𝝈 𝟐
=
𝑿−𝝁 𝟐
𝑵
Read as “sigma squared”
Standard Deviation: The square root of the
variance.
Population Standard Deviation: 𝛔 =
𝑿−𝝁 𝟐
𝑵
Sample Variance: 𝒔 𝟐
=
𝑿− 𝑿 𝟐
𝒏−𝟏
Sample Standard Deviation: 𝒔 =
𝑿− 𝑿 𝟐
𝒏−𝟏
Although the use of 𝑛 is logical since 𝑋 is used to
estimate 𝜇, it tends to underestimate the population
variance, 𝜎2. The use of 𝑛 − 1 in the denominator
provides the appropriate correction for this tendency.
Because the primary use of the sample statistic 𝑠2
is to
estimate population parameters like 𝜎2, 𝑛 − 1 is
preferred to 𝑛 in defining the sample variance. This
convention is also used when computing the sample
standard deviation.
The variance and standard deviation are also
based on the deviations from the mean.
However, instead of using the absolute value of
the deviations, the variance and the standard
deviation square the deviations.
Page 77, example
Text: Lind, Statistical Techniques in
Business and Economics, 15e
Delaware Technical Community College
Page 77, example:
The chart below shows the
number of cappuccinos sold
at Starbucks in the Orange
County airport and the
Ontario, California, airport
between 4 and 5 P.M. for a
sample of five days last
month. Determine the
mean, median, range, and
mean deviation for each
location. Comment on the
similarities and differences
in these measures.
Orange
County
Ontario
20 20
40 49
50 50
60 51
80 80
Page 79, exercise 38
Text: Lind, Statistical Techniques in
Business and Economics, 15e
Delaware Technical Community College
Page 79, exercise 38:
A sample of eight companies in the aerospace
industry was surveyed as to their return on
investment last year. The results are (in
percent):
10.6, 12.6, 14.8, 18.2, 12.0, 14.8, 12.2, and 15.6
Calculate the range, arithmetic mean, mean
deviation, and interpret the values.
Page 82, exercise 46
Text: Lind, Statistical Techniques in
Business and Economics, 15e
Delaware Technical Community College
Page 82, exercise 46:
The annual incomes of the five vice presidents of
TMV industries are $125,000; $128,000; $122,000;
$133,000; and $140,000. Consider this population.
a. What is the range?
b. What is the arithmetic mean?
c. What is the population variance? The standard
deviation?
d. The annual incomes of officers of another firm
similar to TMV industries were also studied. The
mean was $129,000 and the standard deviation
$8,612. Compare the means and dispersions in
the two firms.
Page 85, exercise 50
Text: Lind, Statistical Techniques in
Business and Economics, 15e
Delaware Technical Community College
Page 85, exercise 50:
Compute the sample variance and the sample
standard deviation.
The sample of eight companies in the aerospace
industry was surveyed as to their return on
investment last year. The results are: 10.6, 12.6,
14.8, 18.2, 12.0, 14.8, 12.2, and 15.6
Page 87, exercise 54
Text: Lind, Statistical Techniques in
Business and Economics, 15e
Delaware Technical Community College
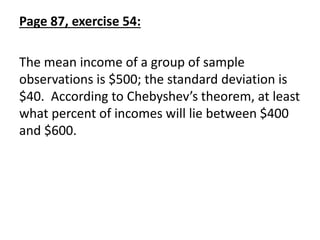
Page 87, exercise 54:
The mean income of a group of sample
observations is $500; the standard deviation is
$40. According to Chebyshev’s theorem, at least
what percent of incomes will lie between $400
and $600.
Chebyshev’s Theorem: For any set of
observations (sample or population), the
proportion of the values that lie within k
standard deviations of the mean is at least 𝟏 −
𝟏
𝒌 𝟐, where k is any constant greater than 1.
Page 87, exercise 56
Text: Lind, Statistical Techniques in
Business and Economics, 15e
Delaware Technical Community College
Page 87, exercise 56:
The distribution of a sample of the number of
drinks sold per day at a nearby Wendy’s is
symmetric and bell-shaped. The mean number
of drinks sold per day is 91.9 with a standard
deviation of 4.67. Using the empirical rule, sales
will be between what two values on 68 percent
of the days? Sales will be between what two
values on 95 percent of the days?
Empirical Rule: For a symmetrical, bell-shaped
frequency distribution, approximately 68
percent of the observations will lie within plus
and minus one standard deviation of the mean;
about 95 percent of the observations will lie
within plus and minus two standard deviations
of the mean; and 99.7 percent will lie within
plus or minus three standard deviations of the
mean.
(Chart 3-7, page 86)
Page 91, exercise 58
Text: Lind, Statistical Techniques in
Business and Economics, 15e
Delaware Technical Community College
Page 91, exercise 58:
Determine the mean and standard deviation of
the following frequency distribution.
Class Frequency
0 up to 5 2
5 up to 10 7
10 up to 15 12
15 up to 20 6
20 up to 25 3
Arithmetic Mean of Grouped Data:
𝑿 =
𝒇𝑴
𝒏
Standard Deviation, Grouped Data:
𝒔 =
𝒇(𝑴 − 𝑿) 𝟐
𝒏 − 𝟏

More Related Content

What's hot

Chap03 numerical descriptive measures
Chap03 numerical descriptive measuresChap03 numerical descriptive measures
Chap03 numerical descriptive measures
Uni Azza Aunillah
 
Business statistics solved numericals
Business statistics solved numericalsBusiness statistics solved numericals
Business statistics solved numericals
Anurag Srivastava
 
Other Measures of Location
Other Measures of LocationOther Measures of Location
Other Measures of Location
Samuel John Parreño
 
Business Statistics Chapter 2
Business Statistics Chapter 2Business Statistics Chapter 2
Business Statistics Chapter 2
Lux PP
 
Conversion of fraction, decimal and percentage
Conversion of fraction, decimal and percentageConversion of fraction, decimal and percentage
Conversion of fraction, decimal and percentage
jaeyalpogi
 
Discrete probability distribution (complete)
Discrete probability distribution (complete)Discrete probability distribution (complete)
Discrete probability distribution (complete)
ISYousafzai
 
Z scores
Z scoresZ scores
Z scores
cmsbandara
 
Statistical survey project
Statistical survey projectStatistical survey project
Statistical survey projectjep2792
 
Chap05 discrete probability distributions
Chap05 discrete probability distributionsChap05 discrete probability distributions
Chap05 discrete probability distributions
Uni Azza Aunillah
 
Section 3: Interpreting Sensitivity Analysis on Excel Solver
Section 3: Interpreting Sensitivity Analysis on Excel SolverSection 3: Interpreting Sensitivity Analysis on Excel Solver
Section 3: Interpreting Sensitivity Analysis on Excel Solver
Zakaria Hasaneen
 
Prime numbers
Prime numbersPrime numbers
Prime numbers
Solo Hermelin
 
Les5e ppt 06
Les5e ppt 06Les5e ppt 06
Les5e ppt 06
Subas Nandy
 
Business Math Chapter 3
Business Math Chapter 3Business Math Chapter 3
Business Math Chapter 3
Nazrin Nazdri
 
Lesson 2 percentiles
Lesson 2   percentilesLesson 2   percentiles
Lesson 2 percentiles
karisashley
 
3-Measures of Central Tendency for Ungrouped data 2.pptx
3-Measures of Central Tendency for Ungrouped data 2.pptx3-Measures of Central Tendency for Ungrouped data 2.pptx
3-Measures of Central Tendency for Ungrouped data 2.pptx
ssuserdb3083
 
03 ch ken black solution
03 ch ken black solution03 ch ken black solution
03 ch ken black solutionKrunal Shah
 
Operations Research
Operations ResearchOperations Research
Operations Researchajithsrc
 
Solutions Manual for Statistics For Managers Using Microsoft Excel 7th Editio...
Solutions Manual for Statistics For Managers Using Microsoft Excel 7th Editio...Solutions Manual for Statistics For Managers Using Microsoft Excel 7th Editio...
Solutions Manual for Statistics For Managers Using Microsoft Excel 7th Editio...
Shepparded
 
Quantitative Analysis For Management 13th Edition Render Solutions Manual
Quantitative Analysis For Management 13th Edition Render Solutions ManualQuantitative Analysis For Management 13th Edition Render Solutions Manual
Quantitative Analysis For Management 13th Edition Render Solutions Manual
StricklandMaxines
 
Numerical Analysis
Numerical AnalysisNumerical Analysis
Numerical Analysis
Mallela Niteesh Kumar Reddy
 

What's hot (20)

Chap03 numerical descriptive measures
Chap03 numerical descriptive measuresChap03 numerical descriptive measures
Chap03 numerical descriptive measures
 
Business statistics solved numericals
Business statistics solved numericalsBusiness statistics solved numericals
Business statistics solved numericals
 
Other Measures of Location
Other Measures of LocationOther Measures of Location
Other Measures of Location
 
Business Statistics Chapter 2
Business Statistics Chapter 2Business Statistics Chapter 2
Business Statistics Chapter 2
 
Conversion of fraction, decimal and percentage
Conversion of fraction, decimal and percentageConversion of fraction, decimal and percentage
Conversion of fraction, decimal and percentage
 
Discrete probability distribution (complete)
Discrete probability distribution (complete)Discrete probability distribution (complete)
Discrete probability distribution (complete)
 
Z scores
Z scoresZ scores
Z scores
 
Statistical survey project
Statistical survey projectStatistical survey project
Statistical survey project
 
Chap05 discrete probability distributions
Chap05 discrete probability distributionsChap05 discrete probability distributions
Chap05 discrete probability distributions
 
Section 3: Interpreting Sensitivity Analysis on Excel Solver
Section 3: Interpreting Sensitivity Analysis on Excel SolverSection 3: Interpreting Sensitivity Analysis on Excel Solver
Section 3: Interpreting Sensitivity Analysis on Excel Solver
 
Prime numbers
Prime numbersPrime numbers
Prime numbers
 
Les5e ppt 06
Les5e ppt 06Les5e ppt 06
Les5e ppt 06
 
Business Math Chapter 3
Business Math Chapter 3Business Math Chapter 3
Business Math Chapter 3
 
Lesson 2 percentiles
Lesson 2   percentilesLesson 2   percentiles
Lesson 2 percentiles
 
3-Measures of Central Tendency for Ungrouped data 2.pptx
3-Measures of Central Tendency for Ungrouped data 2.pptx3-Measures of Central Tendency for Ungrouped data 2.pptx
3-Measures of Central Tendency for Ungrouped data 2.pptx
 
03 ch ken black solution
03 ch ken black solution03 ch ken black solution
03 ch ken black solution
 
Operations Research
Operations ResearchOperations Research
Operations Research
 
Solutions Manual for Statistics For Managers Using Microsoft Excel 7th Editio...
Solutions Manual for Statistics For Managers Using Microsoft Excel 7th Editio...Solutions Manual for Statistics For Managers Using Microsoft Excel 7th Editio...
Solutions Manual for Statistics For Managers Using Microsoft Excel 7th Editio...
 
Quantitative Analysis For Management 13th Edition Render Solutions Manual
Quantitative Analysis For Management 13th Edition Render Solutions ManualQuantitative Analysis For Management 13th Edition Render Solutions Manual
Quantitative Analysis For Management 13th Edition Render Solutions Manual
 
Numerical Analysis
Numerical AnalysisNumerical Analysis
Numerical Analysis
 

Viewers also liked

Chapter 05
Chapter 05Chapter 05
Chapter 05bmcfad01
 
Chapter 04
Chapter 04Chapter 04
Chapter 04bmcfad01
 
Chapter 10
Chapter 10Chapter 10
Chapter 10bmcfad01
 
Chapter 02
Chapter 02Chapter 02
Chapter 02bmcfad01
 
Chapter 06
Chapter 06Chapter 06
Chapter 06bmcfad01
 
Chapter 07
Chapter 07Chapter 07
Chapter 07bmcfad01
 
Chapter 09
Chapter 09Chapter 09
Chapter 09bmcfad01
 
Chapter 10
Chapter 10Chapter 10
Chapter 10
Tuul Tuul
 
Chapter 09
Chapter 09 Chapter 09
Chapter 09
Tuul Tuul
 
MTH120_Chapter8
MTH120_Chapter8MTH120_Chapter8
MTH120_Chapter8Sida Say
 
Statistical Techniques in Business & Economics (McGRAV-HILL) 12 Edt. Chapter ...
Statistical Techniques in Business & Economics (McGRAV-HILL) 12 Edt. Chapter ...Statistical Techniques in Business & Economics (McGRAV-HILL) 12 Edt. Chapter ...
Statistical Techniques in Business & Economics (McGRAV-HILL) 12 Edt. Chapter ...tarta
 
Chapter 11
Chapter 11Chapter 11
Chapter 11bmcfad01
 
Chapter 01
Chapter 01Chapter 01
Chapter 01bmcfad01
 
Chapter 08
Chapter 08 Chapter 08
Chapter 08
Tuul Tuul
 
Chapter 12
Chapter 12Chapter 12
Chapter 12bmcfad01
 
Chapter 11
Chapter 11 Chapter 11
Chapter 11
Tuul Tuul
 
Chapter 03
Chapter 03Chapter 03
Chapter 03bmcfad01
 
Chapter 16
Chapter 16Chapter 16
Chapter 16bmcfad01
 
Chapter 12
Chapter 12Chapter 12
Chapter 12
Tuul Tuul
 

Viewers also liked (20)

Chapter 05
Chapter 05Chapter 05
Chapter 05
 
Chapter 04
Chapter 04Chapter 04
Chapter 04
 
Chapter 10
Chapter 10Chapter 10
Chapter 10
 
Chapter 02
Chapter 02Chapter 02
Chapter 02
 
Chap008
Chap008Chap008
Chap008
 
Chapter 06
Chapter 06Chapter 06
Chapter 06
 
Chapter 07
Chapter 07Chapter 07
Chapter 07
 
Chapter 09
Chapter 09Chapter 09
Chapter 09
 
Chapter 10
Chapter 10Chapter 10
Chapter 10
 
Chapter 09
Chapter 09 Chapter 09
Chapter 09
 
MTH120_Chapter8
MTH120_Chapter8MTH120_Chapter8
MTH120_Chapter8
 
Statistical Techniques in Business & Economics (McGRAV-HILL) 12 Edt. Chapter ...
Statistical Techniques in Business & Economics (McGRAV-HILL) 12 Edt. Chapter ...Statistical Techniques in Business & Economics (McGRAV-HILL) 12 Edt. Chapter ...
Statistical Techniques in Business & Economics (McGRAV-HILL) 12 Edt. Chapter ...
 
Chapter 11
Chapter 11Chapter 11
Chapter 11
 
Chapter 01
Chapter 01Chapter 01
Chapter 01
 
Chapter 08
Chapter 08 Chapter 08
Chapter 08
 
Chapter 12
Chapter 12Chapter 12
Chapter 12
 
Chapter 11
Chapter 11 Chapter 11
Chapter 11
 
Chapter 03
Chapter 03Chapter 03
Chapter 03
 
Chapter 16
Chapter 16Chapter 16
Chapter 16
 
Chapter 12
Chapter 12Chapter 12
Chapter 12
 

Similar to Mat 255 chapter 3 notes

Statistical ProcessesCan descriptive statistical processes b.docx
Statistical ProcessesCan descriptive statistical processes b.docxStatistical ProcessesCan descriptive statistical processes b.docx
Statistical ProcessesCan descriptive statistical processes b.docx
darwinming1
 
Statistic Project Essay
Statistic Project EssayStatistic Project Essay
Statistic Project Essay
Robin Anderson
 
Computing Descriptive Statistics © 2014 Argos.docx
 Computing Descriptive Statistics     © 2014 Argos.docx Computing Descriptive Statistics     © 2014 Argos.docx
Computing Descriptive Statistics © 2014 Argos.docx
aryan532920
 
Computing Descriptive Statistics © 2014 Argos.docx
Computing Descriptive Statistics     © 2014 Argos.docxComputing Descriptive Statistics     © 2014 Argos.docx
Computing Descriptive Statistics © 2014 Argos.docx
AASTHA76
 
Krupa rm
Krupa rmKrupa rm
Krupa rm
Krupa Mehta
 
Unit 1 Introduction
Unit 1 IntroductionUnit 1 Introduction
Unit 1 Introduction
Rai University
 
Mean_Median_Mode.ppthhhhhhhhhhhhhhhhhhhhhhhhhhhhhhhhhhhhhhhhhhhhhhhhhhhhhhhhh...
Mean_Median_Mode.ppthhhhhhhhhhhhhhhhhhhhhhhhhhhhhhhhhhhhhhhhhhhhhhhhhhhhhhhhh...Mean_Median_Mode.ppthhhhhhhhhhhhhhhhhhhhhhhhhhhhhhhhhhhhhhhhhhhhhhhhhhhhhhhhh...
Mean_Median_Mode.ppthhhhhhhhhhhhhhhhhhhhhhhhhhhhhhhhhhhhhhhhhhhhhhhhhhhhhhhhh...
JuliusRomano3
 
Unit 5 8614.pptx A_Movie_Review_Pursuit_Of_Happiness
Unit 5 8614.pptx A_Movie_Review_Pursuit_Of_HappinessUnit 5 8614.pptx A_Movie_Review_Pursuit_Of_Happiness
Unit 5 8614.pptx A_Movie_Review_Pursuit_Of_Happiness
ourbusiness0014
 
Answer the questions in one paragraph 4-5 sentences. · Why did t.docx
Answer the questions in one paragraph 4-5 sentences. · Why did t.docxAnswer the questions in one paragraph 4-5 sentences. · Why did t.docx
Answer the questions in one paragraph 4-5 sentences. · Why did t.docx
boyfieldhouse
 
Statistics
StatisticsStatistics
5.DATA SUMMERISATION.ppt
5.DATA SUMMERISATION.ppt5.DATA SUMMERISATION.ppt
5.DATA SUMMERISATION.ppt
chusematelephone
 
Chapter 18
Chapter 18Chapter 18
Chapter 18
Aneel Raza
 
Lesson 6 measures of central tendency
Lesson 6 measures of central tendencyLesson 6 measures of central tendency
Lesson 6 measures of central tendencynurun2010
 
Statistics Based On Ncert X Class
Statistics Based On Ncert X ClassStatistics Based On Ncert X Class
Statistics Based On Ncert X Class
Ranveer Kumar
 
Executive Program Practical Connection Assignment - 100 poin
Executive Program Practical Connection Assignment - 100 poinExecutive Program Practical Connection Assignment - 100 poin
Executive Program Practical Connection Assignment - 100 poin
BetseyCalderon89
 
Measures of Central Tendency.ppt
Measures of Central Tendency.pptMeasures of Central Tendency.ppt
Measures of Central Tendency.ppt
AdamRayManlunas1
 
Business Statistics Chapter 3
Business Statistics Chapter 3Business Statistics Chapter 3
Business Statistics Chapter 3
Lux PP
 
Lesson 1 05 measuring central tendency
Lesson 1 05 measuring central tendencyLesson 1 05 measuring central tendency
Lesson 1 05 measuring central tendency
Perla Pelicano Corpez
 
Dymystify Statistics Day 1.pdf
Dymystify Statistics Day 1.pdfDymystify Statistics Day 1.pdf
Dymystify Statistics Day 1.pdf
KristineIbaez2
 

Similar to Mat 255 chapter 3 notes (20)

Statistical ProcessesCan descriptive statistical processes b.docx
Statistical ProcessesCan descriptive statistical processes b.docxStatistical ProcessesCan descriptive statistical processes b.docx
Statistical ProcessesCan descriptive statistical processes b.docx
 
Statistic Project Essay
Statistic Project EssayStatistic Project Essay
Statistic Project Essay
 
Computing Descriptive Statistics © 2014 Argos.docx
 Computing Descriptive Statistics     © 2014 Argos.docx Computing Descriptive Statistics     © 2014 Argos.docx
Computing Descriptive Statistics © 2014 Argos.docx
 
Computing Descriptive Statistics © 2014 Argos.docx
Computing Descriptive Statistics     © 2014 Argos.docxComputing Descriptive Statistics     © 2014 Argos.docx
Computing Descriptive Statistics © 2014 Argos.docx
 
Krupa rm
Krupa rmKrupa rm
Krupa rm
 
Unit 1 Introduction
Unit 1 IntroductionUnit 1 Introduction
Unit 1 Introduction
 
Mean_Median_Mode.ppthhhhhhhhhhhhhhhhhhhhhhhhhhhhhhhhhhhhhhhhhhhhhhhhhhhhhhhhh...
Mean_Median_Mode.ppthhhhhhhhhhhhhhhhhhhhhhhhhhhhhhhhhhhhhhhhhhhhhhhhhhhhhhhhh...Mean_Median_Mode.ppthhhhhhhhhhhhhhhhhhhhhhhhhhhhhhhhhhhhhhhhhhhhhhhhhhhhhhhhh...
Mean_Median_Mode.ppthhhhhhhhhhhhhhhhhhhhhhhhhhhhhhhhhhhhhhhhhhhhhhhhhhhhhhhhh...
 
Unit 5 8614.pptx A_Movie_Review_Pursuit_Of_Happiness
Unit 5 8614.pptx A_Movie_Review_Pursuit_Of_HappinessUnit 5 8614.pptx A_Movie_Review_Pursuit_Of_Happiness
Unit 5 8614.pptx A_Movie_Review_Pursuit_Of_Happiness
 
DATA COLLECTION IN RESEARCH
DATA COLLECTION IN RESEARCHDATA COLLECTION IN RESEARCH
DATA COLLECTION IN RESEARCH
 
Answer the questions in one paragraph 4-5 sentences. · Why did t.docx
Answer the questions in one paragraph 4-5 sentences. · Why did t.docxAnswer the questions in one paragraph 4-5 sentences. · Why did t.docx
Answer the questions in one paragraph 4-5 sentences. · Why did t.docx
 
Statistics
StatisticsStatistics
Statistics
 
5.DATA SUMMERISATION.ppt
5.DATA SUMMERISATION.ppt5.DATA SUMMERISATION.ppt
5.DATA SUMMERISATION.ppt
 
Chapter 18
Chapter 18Chapter 18
Chapter 18
 
Lesson 6 measures of central tendency
Lesson 6 measures of central tendencyLesson 6 measures of central tendency
Lesson 6 measures of central tendency
 
Statistics Based On Ncert X Class
Statistics Based On Ncert X ClassStatistics Based On Ncert X Class
Statistics Based On Ncert X Class
 
Executive Program Practical Connection Assignment - 100 poin
Executive Program Practical Connection Assignment - 100 poinExecutive Program Practical Connection Assignment - 100 poin
Executive Program Practical Connection Assignment - 100 poin
 
Measures of Central Tendency.ppt
Measures of Central Tendency.pptMeasures of Central Tendency.ppt
Measures of Central Tendency.ppt
 
Business Statistics Chapter 3
Business Statistics Chapter 3Business Statistics Chapter 3
Business Statistics Chapter 3
 
Lesson 1 05 measuring central tendency
Lesson 1 05 measuring central tendencyLesson 1 05 measuring central tendency
Lesson 1 05 measuring central tendency
 
Dymystify Statistics Day 1.pdf
Dymystify Statistics Day 1.pdfDymystify Statistics Day 1.pdf
Dymystify Statistics Day 1.pdf
 

Recently uploaded

Operation Blue Star - Saka Neela Tara
Operation Blue Star   -  Saka Neela TaraOperation Blue Star   -  Saka Neela Tara
Operation Blue Star - Saka Neela Tara
Balvir Singh
 
Azure Interview Questions and Answers PDF By ScholarHat
Azure Interview Questions and Answers PDF By ScholarHatAzure Interview Questions and Answers PDF By ScholarHat
Azure Interview Questions and Answers PDF By ScholarHat
Scholarhat
 
Language Across the Curriculm LAC B.Ed.
Language Across the  Curriculm LAC B.Ed.Language Across the  Curriculm LAC B.Ed.
Language Across the Curriculm LAC B.Ed.
Atul Kumar Singh
 
Embracing GenAI - A Strategic Imperative
Embracing GenAI - A Strategic ImperativeEmbracing GenAI - A Strategic Imperative
Embracing GenAI - A Strategic Imperative
Peter Windle
 
Acetabularia Information For Class 9 .docx
Acetabularia Information For Class 9  .docxAcetabularia Information For Class 9  .docx
Acetabularia Information For Class 9 .docx
vaibhavrinwa19
 
CACJapan - GROUP Presentation 1- Wk 4.pdf
CACJapan - GROUP Presentation 1- Wk 4.pdfCACJapan - GROUP Presentation 1- Wk 4.pdf
CACJapan - GROUP Presentation 1- Wk 4.pdf
camakaiclarkmusic
 
1.4 modern child centered education - mahatma gandhi-2.pptx
1.4 modern child centered education - mahatma gandhi-2.pptx1.4 modern child centered education - mahatma gandhi-2.pptx
1.4 modern child centered education - mahatma gandhi-2.pptx
JosvitaDsouza2
 
Marketing internship report file for MBA
Marketing internship report file for MBAMarketing internship report file for MBA
Marketing internship report file for MBA
gb193092
 
Welcome to TechSoup New Member Orientation and Q&A (May 2024).pdf
Welcome to TechSoup   New Member Orientation and Q&A (May 2024).pdfWelcome to TechSoup   New Member Orientation and Q&A (May 2024).pdf
Welcome to TechSoup New Member Orientation and Q&A (May 2024).pdf
TechSoup
 
The approach at University of Liverpool.pptx
The approach at University of Liverpool.pptxThe approach at University of Liverpool.pptx
The approach at University of Liverpool.pptx
Jisc
 
STRAND 3 HYGIENIC PRACTICES.pptx GRADE 7 CBC
STRAND 3 HYGIENIC PRACTICES.pptx GRADE 7 CBCSTRAND 3 HYGIENIC PRACTICES.pptx GRADE 7 CBC
STRAND 3 HYGIENIC PRACTICES.pptx GRADE 7 CBC
kimdan468
 
Unit 2- Research Aptitude (UGC NET Paper I).pdf
Unit 2- Research Aptitude (UGC NET Paper I).pdfUnit 2- Research Aptitude (UGC NET Paper I).pdf
Unit 2- Research Aptitude (UGC NET Paper I).pdf
Thiyagu K
 
Introduction to AI for Nonprofits with Tapp Network
Introduction to AI for Nonprofits with Tapp NetworkIntroduction to AI for Nonprofits with Tapp Network
Introduction to AI for Nonprofits with Tapp Network
TechSoup
 
special B.ed 2nd year old paper_20240531.pdf
special B.ed 2nd year old paper_20240531.pdfspecial B.ed 2nd year old paper_20240531.pdf
special B.ed 2nd year old paper_20240531.pdf
Special education needs
 
BÀI TẬP BỔ TRỢ TIẾNG ANH GLOBAL SUCCESS LỚP 3 - CẢ NĂM (CÓ FILE NGHE VÀ ĐÁP Á...
BÀI TẬP BỔ TRỢ TIẾNG ANH GLOBAL SUCCESS LỚP 3 - CẢ NĂM (CÓ FILE NGHE VÀ ĐÁP Á...BÀI TẬP BỔ TRỢ TIẾNG ANH GLOBAL SUCCESS LỚP 3 - CẢ NĂM (CÓ FILE NGHE VÀ ĐÁP Á...
BÀI TẬP BỔ TRỢ TIẾNG ANH GLOBAL SUCCESS LỚP 3 - CẢ NĂM (CÓ FILE NGHE VÀ ĐÁP Á...
Nguyen Thanh Tu Collection
 
Honest Reviews of Tim Han LMA Course Program.pptx
Honest Reviews of Tim Han LMA Course Program.pptxHonest Reviews of Tim Han LMA Course Program.pptx
Honest Reviews of Tim Han LMA Course Program.pptx
timhan337
 
Francesca Gottschalk - How can education support child empowerment.pptx
Francesca Gottschalk - How can education support child empowerment.pptxFrancesca Gottschalk - How can education support child empowerment.pptx
Francesca Gottschalk - How can education support child empowerment.pptx
EduSkills OECD
 
Unit 8 - Information and Communication Technology (Paper I).pdf
Unit 8 - Information and Communication Technology (Paper I).pdfUnit 8 - Information and Communication Technology (Paper I).pdf
Unit 8 - Information and Communication Technology (Paper I).pdf
Thiyagu K
 
How libraries can support authors with open access requirements for UKRI fund...
How libraries can support authors with open access requirements for UKRI fund...How libraries can support authors with open access requirements for UKRI fund...
How libraries can support authors with open access requirements for UKRI fund...
Jisc
 
Best Digital Marketing Institute In NOIDA
Best Digital Marketing Institute In NOIDABest Digital Marketing Institute In NOIDA
Best Digital Marketing Institute In NOIDA
deeptiverma2406
 

Recently uploaded (20)

Operation Blue Star - Saka Neela Tara
Operation Blue Star   -  Saka Neela TaraOperation Blue Star   -  Saka Neela Tara
Operation Blue Star - Saka Neela Tara
 
Azure Interview Questions and Answers PDF By ScholarHat
Azure Interview Questions and Answers PDF By ScholarHatAzure Interview Questions and Answers PDF By ScholarHat
Azure Interview Questions and Answers PDF By ScholarHat
 
Language Across the Curriculm LAC B.Ed.
Language Across the  Curriculm LAC B.Ed.Language Across the  Curriculm LAC B.Ed.
Language Across the Curriculm LAC B.Ed.
 
Embracing GenAI - A Strategic Imperative
Embracing GenAI - A Strategic ImperativeEmbracing GenAI - A Strategic Imperative
Embracing GenAI - A Strategic Imperative
 
Acetabularia Information For Class 9 .docx
Acetabularia Information For Class 9  .docxAcetabularia Information For Class 9  .docx
Acetabularia Information For Class 9 .docx
 
CACJapan - GROUP Presentation 1- Wk 4.pdf
CACJapan - GROUP Presentation 1- Wk 4.pdfCACJapan - GROUP Presentation 1- Wk 4.pdf
CACJapan - GROUP Presentation 1- Wk 4.pdf
 
1.4 modern child centered education - mahatma gandhi-2.pptx
1.4 modern child centered education - mahatma gandhi-2.pptx1.4 modern child centered education - mahatma gandhi-2.pptx
1.4 modern child centered education - mahatma gandhi-2.pptx
 
Marketing internship report file for MBA
Marketing internship report file for MBAMarketing internship report file for MBA
Marketing internship report file for MBA
 
Welcome to TechSoup New Member Orientation and Q&A (May 2024).pdf
Welcome to TechSoup   New Member Orientation and Q&A (May 2024).pdfWelcome to TechSoup   New Member Orientation and Q&A (May 2024).pdf
Welcome to TechSoup New Member Orientation and Q&A (May 2024).pdf
 
The approach at University of Liverpool.pptx
The approach at University of Liverpool.pptxThe approach at University of Liverpool.pptx
The approach at University of Liverpool.pptx
 
STRAND 3 HYGIENIC PRACTICES.pptx GRADE 7 CBC
STRAND 3 HYGIENIC PRACTICES.pptx GRADE 7 CBCSTRAND 3 HYGIENIC PRACTICES.pptx GRADE 7 CBC
STRAND 3 HYGIENIC PRACTICES.pptx GRADE 7 CBC
 
Unit 2- Research Aptitude (UGC NET Paper I).pdf
Unit 2- Research Aptitude (UGC NET Paper I).pdfUnit 2- Research Aptitude (UGC NET Paper I).pdf
Unit 2- Research Aptitude (UGC NET Paper I).pdf
 
Introduction to AI for Nonprofits with Tapp Network
Introduction to AI for Nonprofits with Tapp NetworkIntroduction to AI for Nonprofits with Tapp Network
Introduction to AI for Nonprofits with Tapp Network
 
special B.ed 2nd year old paper_20240531.pdf
special B.ed 2nd year old paper_20240531.pdfspecial B.ed 2nd year old paper_20240531.pdf
special B.ed 2nd year old paper_20240531.pdf
 
BÀI TẬP BỔ TRỢ TIẾNG ANH GLOBAL SUCCESS LỚP 3 - CẢ NĂM (CÓ FILE NGHE VÀ ĐÁP Á...
BÀI TẬP BỔ TRỢ TIẾNG ANH GLOBAL SUCCESS LỚP 3 - CẢ NĂM (CÓ FILE NGHE VÀ ĐÁP Á...BÀI TẬP BỔ TRỢ TIẾNG ANH GLOBAL SUCCESS LỚP 3 - CẢ NĂM (CÓ FILE NGHE VÀ ĐÁP Á...
BÀI TẬP BỔ TRỢ TIẾNG ANH GLOBAL SUCCESS LỚP 3 - CẢ NĂM (CÓ FILE NGHE VÀ ĐÁP Á...
 
Honest Reviews of Tim Han LMA Course Program.pptx
Honest Reviews of Tim Han LMA Course Program.pptxHonest Reviews of Tim Han LMA Course Program.pptx
Honest Reviews of Tim Han LMA Course Program.pptx
 
Francesca Gottschalk - How can education support child empowerment.pptx
Francesca Gottschalk - How can education support child empowerment.pptxFrancesca Gottschalk - How can education support child empowerment.pptx
Francesca Gottschalk - How can education support child empowerment.pptx
 
Unit 8 - Information and Communication Technology (Paper I).pdf
Unit 8 - Information and Communication Technology (Paper I).pdfUnit 8 - Information and Communication Technology (Paper I).pdf
Unit 8 - Information and Communication Technology (Paper I).pdf
 
How libraries can support authors with open access requirements for UKRI fund...
How libraries can support authors with open access requirements for UKRI fund...How libraries can support authors with open access requirements for UKRI fund...
How libraries can support authors with open access requirements for UKRI fund...
 
Best Digital Marketing Institute In NOIDA
Best Digital Marketing Institute In NOIDABest Digital Marketing Institute In NOIDA
Best Digital Marketing Institute In NOIDA
 

Mat 255 chapter 3 notes

  • 1. MAT 255 Business Statistics I Chapter 3 Describing Data: Numerical Measures Text: Lind, Statistical Techniques in Business and Economics, 15e
  • 2. Chapter 3 Objectives Objective Section Explain the concept of central tendency. 3.1 Identify and compute the arithmetic mean. 3.2, 3.3, 3.4 Compute and interpret the weighted mean. 3.5 Determine the median. 3.6 Identify the mode. 3.7 Describe the shape of a distribution based on the positions of the mean, median, and mode. 3.9 Calculate the geometric mean. 3.10 Explain and apply measures of dispersion. 3.11, 3.12 Explain Chebyshev’s Theorem and the empirical rule. 3.14 Compute the mean and standard deviation of grouped data. 3.15
  • 3. What should you do? Learning Activities Details Read Chapter 3. Pages 22 - 46 View the MAT 255 Chapter 3 Video Lecture Playlist and take notes as if you were in a lecture class. There are videos on the following topics: • Measures of Location Overview • Page 62, exercise 8 • Page 62, exercise 10 • Page 64, exercise 16 • Page 67, exercise 20 • The Relative Positions of the Mean, Median, and Mode • Page 73, exercise 28 • Page 74, exercise 32 • Measures of Dispersion Overview • Page 77, example • Page 79, exercise 38 • Page 82, exercise 46 • Page 85, exercise 50 • Page 87, exercise 54 • Page 87, exercise 56 • Page 91, exercise 58 Complete exercise 1 – 11 odd, 15 – 29 odd, 35, 39, 41, 47 – 55 odd 59, 61, 65, 69, 73, 75, 85. Complete homework for self-assessment purposes. The answers to odd questions are found in the back of the book. Complete the Chapter 3 Practice Worksheet and view the worked out solutions. The practice worksheet is for self-assessment purposes. You can view the worked out solutions to the worksheet after you complete it. Post a relevant comment, insight or question to the MAT 255-4H1 Fall 2014 Google+ Community. The Google+ Community allows you to communicate with classmates in an online open forum. Complete MAT 255 Chapter 3 Survey. Communicate to the instructor the areas where you still need help.
  • 4. Measures of Location Overview Text: Lind, Statistical Techniques in Business and Economics, 15e Delaware Technical Community College
  • 5. • The purpose of a measure of location is to pinpoint the center of a distribution of data. • In addition to measures of locations, we should consider the dispersion – often called the variation or spread – in the data. • Five measures of location: 1. The arithmetic mean 2. The weighted mean 3. The median 4. The mode 5. The geometric mean
  • 6. Population Mean: 𝝁 = 𝑿 𝑵 • 𝜇 represents the population mean. It is the Greek lower case letter “mu.” • 𝑁 is the number of values in the population. • 𝑋 represents any particular value. • is the Greek capital letter “sigma” and indicates the operation of adding. • 𝑋 is the sum of the 𝑋 values in a population. A parameter is a characteristic of a population.
  • 7. Sample Mean: 𝑿 = 𝑿 𝒏 • 𝑋 represents the sample mean. It is read “X bar.” • 𝑛 is the number of values in the sample. • 𝑋 represents any particular value. • is the Greek capital letter “sigma” and indicates the operation of adding. • 𝑋 is the sum of the 𝑋 values in a population. A statistic is a characteristic of a sample.
  • 8. Important properties of the arithmetic mean: 1. Every set of interval- or ratio- level has a mean. 2. All the values are included in computing the mean. 3. The mean is unique. 4. The sum of the deviations of each value from the mean is 0. 𝑋 − 𝑋 = 0 One disadvantage: if one or two values are either extremely high or extremely low compared to the majority of the data, then the mean might not be an appropriate average to represent the data.
  • 9. Weighted Mean: 𝑿 𝒘 = 𝒘 𝟏 𝑿 𝟏+𝒘 𝟐 𝑿 𝟐+𝒘 𝟑 𝑿 𝟑+⋯+𝒘 𝒏 𝑿 𝒏 𝒘 𝟏+𝒘 𝟐+𝒘 𝟑+⋯𝒘 𝒏 Pronounced “X bar sub w” Or 𝑿 𝒘 = 𝒘𝑿 𝒘
  • 10. Median: The midpoint of the values after they have been ordered from the smallest to the largest, or the largest to the smallest. The median is not affected by extremely large of small values. The median can be computed for ordinal-level data or higher.
  • 11. Mode: The value of the observation that appears most frequently. The mode is especially useful in summarizing nominal- level data. The mode can be determined for all levels of data – nominal, ordinal, interval, and ratio. The mode is not affected by extremely high or low values. For many data sets, though, there is no mode, causing it to be used less often than the mean and median. There can be one mode, multiple modes, or no mode for a set of dat.
  • 12. Page 62, exercise 8 Text: Lind, Statistical Techniques in Business and Economics, 15e Delaware Technical Community College
  • 13. Page 62, exercise 8: The accounting department at a mail-order company counted the following numbers of incoming calls per day to the company’s toll-free number during the first 7 days in May: 14, 24, 19, 31, 36, 26, 17. a. Compute the arithmetic mean. b. Indicate whether it is a statistic or a parameter.
  • 14. Page 62, exercise 10 Text: Lind, Statistical Techniques in Business and Economics, 15e Delaware Technical Community College
  • 15. Page 62, exercise 10: The Human Relations Director at Ford began a study of the overtime hours in the Inspection Department. A sample of 15 showed they worked the following number of overtime hours last month: 13, 13, 12, 15, 7, 15, 5, 12, 6, 7, 12, 10, 9, 13, 12 a. Compute the arithmetic mean. b. Indicate whether it is a statistic or a parameter.
  • 16. Page 64, exercise 16 Text: Lind, Statistical Techniques in Business and Economics, 15e Delaware Technical Community College
  • 17. Page 64, exercise 16: Andrews and Associates specializes in corporate law. They charge $100 an hour for researching a case, $75 an hour for consultations, and $200 an hour for writing a brief. Last week one of the associates spent 10 hours consulting with her client, 10 hours researching the case, and 20 hours writing the brief. What was the weighted mean hourly charge for her legal services?
  • 18. Page 67, exercise 20 Text: Lind, Statistical Techniques in Business and Economics, 15e Delaware Technical Community College
  • 19. Page 67, exercise 20: The following are the ages of the 10 people in the video arcade at the Southwyck Shopping Mall at 10 A.M. 12, 8, 17, 6, 11, 14, 8, 17, 10, 8 Determine the median age. Determine the mode.
  • 20. The Relative Positions of the Mean, Median, and Mode Text: Lind, Statistical Techniques in Business and Economics, 15e Delaware Technical Community College
  • 21. The Relative Positions of the Mean, Median, and Mode A histogram is a graphical display of a frequency distribution for quantitative data. That distribution can take various shapes. Here we will discuss characteristics for a symmetric distribution, a positively skewed distribution, and a negatively skewed distribution.
  • 22. A Symmetric Distribution 0 0.5 1 1.5 2 2.5 3 3.5 4 4.5 0 up to 5 5 up to 10 10 up to 15 15 up to 20 20 up to 25 25 up to 30 30 up to 35
  • 23. A Positively Skewed Distribution 0 1 2 3 4 5 6 7 8 9 0 up to 5 5 up to 10 10 up to 15 15 up to 20 20 up to 25 25 up to 30 30 up to 35
  • 24. A Negatively Skewed Distribution 0 1 2 3 4 5 6 7 8 9 0 up to 5 5 up to 10 10 up to 15 15 up to 20 20 up to 25 25 up to 30 30 up to 35
  • 25. Page 73, exercise 28 Text: Lind, Statistical Techniques in Business and Economics, 15e Delaware Technical Community College
  • 26. Page 73, exercise 28: Compute the geometric mean of the following percent increases: 2, 8, 6, 4, 10, 6, 8
  • 27. Geometric Mean: 𝐺𝑀 = 𝑛 𝑋1 𝑋2 ⋯ 𝑋 𝑛 The geometric mean is useful in finding the average change of percentages, ratios, indexes, or growth rates over time. The geometric mean will always be less than or equal to the arithmetic mean.
  • 28. Page 74, exercise 32 Text: Lind, Statistical Techniques in Business and Economics, 15e Delaware Technical Community College
  • 29. Page 74, exercise 32: JetBlue Airways is an American low-cost airline headquartered in New York City. Its main base is John F. Kennedy International Airport. JetBlue’s revenue in 2002 was $635.2 million. By 2009, revenue had increased to $3,290.0 million. What was the geometric mean annual increase for the period?
  • 30. Rate of Increase Over Time: 𝐺𝑀 = 𝑛 Value at end of period Value at start of period − 1
  • 31. Measures of Dispersion Overview Text: Lind, Statistical Techniques in Business and Economics, 15e Delaware Technical Community College
  • 32. A measure of location only describes the center of data. You would also want to know about the variation (or dispersion) of the data as well in order to have a more complete picture. A small value for a measure of dispersion indicates that the data are clustered closely. The mean is therefore considered representative of the data. Conversely, a large measure of dispersion indicates that he mean is not reliable. Comparing the measures of dispersions of multiple distributions is also helpful.
  • 33. Range: The difference between the largest and the smallest values in a data set. Range = Largest Value – Smallest Value
  • 34. Mean Deviation: The arithmetic mean of the absolute values of the deviations from the arithmetic mean. It measures the mean amount by which the values in a population, or sample vary from their mean. Mean Deviation: 𝑴𝑫 = 𝑿− 𝑿 𝒏
  • 35. Variance: The arithmetic mean of the squared deviations from the mean. Population Variance: 𝝈 𝟐 = 𝑿−𝝁 𝟐 𝑵 Read as “sigma squared” Standard Deviation: The square root of the variance. Population Standard Deviation: 𝛔 = 𝑿−𝝁 𝟐 𝑵
  • 36. Sample Variance: 𝒔 𝟐 = 𝑿− 𝑿 𝟐 𝒏−𝟏 Sample Standard Deviation: 𝒔 = 𝑿− 𝑿 𝟐 𝒏−𝟏 Although the use of 𝑛 is logical since 𝑋 is used to estimate 𝜇, it tends to underestimate the population variance, 𝜎2. The use of 𝑛 − 1 in the denominator provides the appropriate correction for this tendency. Because the primary use of the sample statistic 𝑠2 is to estimate population parameters like 𝜎2, 𝑛 − 1 is preferred to 𝑛 in defining the sample variance. This convention is also used when computing the sample standard deviation.
  • 37. The variance and standard deviation are also based on the deviations from the mean. However, instead of using the absolute value of the deviations, the variance and the standard deviation square the deviations.
  • 38. Page 77, example Text: Lind, Statistical Techniques in Business and Economics, 15e Delaware Technical Community College
  • 39. Page 77, example: The chart below shows the number of cappuccinos sold at Starbucks in the Orange County airport and the Ontario, California, airport between 4 and 5 P.M. for a sample of five days last month. Determine the mean, median, range, and mean deviation for each location. Comment on the similarities and differences in these measures. Orange County Ontario 20 20 40 49 50 50 60 51 80 80
  • 40. Page 79, exercise 38 Text: Lind, Statistical Techniques in Business and Economics, 15e Delaware Technical Community College
  • 41. Page 79, exercise 38: A sample of eight companies in the aerospace industry was surveyed as to their return on investment last year. The results are (in percent): 10.6, 12.6, 14.8, 18.2, 12.0, 14.8, 12.2, and 15.6 Calculate the range, arithmetic mean, mean deviation, and interpret the values.
  • 42. Page 82, exercise 46 Text: Lind, Statistical Techniques in Business and Economics, 15e Delaware Technical Community College
  • 43. Page 82, exercise 46: The annual incomes of the five vice presidents of TMV industries are $125,000; $128,000; $122,000; $133,000; and $140,000. Consider this population. a. What is the range? b. What is the arithmetic mean? c. What is the population variance? The standard deviation? d. The annual incomes of officers of another firm similar to TMV industries were also studied. The mean was $129,000 and the standard deviation $8,612. Compare the means and dispersions in the two firms.
  • 44. Page 85, exercise 50 Text: Lind, Statistical Techniques in Business and Economics, 15e Delaware Technical Community College
  • 45. Page 85, exercise 50: Compute the sample variance and the sample standard deviation. The sample of eight companies in the aerospace industry was surveyed as to their return on investment last year. The results are: 10.6, 12.6, 14.8, 18.2, 12.0, 14.8, 12.2, and 15.6
  • 46. Page 87, exercise 54 Text: Lind, Statistical Techniques in Business and Economics, 15e Delaware Technical Community College
  • 47. Page 87, exercise 54: The mean income of a group of sample observations is $500; the standard deviation is $40. According to Chebyshev’s theorem, at least what percent of incomes will lie between $400 and $600.
  • 48. Chebyshev’s Theorem: For any set of observations (sample or population), the proportion of the values that lie within k standard deviations of the mean is at least 𝟏 − 𝟏 𝒌 𝟐, where k is any constant greater than 1.
  • 49. Page 87, exercise 56 Text: Lind, Statistical Techniques in Business and Economics, 15e Delaware Technical Community College
  • 50. Page 87, exercise 56: The distribution of a sample of the number of drinks sold per day at a nearby Wendy’s is symmetric and bell-shaped. The mean number of drinks sold per day is 91.9 with a standard deviation of 4.67. Using the empirical rule, sales will be between what two values on 68 percent of the days? Sales will be between what two values on 95 percent of the days?
  • 51. Empirical Rule: For a symmetrical, bell-shaped frequency distribution, approximately 68 percent of the observations will lie within plus and minus one standard deviation of the mean; about 95 percent of the observations will lie within plus and minus two standard deviations of the mean; and 99.7 percent will lie within plus or minus three standard deviations of the mean.
  • 53. Page 91, exercise 58 Text: Lind, Statistical Techniques in Business and Economics, 15e Delaware Technical Community College
  • 54. Page 91, exercise 58: Determine the mean and standard deviation of the following frequency distribution. Class Frequency 0 up to 5 2 5 up to 10 7 10 up to 15 12 15 up to 20 6 20 up to 25 3
  • 55. Arithmetic Mean of Grouped Data: 𝑿 = 𝒇𝑴 𝒏
  • 56. Standard Deviation, Grouped Data: 𝒔 = 𝒇(𝑴 − 𝑿) 𝟐 𝒏 − 𝟏