TIL/T&P Masterclass presentation by Thomas Schreiter on his PhD project in cooperation with Rotterdam Harbor Authority and about project management. December 2011.
When and where are bus express services justified?BRTCoE
Express bus services are more beneficial in corridors with:
- Increasing system demand
- Increasing trip lengths
- Increasing trip concentration
- Increasing dwell times
- Decreasing vehicle capacity
- Increasing critical arc loads
- Increasing value of travel time
- Decreasing value of waiting time
The researchers used a regression model to analyze 972 scenarios of express service provisions on bus corridors. The model showed that express services provide greater benefits with higher potential travel time savings, trip concentration, and overcrowding levels.
Traffic volume is a fundamental measure of traffic on a road system, measured as the number of vehicles crossing a section of road per unit time. It is used for various purposes like planning, design, and traffic management. There are manual and automatic methods to count traffic volume. Manual methods involve field observers counting and classifying vehicles in different time intervals, while automatic methods use technologies like pneumatic tubes buried in roads, inductive loops in pavements, and radar to detect vehicle presence and count traffic volume without human observers. The collected data is then analyzed to produce traffic flow maps, intersection diagrams, and trend charts to understand traffic patterns and inform transportation planning.
This document discusses various topics related to traffic engineering including:
1. Definitions of traffic volume, average annual daily traffic, travel time, running speed, and journey speed.
2. Methods for traffic studies and analysis such as spot speed studies, cumulative speed distribution curves, and origin-destination studies.
3. Factors that influence traffic capacity such as traffic volume, density, speed, space headway, and time headway.
4. Traffic control devices including traffic signals, signs, road markings, and designs of traffic signals and parking layouts.
5. Accident analysis methods for different collision types at intersections and between moving and stationary objects.
This document discusses traffic flow fundamentals, including different types of traffic flow and key variables used to describe traffic flow. It covers uninterrupted and interrupted flow, and variables such as flow rate, speed, density, time headway, spacing, and time occupancy. Empirical relationships between flow, speed, and density are presented, including the Greenshields speed-density model and equations relating volume to density. Examples are provided to demonstrate calculations for various traffic flow measures.
The document analyzes bus route performance in Visakhapatnam, India. It surveyed 5 key routes, recording passenger volumes, loads, and headways. It found demand exceeds supply during peaks. Route 222 carries the fewest passengers per km. Route 20A carries the most. Loads exceed capacity on many trips, especially for routes 28 and 60C. Headways are most consistent in non-peak periods. The analysis recommends improving schedules, adding buses during peaks, developing transfer points, and using technology to better monitor operations and match supply to dynamic demand.
TRAFFIC IMPROVEMENTS FOR SMOOTH MOVEMENT OF TRAFFIC FLOWAbdul Aziz
This document discusses traffic volume studies and the capacity of rotaries. It begins with an introduction to traffic volume studies, explaining that they are conducted to determine the volume of traffic on roads and classify vehicles. Traffic volume studies are useful for understanding traffic magnitudes, classifications, directional splits, and hourly/daily variations. The document then discusses the capacity of rotaries, noting that it is determined by the capacity of each weaving section. Rotaries convert major intersection conflicts into milder merging and diverging conflicts. The key uses of rotaries are also summarized.
Spot speed studies are used to determine the speed
distribution of a traffic stream at a specific location. I The data gathered in spot speed studies are used to determine vehicle speed percentiles, which are useful in making many speed-related decisions
This document discusses traffic signal coordination, which aims to manage streets and signal systems more efficiently through techniques that improve safety, economic vitality, and quality of life. Effective signal coordination reduces congestion and vehicle emissions while saving time. Key factors in coordination include cycle length, green splits, phase sequence, and offsets between intersections. The concept of bandwidth, or the amount of green time for progression, is also explained. While coordination provides benefits, some exceptions exist like busy intersections in less congested areas. New concepts in actuated signal coordination involve background cycle lengths, yield points, sync phases, and force off points.
The document summarizes a study conducted by the Westchester County Department of Public Works to optimize traffic signal timing across 28 municipalities through signal retiming. Signal retiming aims to improve traffic flow and reduce emissions by analyzing existing traffic patterns and signal infrastructure. The study collected data from over 600 intersections, analyzed current conditions and potential timing/coordination improvements. It estimated user delay cost savings of $108 million could result from improved signal timing without upgrades. Municipalities then applied for funding to implement recommended timing plans and signal upgrades identified in the study.
1. The document discusses various methods for conducting traffic volume studies, including manual counts, mechanical counters, and automatic counts.
2. Manual counts involve people standing at the roadside and recording vehicle information on tally sheets or mechanical/electronic counting boards.
3. Automatic counts use sensors like pneumatic tubes, inductive loops, weigh-in-motion scales, radar detectors, and video cameras to collect traffic data without human observation.
This document defines key traffic stream parameters and discusses their relationships. It introduces parameters like volume, speed, density, peak hour factor, and daily volumes. Volume is the number of vehicles passing a point in a given time. Speed can be measured as time mean speed or space mean speed. Density refers to the number of vehicles occupying a roadway section. Traffic flow involves variability over time and space. Traffic streams on uninterrupted and interrupted facilities differ in how they are impacted by external factors.
This document discusses signal coordination between intersections. It defines key terms like offset, bandwidth, and cycle length that are important for progression. The document explains that signals less than a mile apart should be coordinated to allow vehicles to move efficiently through multiple intersections. A time-space diagram is used to visualize the offset between green lights. The ideal offset is calculated as the time needed for a vehicle to travel between signals. Coordinating multiple arterial roads requires analyzing each road separately and adjusting offsets so that progression can be achieved on both roads simultaneously. Examples are provided to demonstrate how to calculate offsets between intersecting arterial roads.
This document discusses different types of traffic speed studies including spot speed studies, travel time studies, and speed delay studies. It then provides details on specific objectives, scope, and methods of conducting traffic speed studies. The document presents data from a traffic speed study conducted at two intersections in Dhaka, including spot speeds, histograms, frequency and cumulative frequency curves. It analyzes the data to determine weighted average speed, pace, modal speed and compares time mean speed to space mean speed based on the Wardrop relationship. Finally, it calculates delay time, value of travel time and vehicle operating costs.
This document summarizes a presentation on dynamic lane guidance. It discusses using intelligent transport systems for cooperation and automation through tactical driving advice provided to vehicles. This could involve providing speed, headway and lane use advice to vehicles based on real-time traffic state estimation integrating data from vehicles, roadside infrastructure and traffic management centers. The presentation examines requirements and challenges for achieving lane-level positioning accuracy needed for such advice, and shows simulation results of dynamic lane guidance systems reducing travel time delays on highways by influencing traffic flow dynamics.
9-Traffic Volume ( Transportation and Traffic Engineering Dr. Sheriff El-Bada...Hossam Shafiq I
The document discusses traffic volume design concepts. It defines terms like average daily traffic (ADT), annual average daily traffic (AADT), and design hourly volume (DHV) which is the traffic volume used for design calculations and is typically between the 10th and 50th highest hourly volume of the year. It also discusses factors like peak hour factor (PHF) and directional distribution factor (D) used to determine directional design-hour volume (DDHV). The document discusses different methods of conducting traffic volume counts, both manual methods using boards and automatic methods using vehicle counters. It also discusses how to present traffic volume data through maps, tables and graphs showing daily, hourly and classification variations.
GreenSwirl: Combining Traffic Signal Control and Route Guidance for Reducing ...Naoki Shibata
Jiaxing Xu, Weihua Sun, Naoki Shibata and Minoru Ito : "GreenSwirl: Combining Traffic Signal Control and Route Guidance for Reducing Traffic Congestion," in Proc. of IEEE Vehicular Networking Conference 2014 (IEEE VNC 2014), pp. 179-186.
Serious traffic congestion is a major social problem in large cities. Inefficient setting of traffic signal cycles, especially, is one of the main causes of congestion. GreenWave is a method for controlling traffic signals which allows one-way traffic to pass through a series of intersections without being stopped by a red light. GreenWave was tested in several cities around the world, but the results were not satisfactory. Two of the problems with GreenWave are that it still stops the crossing traffic, and it forms congestion in the traffic turning into or out of the crossing streets. To solve these problems, we propose a method of controlling traffic signals, GreenSwirl, in combination with a route guidance method, GreenDrive. GreenSwirl controls traffic signals to enable a smooth flow of traffic through signals times to turn green in succession and through non-stop circular routes through the city. The GreenWave technology is extended thereby. We also use navigation systems to optimize the overall control of the city's traffic. We did a simulation using the traffic simulator SUMO and the road network of Manhattan Island in New York. We confirmed that our method shortens the average travel time by 10%-60%, even when not all cars on the road are equipped to use this system.
This document discusses various methods for conducting traffic volume studies. It describes key parameters like volume, rate of flow, demand, and capacity. It explains the purpose of volume studies for transportation planning, operations analysis, and impact assessments. Different study types are outlined, including intersection counts, cordon counts, screenline counts, and origin-destination studies. Methods for adjusting raw counts and estimating annual average daily traffic are also summarized.
LTC, Annual Forum, The Direction of Technology in Transportation, 05/13/2011,...LTC @ CSUSB
This document summarizes research on using intelligent transportation system (ITS) technologies to improve transportation efficiency, safety, and reduce emissions. Key points discussed include:
- Collecting real-time traffic and vehicle data through probe vehicles and sensors to analyze congestion and inform drivers.
- Developing dynamic eco-driving systems to provide drivers with real-time feedback on speed and routing to reduce fuel use and emissions.
- Exploring using signal timing data and vehicle coordination to optimize vehicle speeds on arterial roads and reduce wasted fuel at intersections.
- Creating eco-routing navigation tools to recommend routes minimizing energy use or emissions, not just time or distance.
This document provides information about a study conducted on the Mevad Toll Plaza located on the Mehsana-Ahmedabad Highway in Gujarat, India. The study involved collecting classified volume count data, service time data for different vehicle types, and conducting a user survey. The data was analyzed to determine peak traffic hours and the average service times. It was found that the average service time at the manual toll plaza was around 25 seconds per vehicle, much higher than the 4-5 seconds per vehicle achieved at electronic toll collection plazas. The results of the study can be used to identify opportunities to reduce congestion and delays at the toll plaza.
(1) The document reports on a study to determine the spot speed of vehicles on a section of the Maitighar-Tinkune Road in Nepal.
(2) Data on vehicle speeds was collected manually over the 54m section, with over 290 vehicles observed.
(3) Analysis found the 85th percentile speed (the speed at which 85% of vehicles travel at or below) to be 44kmph, while the 50th percentile speed was 37kmph.
7-Traffic-Introduction ( Transportation and Traffic Engineering Dr. Sheriff E...Hossam Shafiq I
This document discusses key concepts in traffic engineering. It begins by defining traffic engineering as the branch of civil engineering dealing with the safe and efficient movement of people and goods using roads. It then outlines some basic components of traffic engineering like road users, vehicles, roads/highways, and control devices. The majority of the document defines and explains important traffic flow parameters like speed, volume, density, spacing, headway, clearance, gap, and lane occupancy. It provides equations relating parameters and discusses units of measurement. The document aims to introduce foundational traffic engineering concepts.
Capacity & Level of Service: Highways & Signalized Intersections (Indo-HCM)Vijai Krishnan V
The document discusses capacity and level of service analysis for highways and signalized intersections using the Indian Highway Capacity Manual (Indo-HCM) methodology. It provides an overview of the Indo-HCM framework, compares it to the US Highway Capacity Manual, and presents step-by-step calculations for determining the capacity and level of service of highways using the Indo-HCM approach. A sample problem is also included to demonstrate the application of the Indo-HCM methodology.
In many countries, cities are expanding in terms of size, number residents and visitors, etc. The resulting increase in concentration of people, with their mobility needs, causes major traffic and transportation problems in and around our cities. Next to the economic impacts due to delay and unreliability of travel time, concerns regarding safety and security, emissions and sustainability become more and more urgent.
ITS (Intelligent Transportation Systems) hold the potential to reduce these issues. In the past decade, we have been more and more successful in making better use of the available infrastructure by using traditional ITS measures. As we will show in this talk, key to this success has been in achieving a profound understanding of what are the key phenomena that characterise network traffic flows, and designing solutions that capitalise on this.
The playing field is however rapidly changing. For one, we see a transition from road-side to in-car technology in terms of sensing and actuation. This provides great opportunities, but making best use of these is not trivial and requires a paradigm shift in the way we think about managing traffic flows where collaboration between the old stakeholders (e.g. road authorities) and the new stakeholders (e.g. companies like Google, and TomTom) becomes increasingly important. This will be illustrated in this talk by some examples showing how we can put the transition to in-car traffic management to use, both in terms of making optimal use of the new data sources and the use of the car as an actuator.
With respect to the latter, we will see that even for low penetration levels, which will occur in the transition phase towards a more highly automated traffic stream, considerable impacts can be achieved if we adequately consider the non-automated vehicles. Furthermore, it requires vehicles to be able to communicate and cooperate with each other.
These two elements are two of the five steps that was identified in the transition towards a fully automated system.
The final part of the talk will deal with the other steps that are deemed important to understand which of the scenarios in a urban self-driving future will unfold. These pertain to the interaction between man and machine, the need and willingness to invest in separate infrastructure in city, and whether automated car can co-exist with other (active) travel modes. With respect to the latter, we will also consider what ITS can mean for the other modes of travel.
Wherecamp Navigation Conference 2015 - The unintelligent swarmWhereCampBerlin
1) The document discusses how traffic routing oscillations can occur when a high percentage of drivers receive real-time traffic information from the same provider and choose routes based on that information.
2) Microsimulations of a worst-case scenario showed that when all drivers on the network received the same estimated travel times, it led to unstable routing patterns as traffic levels on different roads continually fluctuated.
3) To overcome these instabilities, the document recommends using stochastic route choice models that incorporate an element of uncertainty into individual routing decisions, helping to distribute traffic more evenly across the network.
Metro systems are mass rapid transit systems that are well-suited for large, dense cities experiencing high traffic congestion. Metros can be conventional, subway, or elevated. They operate on DC motors to efficiently move large numbers of passengers between stations. Key factors in deciding to build a metro include high peak traffic, passenger density, and forecasted demand. Metros have technical features like platform doors, fare cards, passenger information, and air-conditioned trains. They provide efficient, eco-friendly transportation at scheduled fares based on distance. Metros boost economic growth while reducing congestion and pollution. Careful planning is needed for such large infrastructure projects.
In deze lezing worden recent afgeronde TRAIL proefschriften besproken, met focus op de relevantie voor de praktijk. We bespreken recente ontwikkeling in verkeersmanagement en coöperatieve systemen, crowd- en evacuatiemanagement en transport security. We bespreken ook kort de verschuiving van de focus binnen de leerstoel Traffic Operations and Management.
How can we make traffic flow better so fewer of us are sitting in traffic jams for shorter periods of time – if at all?
Researcher Lina Kattan looks at Intelligent Traffic Systems that optimize the operation, safety and costs of a city’s transportation network through sustainable traffic control and transportation management strategies. These systems are designed to manage traffic congestion, signal controls and prediction of bus and LRT arrivals.
Read on to learn about solutions that are working and how new developments will change the traffic jigsaw in the not-to-distant future.
You can also see the full webinar recording at: http://www.ucalgary.ca/explore/can-we-make-traffic-jams-obsolete
The document discusses approaches to managing mobility through integrated corridor management (ICM) and active traffic management (ATM). ICM aims to maximize total person throughput in a corridor by providing integrated travel options across modes. ATM uses technologies like variable speed limits and lane controls to reduce congestion. When combined in a corridor, ICM and ATM strategies like real-time traveler information, traffic signal priority for transit, and parking guidance can encourage alternative transportation usage.
Traffic volume studies collect data on the number of vehicles and pedestrians passing a point on a roadway over a period of time. This data is used for planning, design, and operations purposes. There are manual and automatic methods for conducting these studies. Manual methods involve human counters while automatic methods use sensors. The data collected is used to determine metrics like average daily traffic, peak hour volumes, and directional distribution which are then used for roadway design and traffic management.
The document summarizes challenges faced by the San Francisco Municipal Transportation Agency (SFMTA) in operating reliable public transit. It outlines SFMTA's transit networks and policies to promote reliability. SFMTA aims to analyze automatic vehicle location and passenger counter data to determine if new projects and policies have achieved the goals of more reliable and faster transit service. The agency is looking for data visualizations that provide insights into service levels, ridership patterns, traffic interactions, and the benefits of specific transit projects.
EDF2014: Ralf-Peter Schaefer, Head of Traffic Product Unit, TomTom, Germany: ...European Data Forum
Industry Keynote Talk by Ralf-Peter Schaefer, Head of Traffic Product Unit, TomTom, Germany at the European Data Forum 2014, 20 March 2014 in Athens, Greece: Probe Data Analytics and Processing for Traffic Information, Traffic Planning and Traffic Management.
PROPOSED INTELLIGENT TRANSPORT SYSTEM DEPLOYMENTS IN KAJANG CITY664601
This document discusses the proposed implementation of an Intelligent Transportation System (ITS) in Kajang, Malaysia to address traffic congestion issues. It outlines the study methodology, including manual traffic counts at three intersections. It analyzes the traffic flow data to determine saturation flow rates and optimal cycle times. The document then provides an overview of the overall ITS architecture, including the logical and physical architecture layers and components. These include adaptive traffic control systems, surveillance cameras, variable message signs, and communication systems. The goal of the proposed ITS is to streamline traffic flow and reduce travel times in Kajang.
The document summarizes a study analyzing road network data collected by Bluetooth passive sensors in Greater Manchester. It outlines objectives to understand traffic behavior and resilience from journey time data. It describes how Bluetooth sensors identify vehicle MAC IDs to record journey times. The study area and analysis of sensitivity to accidents and their effect on travel times, mobility and network resilience is discussed. Potential for integrating Bluetooth and WiFi technologies and applications for traffic and transport analysis are also mentioned.
Public transport systems can be improved by focusing on customer needs rather than technology or existing operators. The most effective systems prioritize public transport, integrate different modes, and plan frequent services on a full network. While metro and heavy rail require large subsidies, bus rapid transit (BRT) provides high capacity at a fraction of the cost, constructing over 400km of BRT for the price of 7km of subway. BRT is also faster to implement, requiring under 18 months compared to over 5 years for metros.
The document describes a double layer ramp metering model based on adaptive neural networking. The lower model uses a backpropagation neural network to identify where traffic incident congestion occurs on an expressway. It outputs the congested section number and ramps needing control. The upper model then designs the ramp metering strategy to control ramp entry rates and optimize traffic flow. A case study showed this adaptive approach improved traffic flow over fixed-time ramp metering.
This document summarizes a presentation about analyzing passenger data to understand passenger choice in boarding metro cars. It discusses using loadweight data from London Underground trains to analyze which cars passengers board at different stations. The analysis finds that approximately 55% of passengers make boarding choices based on their destination station, aiming to board cars closer to exits, while the other 45% base choices on boarding the car nearest their point of entrance. The document advocates developing frameworks to systematically analyze data and create value from understanding passenger behavior.
CBTC Communications Based Train Control conference March 12th 2014 James Nesbitt
Transport industry leaders create a common voice on critical Communications Based Train Control challenges and solutions on March12th 2014 in London. Addressing implementation, cost and maintenance, risk assessments and interoperability challenges from an engineering, technical and strategic planning perspective, you wont want to miss this highly informative networking opportunity
This document discusses Transperth's plans to implement intelligent transport systems including real-time tracking of buses, traffic signal priority, and dynamic stand management at bus stations. These systems will work together to track bus locations, optimize traffic light cycles for buses, and efficiently manage bus stands. The goal is to provide real-time arrival predictions for passengers, improve operational management, and enhance overall service performance. Transperth has conducted trials of these systems and plans to roll them out fleet-wide by 2016 to benefit passengers and operations.
This document summarizes and compares three reactive algorithms for controlling variable speed limits:
1. Mainstream Traffic Flow Control aims to maximize throughput and avoid congestion by finding the critical density and lowering speed limits to control inflow.
2. Specialist algorithm uses shockwave theory to identify traffic states, predict their evolution, and resolve shockwaves with suitable speed limits.
3. Reducing Crash Potential algorithm uses a log-linear model to set thresholds for lowering speed based on crash potential, which is calculated from crash precursors and external factors.
The document discusses modeling congestion in traffic simulation and presents preliminary results showing Mainstream Traffic Flow Control improves congestion and mean speed over the base case. Further
The document discusses the educational and career path of Odile De Vito after graduating with degrees in technology policy management and transport planning. It outlines her study background which included a bachelor's, master's and internships focused on transportation and traffic simulation. After graduating, she participated in various job orientation activities and chose to join KPN's young potential program, where she has worked across different functions and projects over three years while receiving mentorship and training opportunities. Overall, she has found the job very positive for development but notes the need to be proactive in a large organization.
Literature Surveys: A Methodological Approachflmkessels
This document outlines the steps for conducting a literature survey in a methodological way. It discusses establishing a clear problem description by identifying the problem, research questions, and objectives. It also covers developing a search plan with keywords, potential sources, and an execution process. Finally, it addresses reporting the results by transforming summaries from a text plan into a structured written report with critical interpretation. The overall goal is to provide guidance for systematically planning and conducting a literature survey to answer a research question.
Presentation by Mark Veenstra in the TIL/T&P Masterclass on 16 May2012. MSc research on the effect of traffic measures and the theme "Help I've got a supervisor."
Calvert, Do ‘normal’ traffic conditions really exist? Why modelling variation...flmkessels
Presentation by Simeon Calvert in Masterclass on 16 May 2012 on his phd research on probabilistic traffic flow models and "Help I've got a supervisor".
The document outlines the program for a masterclass on choosing a graduation project. It includes presentations from PhD and MSc students on their projects involving 3D virtual environments for data collection during disasters, pedestrian congestion modeling, and an educational lab for transport research. The goals of the masterclass are to support students in their graduation projects and involve them in the research of the Transport and Planning group. Previous masterclass topics are mentioned and future topics are solicited for discussion. The event will conclude with drinks sponsored by the Transport and Planning group.
Projectmanagement in a consultancy environment; Gerard Martensflmkessels
This document discusses project management in a consultancy environment. It notes that while project management methods provide structure, complex situations require flexibility. Projects in a consultancy typically involve providing advice or expertise to answer a client's specific questions or achieve goals. Risks include consultants becoming distracted by curiosity and pursuing tangents, underestimating efforts needed, and problems arising with data or results. Regular communication and sticking to plans while maintaining flexibility can help manage risks. Overall the document emphasizes the importance of balancing structure with flexibility in project management for consultancy work.
This document discusses a master's thesis project. It provides background on the author's education and current thesis work designing a new methodology for Rijkswaterstaat based on existing Dynamic Traffic Management and Mobility Management methods. The document outlines the thesis work, including analyzing existing measures and methods, analyzing the reconnaissance study process, and developing a new methodology and toolkit. It also provides guidance on starting a thesis, including choosing a subject and location, selecting a graduation committee, and preparing for the initial kick-off meeting.
PhD research on evacuation optimization (Huibregtse)flmkessels
This document summarizes a PhD project that aims to optimize evacuation route instructions considering uncertainty and human compliance behavior. The project develops a more efficient computational method using a fixed-point approach that decomposes the complex optimization problem into simpler sub-problems involving route guidance optimization, traffic flow simulation, and an approximated behavior model. A case study applies the method to hypothetically evacuate 120,000 residents from a flood in Walcheren over 6 hours, showing the fixed-point approach maintains solution quality while substantially reducing computational time compared to an undecomposed approach.
A review of the growth of the Israel Genealogy Research Association Database Collection for the last 12 months. Our collection is now passed the 3 million mark and still growing. See which archives have contributed the most. See the different types of records we have, and which years have had records added. You can also see what we have for the future.
Introduction to AI for Nonprofits with Tapp NetworkTechSoup
Dive into the world of AI! Experts Jon Hill and Tareq Monaur will guide you through AI's role in enhancing nonprofit websites and basic marketing strategies, making it easy to understand and apply.
This slide is special for master students (MIBS & MIFB) in UUM. Also useful for readers who are interested in the topic of contemporary Islamic banking.
A Strategic Approach: GenAI in EducationPeter Windle
Artificial Intelligence (AI) technologies such as Generative AI, Image Generators and Large Language Models have had a dramatic impact on teaching, learning and assessment over the past 18 months. The most immediate threat AI posed was to Academic Integrity with Higher Education Institutes (HEIs) focusing their efforts on combating the use of GenAI in assessment. Guidelines were developed for staff and students, policies put in place too. Innovative educators have forged paths in the use of Generative AI for teaching, learning and assessments leading to pockets of transformation springing up across HEIs, often with little or no top-down guidance, support or direction.
This Gasta posits a strategic approach to integrating AI into HEIs to prepare staff, students and the curriculum for an evolving world and workplace. We will highlight the advantages of working with these technologies beyond the realm of teaching, learning and assessment by considering prompt engineering skills, industry impact, curriculum changes, and the need for staff upskilling. In contrast, not engaging strategically with Generative AI poses risks, including falling behind peers, missed opportunities and failing to ensure our graduates remain employable. The rapid evolution of AI technologies necessitates a proactive and strategic approach if we are to remain relevant.
हिंदी वर्णमाला पीपीटी, hindi alphabet PPT presentation, hindi varnamala PPT, Hindi Varnamala pdf, हिंदी स्वर, हिंदी व्यंजन, sikhiye hindi varnmala, dr. mulla adam ali, hindi language and literature, hindi alphabet with drawing, hindi alphabet pdf, hindi varnamala for childrens, hindi language, hindi varnamala practice for kids, https://www.drmullaadamali.com
How to Manage Your Lost Opportunities in Odoo 17 CRMCeline George
Odoo 17 CRM allows us to track why we lose sales opportunities with "Lost Reasons." This helps analyze our sales process and identify areas for improvement. Here's how to configure lost reasons in Odoo 17 CRM
How to Fix the Import Error in the Odoo 17Celine George
An import error occurs when a program fails to import a module or library, disrupting its execution. In languages like Python, this issue arises when the specified module cannot be found or accessed, hindering the program's functionality. Resolving import errors is crucial for maintaining smooth software operation and uninterrupted development processes.
বাংলাদেশের অর্থনৈতিক সমীক্ষা ২০২৪ [Bangladesh Economic Review 2024 Bangla.pdf] কম্পিউটার , ট্যাব ও স্মার্ট ফোন ভার্সন সহ সম্পূর্ণ বাংলা ই-বুক বা pdf বই " সুচিপত্র ...বুকমার্ক মেনু 🔖 ও হাইপার লিংক মেনু 📝👆 যুক্ত ..
আমাদের সবার জন্য খুব খুব গুরুত্বপূর্ণ একটি বই ..বিসিএস, ব্যাংক, ইউনিভার্সিটি ভর্তি ও যে কোন প্রতিযোগিতা মূলক পরীক্ষার জন্য এর খুব ইম্পরট্যান্ট একটি বিষয় ...তাছাড়া বাংলাদেশের সাম্প্রতিক যে কোন ডাটা বা তথ্য এই বইতে পাবেন ...
তাই একজন নাগরিক হিসাবে এই তথ্য গুলো আপনার জানা প্রয়োজন ...।
বিসিএস ও ব্যাংক এর লিখিত পরীক্ষা ...+এছাড়া মাধ্যমিক ও উচ্চমাধ্যমিকের স্টুডেন্টদের জন্য অনেক কাজে আসবে ...
How to Build a Module in Odoo 17 Using the Scaffold MethodCeline George
Odoo provides an option for creating a module by using a single line command. By using this command the user can make a whole structure of a module. It is very easy for a beginner to make a module. There is no need to make each file manually. This slide will show how to create a module using the scaffold method.
Dynamic Traffic Management: Class specific control at the A15; Thomas Schreiter
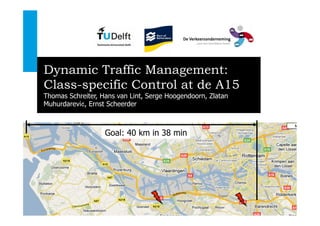
1. Dynamic Traffic Management:
Class-specific Control at de A15
Thomas Schreiter, Hans van Lint, Serge Hoogendoorn, Zlatan
Muhurdarević, Ernst Scheerder
Goal: 40 km in 38 min
Delft
University of
Technology
Challenge the future
2. A15 during evening peak
Delft
University of
Technology
Challenge the future
3. Class-specific Vehicle Length
• More jam ßà longer trucks (in relative terms)
• Worsening effect
• Person-car equivalent (pce) value
• Effective density = pce * density
• Dynamic, dependent on traffic state!
Thomas Schreiter: “Dynamisch Verkeersmanagement” 3/16
4. Truck percentage
• A lot more trucks than on other highways
Thomas Schreiter: “Dynamisch Verkeersmanagement” 4/16
5. Outline
• The model BOS HbR
• Control Loop
• 3 Components
• Examples of class-specific Control
• Conclusion
• Review
Thomas Schreiter: “Dynamisch Verkeersmanagement” 5/16
6. BOS HbR
Traffic System A15
Actuators
Sensors
Real-time Real-time Real-time
Control Prediction Estimation
BOS-HbR ( Beslissingsondersteunend Systeem voor het
Havenbedrijf Rotterdam )
Network Traffic model
∂ku ∂qu
+ =0
Goalfunction ∂t ∂x
Travel time <= 38min
Vehicle properties
Historic
inflows /
outflows
l = 20 m l=6m
vmax =85 km/u vmax =110 km/u
Thomas Schreiter: “Dynamisch Verkeersmanagement” 6/16
7. Estimation: traffic state now
• Given: induction loops
• Flow [veh/uur], Speed
• Every ~500 m and 60 sec
• Needed:
1. Density [vtg/km] every 100 m
• Apply filter Check
2. Traffic composition
• Historic microscopic loop data
5:30 8:00 10:30
Past now
Thomas Schreiter: “Dynamisch Verkeersmanagement” 7/16
8. Prediction:
traffic state during next 1 hour
• Traffic Flow Model: Fastlane
• Road segmented into cells of 100 m, time step 3 sec
• Density(t+1) = Density(t) + Inflow(t) – Outflow(t)
• Simulation of incidents
Incident
10%
Intensiteit
200 veh/h
Dichtheid
Inflow Fundamental Diagram Turnfraction
• Class-specific: trucks and cars
Thomas Schreiter: “Dynamisch Verkeersmanagement” 8/16
9. Prediction:
traffic state during next 1 hour
• Results Prediction
• Density, flow, speed
• Location of congestion
• Travel times
5:30 8:00 now Prediction 10:30
Past
Thomas Schreiter: “Dynamisch Verkeersmanagement” 9/16
10. Control: Optimization of Traffic
for each vehicle class
• Model predictive control (MPC)
• Predict effect of DTM measurement
• Choose best DTM measurement
• In realtime
• Example: class-specific route guidance during incident:
Thomas Schreiter: “Dynamisch Verkeersmanagement” 10/16
11. Class-specific Route Guidance
• Experiment with simple network
• à less total delay [veh*h]
• Possible Application for A15:
Thomas Schreiter: “Dynamisch Verkeersmanagement” 11/16
12. Class-specific Ramp Metering
• Prioritize trucks
à shorter travel time
trucks
à fewer spillback at
on-ramp
• Prioritize cars
à Less total delay
Thomas Schreiter: “Dynamisch Verkeersmanagement” 12/16
13. Possible locations for
class-specific ramp metering A15
Thomas Schreiter: “Dynamisch Verkeersmanagement” 13/16
14. Conclusion
Traffic System A15
Actuators
Sensors
Real-time Real-time Real-time
Control Prediction Estimation
BOS-HbR ( Beslissingsondersteunend Systeem voor het
Havenbedrijf Rotterdam )
• Dynamic Traffic Management
• Goal: improve traffic state during incidents
• By prediction of expected traffic situation
• Predict jam locations
• Class-specific control improves traffic state
Thomas Schreiter: “Dynamisch Verkeersmanagement” 14/16
15. My Review
Planning Reality
Estimation 1st year 1.5 years
Prediction 2nd year Still busy with
calibration
Control 3rd year Mid of 3rd to beginning
of 4th year
Dissertation 4th year start 3 months later
Thomas Schreiter: “Dynamisch Verkeersmanagement” 15/16
16. My Review
• Good
• Culture: open, freedom, honesty, relaxed
• Theory and application
• Exciting topic
• Helicopter flights J
• Tough
• Culture
• Dutch at TUD and sponsors
• Getting distracted by other interesting research topics
Thomas Schreiter: “Dynamisch Verkeersmanagement” 16/16
17. A15 haven-uit: bij Charlois
Delft
University of
Technology
Challenge the future
18. A.
Homepage met resultaten in realtime
www.regiolab-delft.nl/boshbr
Thomas Schreiter: “Dynamisch Verkeersmanagement” 18/16
19. www.regiolab-delft.nl/boshbr
• BOS-HbR op computer bij TU Delft
• Vlekkenkaarten
• Snelheid, intensiteit
• A15, beide richtingen
• Schatting, voorspelling
Thomas Schreiter: “Dynamisch Verkeersmanagement” 19/16
20. Space (30km) à
Screenshots –
Schatting
Current Speed
Time (4h) à
Space (30km) à
Current Flow
Thomas Schreiter: “Dynamisch Verkeersmanagement” 20/16
21. Space (30km) à
Screenshots –
Voorspelling
Time (1h) à
Current Speed
Space (30km) à
Current Flow Thomas Schreiter: “Dynamisch Verkeersmanagement” 21/16
25. Resultaten: Incident simulaties
• Voorbeeld: 26 jan 2011 om 16.10
• Herrouteren: Wat gebeurd, als het verkeer over het onderliggende wegennet
geherrouteerd wordt?
Thomas Schreiter: “Dynamisch Verkeersmanagement” 25/16