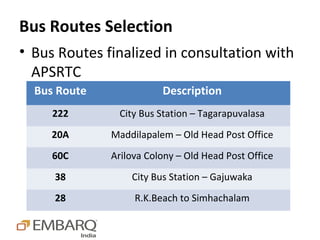
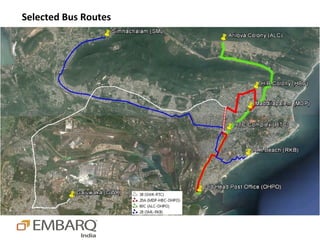
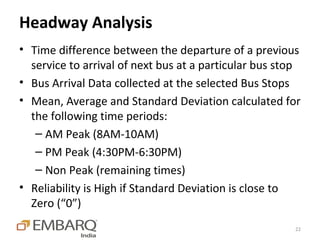
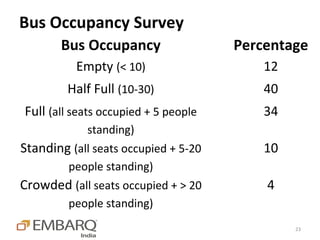
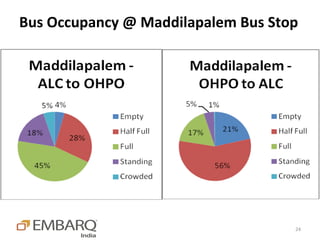
Download to read offline
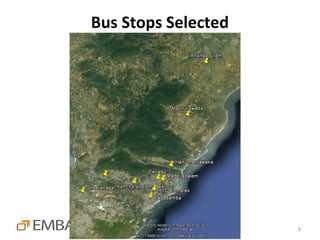
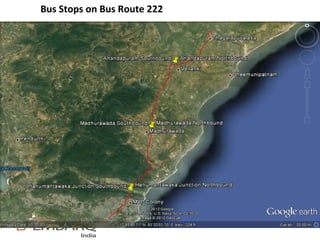
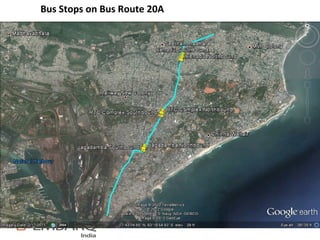
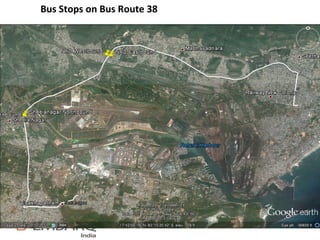
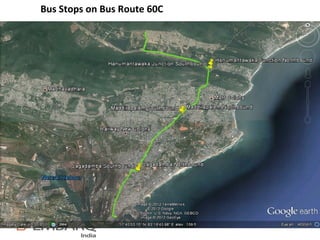
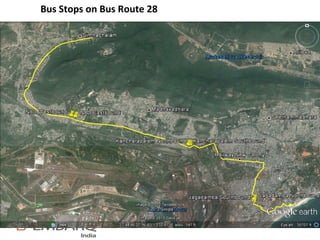
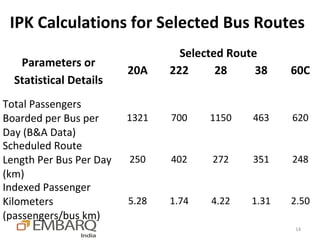

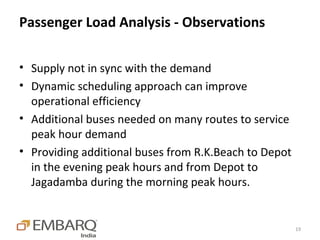
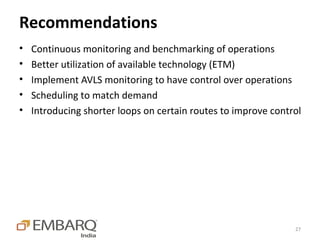


The document analyzes bus route performance in Visakhapatnam, India. It surveyed 5 key routes, recording passenger volumes, loads, and headways. It found demand exceeds supply during peaks. Route 222 carries the fewest passengers per km. Route 20A carries the most. Loads exceed capacity on many trips, especially for routes 28 and 60C. Headways are most consistent in non-peak periods. The analysis recommends improving schedules, adding buses during peaks, developing transfer points, and using technology to better monitor operations and match supply to dynamic demand.


