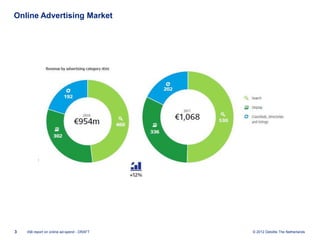
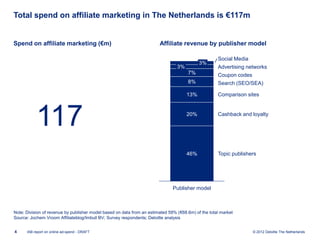
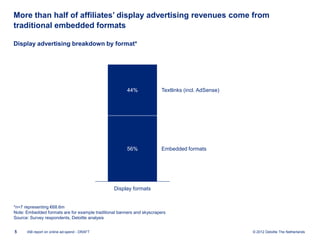
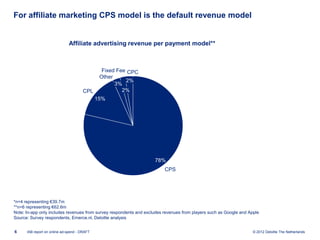
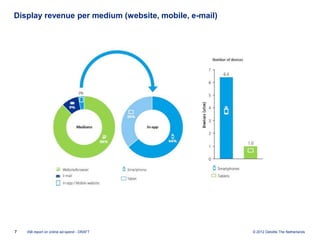
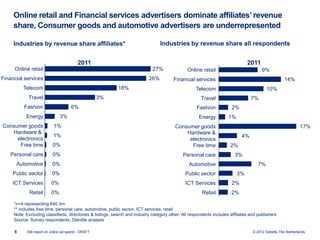
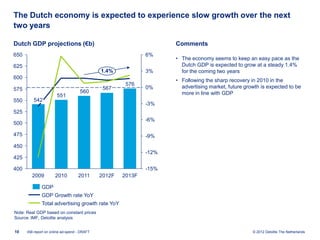
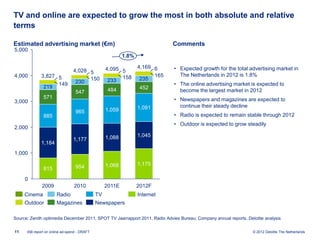
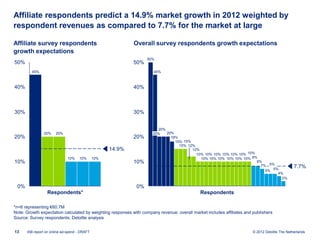
IAB report on online ad-spend
Affiliates results 2011
IAB Online Ad Spend Study


1   IAB report on online ad-spend - DRAFT   © 2012 Deloitte The Netherlands
2011 Results
Online Advertising Market


3   IAB report on online ad-spend - DRAFT   © 2012 Deloitte The Netherlands
Total spend on affiliate marketing in The Netherlands is €117m


Spend on affiliate marketing (€m)                                       Affiliate revenue by publisher model

                                                                                                     Social Media
                                                                                            3%
                                                                                 3%                  Advertising networks
                                                                                      7%             Coupon codes
                                                                                      8%             Search (SEO/SEA)

                                                                                      13%            Comparison sites


           117                                                                        20%            Cashback and loyalty


                                                                                      46%            Topic publishers


                                                                               Publisher model


Note: Division of revenue by publisher model based on data from an estimated 59% (€68.6m) of the total market
Source: Jochem Vroom Affiliateblog/Imbull BV; Survey respondents; Deloitte analysis


4     IAB report on online ad-spend - DRAFT                                                                         © 2012 Deloitte The Netherlands
More than half of affiliates’ display advertising revenues come from
traditional embedded formats

Display advertising breakdown by format*


                                                       44%              Textlinks (incl. AdSense)


                                                       56%              Embedded formats


                                                Display formats


*n=7 representing €68.6m
Note: Embedded formats are for example traditional banners and skyscrapers
Source: Survey respondents, Deloitte analysis


5     IAB report on online ad-spend - DRAFT                                                         © 2012 Deloitte The Netherlands
For affiliate marketing CPS model is the default revenue model


                              Affiliate advertising revenue per payment model**


                                                Fixed Fee CPC
                                               Other
                                                         2%
                                                     3%
                                       CPL              2%
                                              15%


                                                                    78%
                                                                         CPS


*n=4 representing €39.7m
**n=6 representing €62.6m
Note: In-app only includes revenues from survey respondents and excludes revenues from players such as Google and Apple
Source: Survey respondents, Emerce.nl, Deloitte analysis


6     IAB report on online ad-spend - DRAFT                                                                         © 2012 Deloitte The Netherlands
Display revenue per medium (website, mobile, e-mail)


7   IAB report on online ad-spend - DRAFT              © 2012 Deloitte The Netherlands
Online retail and Financial services advertisers dominate affiliates’ revenue
     share, Consumer goods and automotive advertisers are underrepresented

     Industries by revenue share affiliates*                                      Industries by revenue share all respondents


                                        2011                                                                                    2011
     Online retail                                                            27%               Online retail                           9%
Financial services                                                          26%          Financial services                                          14%
         Telecom                                            18%                                      Telecom                               10%
            Travel                                 13%                                                  Travel                    7%
          Fashion                    6%                                                              Fashion            2%
           Energy             3%                                                                      Energy          1%
Consumer goods            1%                                                              Consumer goods                                                       17%
   Hardware &                                                                                 Hardware &
                          1%                                                                                                 4%
     electronics                                                                               electronics
      Free time           0%                                                                    Free time              2%
    Personal care         0%                                                                  Personal care              3%
      Automotive         0%                                                                      Automotive                           7%
     Public sector       0%                                                                    Public sector               3%
     ICT Services        0%                                                                    ICT Services             2%
             Retail      0%                                                                             Retail          2%

     *n=4 representing €40.3m
     ** includes free time, personal care, automotive, public sector, ICT services, retail
     Note: Excluding classifieds, directories & listings, search and industry category other; All respondents includes affiliates and publishers
     Source: Survey respondents, Deloitte analysis

     8     IAB report on online ad-spend - DRAFT                                                                                   © 2012 Deloitte The Netherlands
Outlook
The Dutch economy is expected to experience slow growth over the next
two years

Dutch GDP projections (€b)                                           Comments
650                                                           6%
                                                                     • The economy seems to keep an easy pace as the
625                                                                    Dutch GDP is expected to grow at a steady 1.4%
                                              1.4%            3%       for the coming two years
600
                                                                     • Following the sharp recovery in 2010 in the
                                                       576             advertising market, future growth is expected to be
575                                            567            0%
                                     560                               more in line with GDP
                       551
550      542
                                                              -3%
525
                                                              -6%
500

475                                                           -9%
450
                                                              -12%
425

400                                                           -15%
         2009         2010          2011      2012F   2013F

              GDP
              GDP Growth rate YoY
              Total advertising growth rate YoY
Note: Real GDP based on constant prices
Source: IMF, Deloitte analysis


10    IAB report on online ad-spend - DRAFT                                                          © 2012 Deloitte The Netherlands
TV and online are expected to grow the most in both absolute and relative
terms

Estimated advertising market (€m)                                             Comments
5,000
                                                           1.8%

                                                   4,095 5        4,169 6     • Expected growth for the total advertising market in
                                 4,028 5
4,000         3,827 5                                    158            165     The Netherlands in 2012 is 1.8%
                                       150          233            235
                                  230                                         • The online advertising market is expected to
               219 149                                             452
                                  547               484                         become the largest market in 2012
               571                                                            • Newspapers and magazines are expected to
3,000
                                                                  1,091         continue their steady decline
                                  965              1,059
               885                                                            • Radio is expected to remain stable through 2012
                                                                              • Outdoor is expected to grow steadily
2,000
                                                   1,088          1,045
                                 1,177
              1,184
1,000

                                                   1,068          1,175
               815                954

     0
              2009               2010              2011E          2012F
     Cinema            Radio                  TV                  Internet
     Outdoor           Magazines              Newspapers

Source: Zenith optimedia December 2011, SPOT TV Jaarrapport 2011, Radio Advies Bureau; Company annual reports, Deloitte analysis


11    IAB report on online ad-spend - DRAFT                                                                       © 2012 Deloitte The Netherlands
As consumers spend more time online, advertisers are expected to respond
similarly to rebalance the value of the difference media types

                             Time spend vs SoA* (2011)

                                                                        = Indicative direction and speed
                                       50

                                       45

                                       40       Newspapers

                                       35

                                       30
                             SoA (%)


                                                                   Internet                     TV
                                       25

                                       20

                                       15
                                                   Magazine
                                       10

                                        5                                        Radio

                                        0
                                            0     5   10     15    20   25     30    35    40    45    50
                                                                  Time spend (%)
* SoA = Share of Advertising
Note: Share of Advertising based on collected 2011 data; Time spend based on most recent available findings from SPOT
Source: Trends tijdsbesteding 2010 SPOT, Zenith optimedia December 2011, SPOT TV Jaarrapport 2011, Radio Advies Bureau, Deloitte analysis


12    IAB report on online ad-spend - DRAFT                                                                       © 2012 Deloitte The Netherlands
Affiliate respondents predict a 14.9% market growth in 2012 weighted by
respondent revenues as compared to 7.7% for the market at large

Affiliate survey respondents                                Overall survey respondents growth expectations
growth expectations
                                                                   50%
50%                                                         50%
         45%                                                          45%


40%                                                         40%


30%                                                         30%


                                                                        20%
               20%     20%                                           20%    20%
20%                                                         20%               18%
                                                                                15% 15%
                                                                                  15% 12%
                                                    14.9%                               12%
                                                                                          10% 10% 10% 10% 10% 10% 10%
                             10%    10%       10%                                           10% 10% 10% 10% 10% 10% 8%
10%                                                         10%                                                       8%
                                                                                                                        7% 5%                   7.7%
                                                                                                                          5% 5%
                                                                                                                               4%
                                                                                                                                 2%

 0%                                                          0%
                 Respondents*                                                                Respondents

*n=6 representing €60.7M
Note: Growth expectation calculated by weighting responses with company revenue; overall market includes affiliates and publishers
Source: Survey respondents; Deloitte analysis


13    IAB report on online ad-spend - DRAFT                                                                             © 2012 Deloitte The Netherlands
Appendix
Methodology


Online advertising market


• 8 affiliate companies reported their data based on the
  questionnaire
• The data gathered comprises 59% of the total market by
  revenue
• The figures are drawn up on the basis of site declaration
  and have not been verified


15   IAB report on online ad-spend - DRAFT                    © 2012 Deloitte The Netherlands
Definitions


Categories                                                   Payment models


• Display                                                    • Fixed Fee: Payment model based on a fixed fee
     -    Embedded formats (banners, buttons, skyscrapers    • CPM: Cost per Mille = Payment model where the
          etc)                                                 advertiser pays per thousand viewers
     -    Interruptive formats (rich media, over the page,   • CPC: Cost per Click = Payment model based on the
          page take-over etc)                                  number of clicks on an advertisement
     -    Tekstlinks (incl. AdSense)                         • CPL: Cost per Lead = Payment model that is based on
                                                               the number of leads generated. A lead is an online
     -    Video (pre-/mid-/ postroll)
                                                               conversion where the consumer shares its contact details
     -    Other uncategorized display advertising              and indicates to be interested
• Online classifieds, directories & listings                 • CPS: Cost per Sale = Payment model based on the
     -    B2B                                                  number of sales generated

     -    B2C
     -    C2C


16       IAB report on online ad-spend - DRAFT                                                    © 2012 Deloitte The Netherlands
Contact


For questions concerning this research feel free to contact:


Roel van Rijsewijk                              Roel van Rijsewijk is a Director with the Risk Services practice from Deloitte with more than
Deloitte Online Business Innovation             10 years of experience in risk consulting for companies in the Technology, Media &
                                                Telecommunications (TMT) industry. Roel leads one of Deloitte’s main innovation projects on
•    Tel:          +31 (0)6 52615087            ethics and trust in a digital world and is co-founder of Deloitte’s Online Business Innovation
•    Email:        rvanrijsewijk@deloitte.nl    group


Gagandeep Sethi
Deloitte Consulting | Strategy                  Gagandeep Sethi is a Manager in the Corporate Strategy practice of Deloitte Consulting
                                                Netherlands with more than 10 years of experience within the Technology, Media &
•    Tel:          +31 (0)6 13127167            Telecommunications (TMT) industry.
•    Email:        gasethi@deloitte.nl


Internet Advertising Bureau
IAB Nederland                                   Dutch IAB research includes the IAB / Deloitte Ad Spend Study, all IAB commissioned
                                                research and assisting IAB members with their research projects. Also responsible for
•    Tel:          +31 (0)20 531 51 19          shaping the IAB knowledge base so that it meets members' needs moving forward
•    Email:        Lauren@iab.nl


17      IAB report on online ad-spend - DRAFT                                                                           © 2012 Deloitte The Netherlands
Disclaimer:
Deloitte refers to one or more of Deloitte Touche Tohmatsu Limited, a UK private company limited by guarantee, and its network of member firms, each of which is a legally separate
and independent entity. Please see www.deloitte.com/about for a detailed description of the legal structure of Deloitte Touche Tohmatsu Limited and its member firms.
Deloitte provides audit, tax, consulting, and financial advisory services to public and private clients spanning multiple industries. With a globally connected network of member firms in
more than 140 countries, Deloitte brings world-class capabilities and deep local expertise to help clients succeed wherever they operate. Deloitte's approximately 170,000 professionals
are committed to becoming the standard of excellence.
This publication contains general information only, and none of Deloitte Touche Tohmatsu Limited, Deloitte Global Services Limited, Deloitte Global Services Holdings Limited, the
Deloitte Touche Tohmatsu Verein, any of their member firms, or any of the foregoing’s affiliates (collectively the “Deloitte Network”) are, by means of this publication, rendering
accounting, business, financial, investment, legal, tax, or other professional advice or services. This publication is not a substitute for such professional advice or services, nor should it
be used as a basis for any decision or action that may affect your finances or your business. Before making any decision or taking any action that may affect your finances or your
business, you should consult a qualified professional adviser. No entity in the Deloitte Network shall be responsible for any loss whatsoever sustained by any person who relies on this
publication.


18      IAB report on online ad-spend - DRAFT                                                                                                                © 2012 Deloitte The Netherlands

Marktmonitor Affiliate Marketing 2011

  • 1.
    IAB report ononline ad-spend Affiliates results 2011
  • 2.
    IAB Online AdSpend Study 1 IAB report on online ad-spend - DRAFT © 2012 Deloitte The Netherlands
  • 3.
  • 4.
    Online Advertising Market 3 IAB report on online ad-spend - DRAFT © 2012 Deloitte The Netherlands
  • 5.
    Total spend onaffiliate marketing in The Netherlands is €117m Spend on affiliate marketing (€m) Affiliate revenue by publisher model Social Media 3% 3% Advertising networks 7% Coupon codes 8% Search (SEO/SEA) 13% Comparison sites 117 20% Cashback and loyalty 46% Topic publishers Publisher model Note: Division of revenue by publisher model based on data from an estimated 59% (€68.6m) of the total market Source: Jochem Vroom Affiliateblog/Imbull BV; Survey respondents; Deloitte analysis 4 IAB report on online ad-spend - DRAFT © 2012 Deloitte The Netherlands
  • 6.
    More than halfof affiliates’ display advertising revenues come from traditional embedded formats Display advertising breakdown by format* 44% Textlinks (incl. AdSense) 56% Embedded formats Display formats *n=7 representing €68.6m Note: Embedded formats are for example traditional banners and skyscrapers Source: Survey respondents, Deloitte analysis 5 IAB report on online ad-spend - DRAFT © 2012 Deloitte The Netherlands
  • 7.
    For affiliate marketingCPS model is the default revenue model Affiliate advertising revenue per payment model** Fixed Fee CPC Other 2% 3% CPL 2% 15% 78% CPS *n=4 representing €39.7m **n=6 representing €62.6m Note: In-app only includes revenues from survey respondents and excludes revenues from players such as Google and Apple Source: Survey respondents, Emerce.nl, Deloitte analysis 6 IAB report on online ad-spend - DRAFT © 2012 Deloitte The Netherlands
  • 8.
    Display revenue permedium (website, mobile, e-mail) 7 IAB report on online ad-spend - DRAFT © 2012 Deloitte The Netherlands
  • 9.
    Online retail andFinancial services advertisers dominate affiliates’ revenue share, Consumer goods and automotive advertisers are underrepresented Industries by revenue share affiliates* Industries by revenue share all respondents 2011 2011 Online retail 27% Online retail 9% Financial services 26% Financial services 14% Telecom 18% Telecom 10% Travel 13% Travel 7% Fashion 6% Fashion 2% Energy 3% Energy 1% Consumer goods 1% Consumer goods 17% Hardware & Hardware & 1% 4% electronics electronics Free time 0% Free time 2% Personal care 0% Personal care 3% Automotive 0% Automotive 7% Public sector 0% Public sector 3% ICT Services 0% ICT Services 2% Retail 0% Retail 2% *n=4 representing €40.3m ** includes free time, personal care, automotive, public sector, ICT services, retail Note: Excluding classifieds, directories & listings, search and industry category other; All respondents includes affiliates and publishers Source: Survey respondents, Deloitte analysis 8 IAB report on online ad-spend - DRAFT © 2012 Deloitte The Netherlands
  • 10.
  • 11.
    The Dutch economyis expected to experience slow growth over the next two years Dutch GDP projections (€b) Comments 650 6% • The economy seems to keep an easy pace as the 625 Dutch GDP is expected to grow at a steady 1.4% 1.4% 3% for the coming two years 600 • Following the sharp recovery in 2010 in the 576 advertising market, future growth is expected to be 575 567 0% 560 more in line with GDP 551 550 542 -3% 525 -6% 500 475 -9% 450 -12% 425 400 -15% 2009 2010 2011 2012F 2013F GDP GDP Growth rate YoY Total advertising growth rate YoY Note: Real GDP based on constant prices Source: IMF, Deloitte analysis 10 IAB report on online ad-spend - DRAFT © 2012 Deloitte The Netherlands
  • 12.
    TV and onlineare expected to grow the most in both absolute and relative terms Estimated advertising market (€m) Comments 5,000 1.8% 4,095 5 4,169 6 • Expected growth for the total advertising market in 4,028 5 4,000 3,827 5 158 165 The Netherlands in 2012 is 1.8% 150 233 235 230 • The online advertising market is expected to 219 149 452 547 484 become the largest market in 2012 571 • Newspapers and magazines are expected to 3,000 1,091 continue their steady decline 965 1,059 885 • Radio is expected to remain stable through 2012 • Outdoor is expected to grow steadily 2,000 1,088 1,045 1,177 1,184 1,000 1,068 1,175 815 954 0 2009 2010 2011E 2012F Cinema Radio TV Internet Outdoor Magazines Newspapers Source: Zenith optimedia December 2011, SPOT TV Jaarrapport 2011, Radio Advies Bureau; Company annual reports, Deloitte analysis 11 IAB report on online ad-spend - DRAFT © 2012 Deloitte The Netherlands
  • 13.
    As consumers spendmore time online, advertisers are expected to respond similarly to rebalance the value of the difference media types Time spend vs SoA* (2011) = Indicative direction and speed 50 45 40 Newspapers 35 30 SoA (%) Internet TV 25 20 15 Magazine 10 5 Radio 0 0 5 10 15 20 25 30 35 40 45 50 Time spend (%) * SoA = Share of Advertising Note: Share of Advertising based on collected 2011 data; Time spend based on most recent available findings from SPOT Source: Trends tijdsbesteding 2010 SPOT, Zenith optimedia December 2011, SPOT TV Jaarrapport 2011, Radio Advies Bureau, Deloitte analysis 12 IAB report on online ad-spend - DRAFT © 2012 Deloitte The Netherlands
  • 14.
    Affiliate respondents predicta 14.9% market growth in 2012 weighted by respondent revenues as compared to 7.7% for the market at large Affiliate survey respondents Overall survey respondents growth expectations growth expectations 50% 50% 50% 45% 45% 40% 40% 30% 30% 20% 20% 20% 20% 20% 20% 20% 18% 15% 15% 15% 12% 14.9% 12% 10% 10% 10% 10% 10% 10% 10% 10% 10% 10% 10% 10% 10% 10% 10% 10% 8% 10% 10% 8% 7% 5% 7.7% 5% 5% 4% 2% 0% 0% Respondents* Respondents *n=6 representing €60.7M Note: Growth expectation calculated by weighting responses with company revenue; overall market includes affiliates and publishers Source: Survey respondents; Deloitte analysis 13 IAB report on online ad-spend - DRAFT © 2012 Deloitte The Netherlands
  • 15.
  • 16.
    Methodology Online advertising market •8 affiliate companies reported their data based on the questionnaire • The data gathered comprises 59% of the total market by revenue • The figures are drawn up on the basis of site declaration and have not been verified 15 IAB report on online ad-spend - DRAFT © 2012 Deloitte The Netherlands
  • 17.
    Definitions Categories Payment models • Display • Fixed Fee: Payment model based on a fixed fee - Embedded formats (banners, buttons, skyscrapers • CPM: Cost per Mille = Payment model where the etc) advertiser pays per thousand viewers - Interruptive formats (rich media, over the page, • CPC: Cost per Click = Payment model based on the page take-over etc) number of clicks on an advertisement - Tekstlinks (incl. AdSense) • CPL: Cost per Lead = Payment model that is based on the number of leads generated. A lead is an online - Video (pre-/mid-/ postroll) conversion where the consumer shares its contact details - Other uncategorized display advertising and indicates to be interested • Online classifieds, directories & listings • CPS: Cost per Sale = Payment model based on the - B2B number of sales generated - B2C - C2C 16 IAB report on online ad-spend - DRAFT © 2012 Deloitte The Netherlands
  • 18.
    Contact For questions concerningthis research feel free to contact: Roel van Rijsewijk Roel van Rijsewijk is a Director with the Risk Services practice from Deloitte with more than Deloitte Online Business Innovation 10 years of experience in risk consulting for companies in the Technology, Media & Telecommunications (TMT) industry. Roel leads one of Deloitte’s main innovation projects on • Tel: +31 (0)6 52615087 ethics and trust in a digital world and is co-founder of Deloitte’s Online Business Innovation • Email: rvanrijsewijk@deloitte.nl group Gagandeep Sethi Deloitte Consulting | Strategy Gagandeep Sethi is a Manager in the Corporate Strategy practice of Deloitte Consulting Netherlands with more than 10 years of experience within the Technology, Media & • Tel: +31 (0)6 13127167 Telecommunications (TMT) industry. • Email: gasethi@deloitte.nl Internet Advertising Bureau IAB Nederland Dutch IAB research includes the IAB / Deloitte Ad Spend Study, all IAB commissioned research and assisting IAB members with their research projects. Also responsible for • Tel: +31 (0)20 531 51 19 shaping the IAB knowledge base so that it meets members' needs moving forward • Email: Lauren@iab.nl 17 IAB report on online ad-spend - DRAFT © 2012 Deloitte The Netherlands
  • 19.
    Disclaimer: Deloitte refers toone or more of Deloitte Touche Tohmatsu Limited, a UK private company limited by guarantee, and its network of member firms, each of which is a legally separate and independent entity. Please see www.deloitte.com/about for a detailed description of the legal structure of Deloitte Touche Tohmatsu Limited and its member firms. Deloitte provides audit, tax, consulting, and financial advisory services to public and private clients spanning multiple industries. With a globally connected network of member firms in more than 140 countries, Deloitte brings world-class capabilities and deep local expertise to help clients succeed wherever they operate. Deloitte's approximately 170,000 professionals are committed to becoming the standard of excellence. This publication contains general information only, and none of Deloitte Touche Tohmatsu Limited, Deloitte Global Services Limited, Deloitte Global Services Holdings Limited, the Deloitte Touche Tohmatsu Verein, any of their member firms, or any of the foregoing’s affiliates (collectively the “Deloitte Network”) are, by means of this publication, rendering accounting, business, financial, investment, legal, tax, or other professional advice or services. This publication is not a substitute for such professional advice or services, nor should it be used as a basis for any decision or action that may affect your finances or your business. Before making any decision or taking any action that may affect your finances or your business, you should consult a qualified professional adviser. No entity in the Deloitte Network shall be responsible for any loss whatsoever sustained by any person who relies on this publication. 18 IAB report on online ad-spend - DRAFT © 2012 Deloitte The Netherlands

Editor's Notes

  • #11 Advertising expectations, where from??