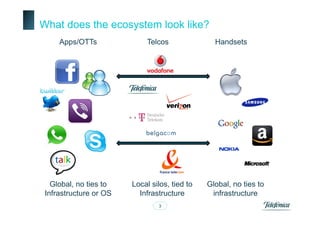
Carriers & OTTs

       Emilio Sepulveda


Megève, bics Carrier Event
February 2012
2009-2012 Where was the most value created?
Market value creation by sector 1/1/09à1/1/12(1)

                                                        Other Internet
                                                   (10 companies: +$112Bn)


                               eCommerce
                         (11 companies: +$125Bn)
                                                                                                                       (+319Bn)


                Semiconductors
             (56 companies: +$164Bn)

                                                                                                                                (+$70Bn)


                                                                                                                                   Other Mobile
            Social/Local                                                                                                  (Intel, Qualcom, ARM: +$95Bn)
(Facebook, Baidu, Groupon, LinkedIn,
 Mail.ru, Pandora, Tencent: +$164Bn)


                                                                                                                        Tech Bellwethers
                                                                                                                (Google, IBM, Microsoft, Oracle, HP,
                                                                                                                          Cisco: +$284Bn)
                                              Software
          Mobile                       (77 companies: +$184Bn)

                                                          Total value creation $1,517 Bn
   Source: Capital IQ, Morgan Stanley
   Notes: (1) Comm Equipment and device manufacturers (Nokia, RIM, Alcatel-Lucent, HTC, Juniper, ZTE) are not included in the chart as
   these sectors had a negative value creation of ($43Bn), wihich corresponds to a (2,9%) of total value creation


                                                                                      2
What does the ecosystem look like?
     Apps/OTTs               Telcos              Handsets


   Global, no ties to   Local silos, tied to   Global, no ties to
 Infrastructure or OS     Infrastructure        infrastructure
                                3
But  communications  is  the  operators’  
     core  business  …  much trouble?
      Are OTT causing
     Which option best reflects your opinion on the impact of smartphone         Global mobile revenues, voice vs. data, 2009-2016
        adoption on usage of operator voice & messaging services?


                                                 Users are
                                                  heavily
                                                substituting
          Users are                               voice &
         moderately                             messaging
         substituting                          services, 13%
           voice &
         messaging                                             No material
        services, 41%                                          impact, 6%


                                                          No material
                                                         impact today,

•     Revenue erosion comes from local market
                                                         but we expect
                                                            users to
                                                          substitute in
      competition, not OTTs, and regulators                the future,

•     OTTs only accelerate changes and leverage
                                                              40%


      arbitrage opportunities        Source: Informa Telecoms & Media                         Source: Informa Telecoms & Media
                        www.informatandm.com
                        ©Confidential


                                                                             4
Is‘MadeShare from 5% Five Years Agoat all?
                it about voice Systems =
               64%
                    in USA’ Smartphone Operating


                                             Smartphone Operating System Market Share, 2005 vs. 2011E

                                      100%
      Market Share of Smartphone OS


                                      80%

                                                                                            Other OS
                                      60%                                                   iOS
                                                                                            Android
                                                                                            Windows Mobile
                                      40%                                                   BlackBerry OS
                                                                                            Linux
                                                                                            Nokia Symbian
                                      20%


                                       0%
                                                     2005                   2011E

Source: Morgan Stanley Research, Gartner.

Copyright 2011. All rights reserved.                                                                  Source: Mary Meeker
                                                                                                                45


                                                                                                                 5
Should we invest in RCS/IMS… platforms?

 Where is the business rational?             Better partner with OTTs selectively


•    Zero billion incremental revenue
     opportunity
•    Harvesting is OK, but why invest?
•    Only winners are vendors


                                         6
So what are the opportunities for us, telcos? What
kind of platform/OTT are we?


      Source: Mary Meeker


                            •    Experience as a Service/Experience
                                 delivery network
                            •    We are an infrastructure platform
                            •    No one can get closer to the end user


                             7
Are we properly organized to overcome?


                                             Chairman & CEO
                                                César Alierta


                                                  COO
                                               Julio Linares


    Telefonica Digital            Latam                           Europe             Global Resources
       Mathew Key        Santiago Fernández Valbuena       José M. Álvarez-Pallete   Guillermo Ansaldo


•  Centralize decisions on services, technology, VC
•  Deploy centralized platforms and maximize synergies
•  Let local units take care of market approach and local positioning
                                                       8
What about us, wholesalers? Any opportunity?
       E2E
       QoS

                                            Behave as
                 Higher                     wholesale
               availability                  customer
               and security

                                                                  Control
                                                                    and
  New                                                             Visibility
 Services


                New                                OTT model
              Business                               enables
               Models                             direct access
                              Evolve from             to end
                              middlemen             customers
                               to enabler


                              9
…and allows us to get rid of middlemen and
         enforce Cascade payment models

Money and Traffic flow

                              Marketing                    Content    Ingestion   Delivery
 Advertisers                                   Enablers
                              Agencies                    Providers   Carriers    Carriers


                                                                                             Broadband
                                                                                             Users


 Example: Content ecosystem
 Source: Chetan Sharma


 Telefonica International Wholesale Services
What is the value we add?

  Closer to the
    Customer

    Efficient

Network aware &
 Content aware

       QoS

    Security

No Incremental
Cost for a Better
      Value

E2E Responsibility


                       11
Summary


•  OTTs is accelarating changes in users behaviour
•  This change in behaviour means a shift from voice revenues to data
   revenues
•  Real threat to core revenues come from local competition in broadband
   services, fixed an mobile (and regulator activities…)
•  OTT in voice and messaging is a zero billion opportunity, but the OTT
   model itself offers lots of opportunities, even for wholesalers
•  We must rethink what are our actual core assets, how we leverage them
   and what value can be added as a wholesaler


                                     12
Thank You !


More questions?
emilio.sepulveda@telefonica.com
                           13

Carriers & OTTs

  • 1.
    Carriers & OTTs Emilio Sepulveda Megève, bics Carrier Event February 2012
  • 2.
    2009-2012 Where wasthe most value created? Market value creation by sector 1/1/09à1/1/12(1) Other Internet (10 companies: +$112Bn) eCommerce (11 companies: +$125Bn) (+319Bn) Semiconductors (56 companies: +$164Bn) (+$70Bn) Other Mobile Social/Local (Intel, Qualcom, ARM: +$95Bn) (Facebook, Baidu, Groupon, LinkedIn, Mail.ru, Pandora, Tencent: +$164Bn) Tech Bellwethers (Google, IBM, Microsoft, Oracle, HP, Cisco: +$284Bn) Software Mobile (77 companies: +$184Bn) Total value creation $1,517 Bn Source: Capital IQ, Morgan Stanley Notes: (1) Comm Equipment and device manufacturers (Nokia, RIM, Alcatel-Lucent, HTC, Juniper, ZTE) are not included in the chart as these sectors had a negative value creation of ($43Bn), wihich corresponds to a (2,9%) of total value creation 2
  • 3.
    What does theecosystem look like? Apps/OTTs Telcos Handsets Global, no ties to Local silos, tied to Global, no ties to Infrastructure or OS Infrastructure infrastructure 3
  • 4.
    But  communications  is the  operators’   core  business  …  much trouble? Are OTT causing Which option best reflects your opinion on the impact of smartphone Global mobile revenues, voice vs. data, 2009-2016 adoption on usage of operator voice & messaging services? Users are heavily substituting Users are voice & moderately messaging substituting services, 13% voice & messaging No material services, 41% impact, 6% No material impact today, •  Revenue erosion comes from local market but we expect users to substitute in competition, not OTTs, and regulators the future, •  OTTs only accelerate changes and leverage 40% arbitrage opportunities Source: Informa Telecoms & Media Source: Informa Telecoms & Media www.informatandm.com ©Confidential 4
  • 5.
    Is‘MadeShare from 5%Five Years Agoat all? it about voice Systems = 64% in USA’ Smartphone Operating Smartphone Operating System Market Share, 2005 vs. 2011E 100% Market Share of Smartphone OS 80% Other OS 60% iOS Android Windows Mobile 40% BlackBerry OS Linux Nokia Symbian 20% 0% 2005 2011E Source: Morgan Stanley Research, Gartner. Copyright 2011. All rights reserved. Source: Mary Meeker 45 5
  • 6.
    Should we investin RCS/IMS… platforms? Where is the business rational? Better partner with OTTs selectively •  Zero billion incremental revenue opportunity •  Harvesting is OK, but why invest? •  Only winners are vendors 6
  • 7.
    So what arethe opportunities for us, telcos? What kind of platform/OTT are we? Source: Mary Meeker •  Experience as a Service/Experience delivery network •  We are an infrastructure platform •  No one can get closer to the end user 7
  • 8.
    Are we properlyorganized to overcome? Chairman & CEO César Alierta COO Julio Linares Telefonica Digital Latam Europe Global Resources Mathew Key Santiago Fernández Valbuena José M. Álvarez-Pallete Guillermo Ansaldo •  Centralize decisions on services, technology, VC •  Deploy centralized platforms and maximize synergies •  Let local units take care of market approach and local positioning 8
  • 9.
    What about us,wholesalers? Any opportunity? E2E QoS Behave as Higher wholesale availability customer and security Control and New Visibility Services New OTT model Business enables Models direct access Evolve from to end middlemen customers to enabler 9
  • 10.
    …and allows usto get rid of middlemen and enforce Cascade payment models Money and Traffic flow Marketing Content Ingestion Delivery Advertisers Enablers Agencies Providers Carriers Carriers Broadband Users Example: Content ecosystem Source: Chetan Sharma Telefonica International Wholesale Services
  • 11.
    What is thevalue we add? Closer to the Customer Efficient Network aware & Content aware QoS Security No Incremental Cost for a Better Value E2E Responsibility 11
  • 12.
    Summary •  OTTs isaccelarating changes in users behaviour •  This change in behaviour means a shift from voice revenues to data revenues •  Real threat to core revenues come from local competition in broadband services, fixed an mobile (and regulator activities…) •  OTT in voice and messaging is a zero billion opportunity, but the OTT model itself offers lots of opportunities, even for wholesalers •  We must rethink what are our actual core assets, how we leverage them and what value can be added as a wholesaler 12
  • 13.
    Thank You ! Morequestions? emilio.sepulveda@telefonica.com 13