Download as PDF, PPTX
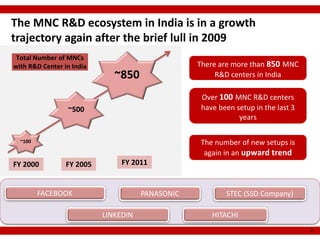
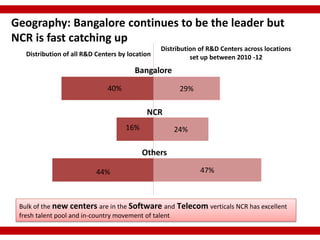
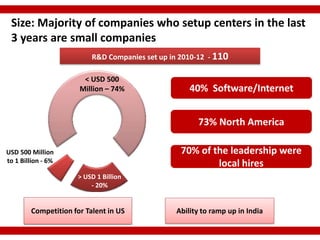
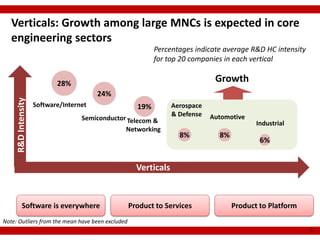
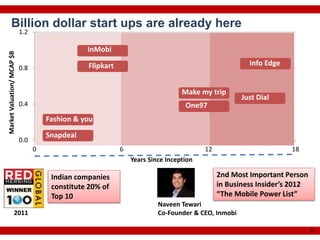
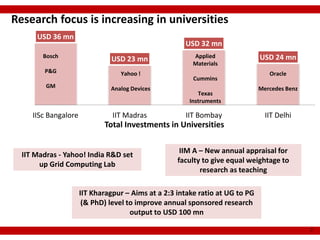
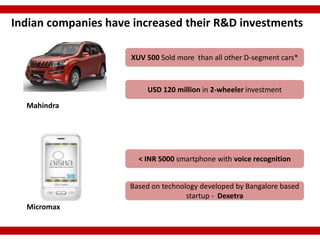
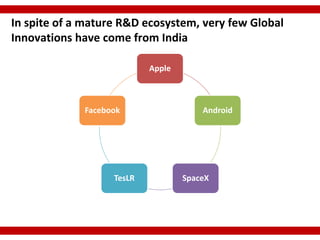
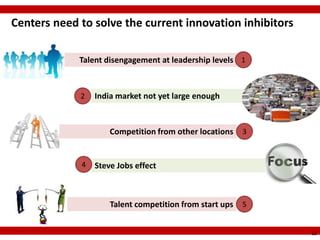
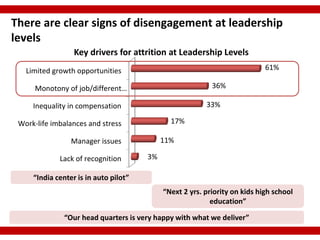
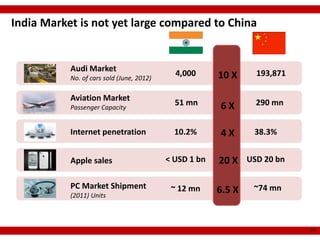
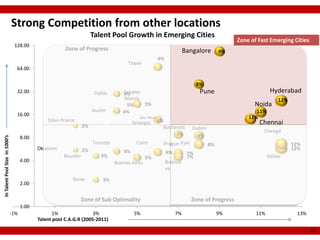
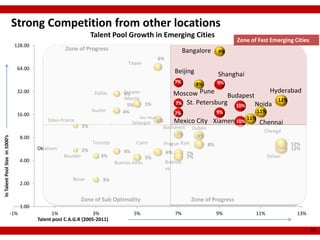
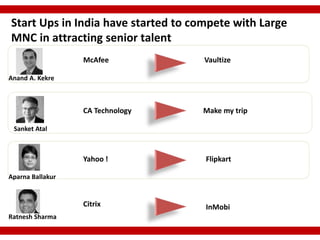


Inspiring tomorrow’s innovations The number of MNC R&D centers in India has grown to over 850, with over 100 added in the last 3 years. Bangalore remains the top location, though New Delhi is growing fast. Most new centers focus on software and telecom and are established by smaller MNCs. Competition for talent with startups is increasing as billion dollar startups emerge from India. While India's R&D ecosystem has matured, few major global innovations have emerged, facing challenges like talent disengagement, limited domestic market size, and competition from other locations. Social innovation programs show potential to solve large societal problems through holistic solutions.


