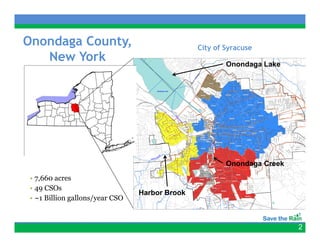
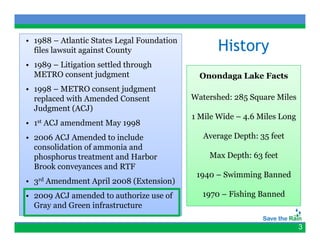
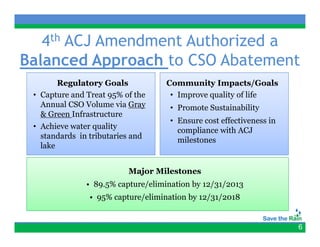
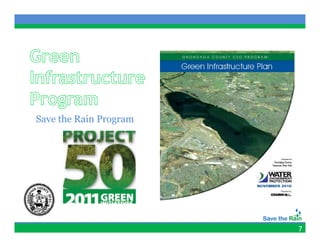
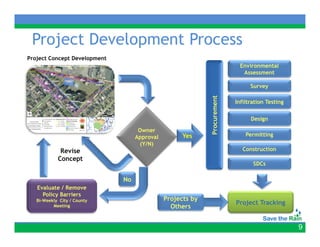
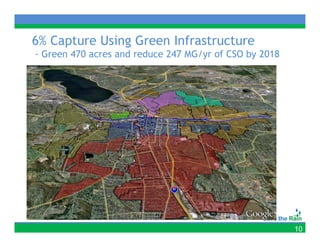
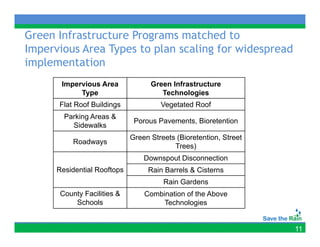
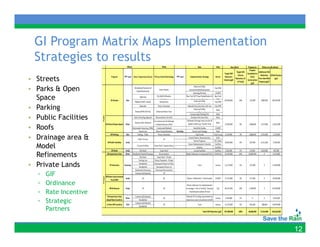
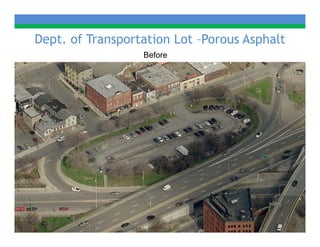
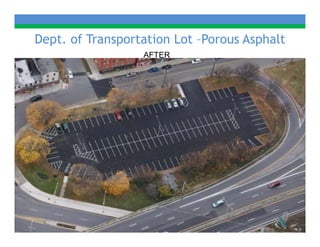
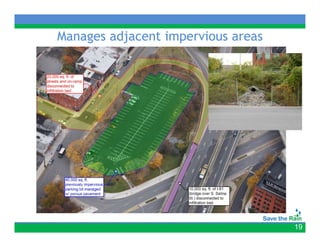
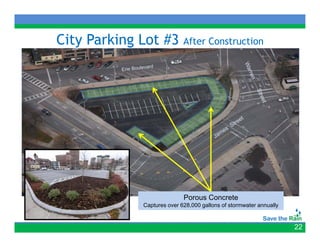
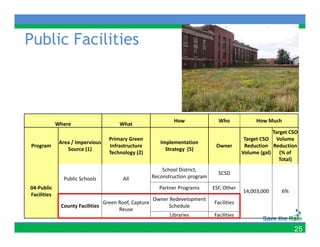
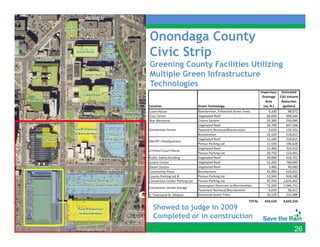
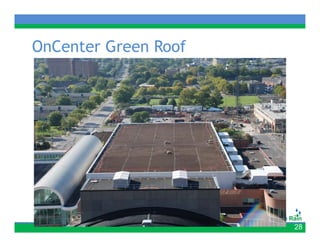
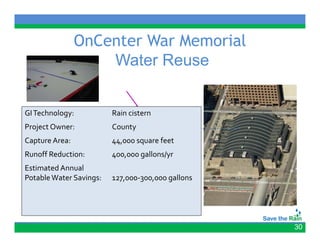
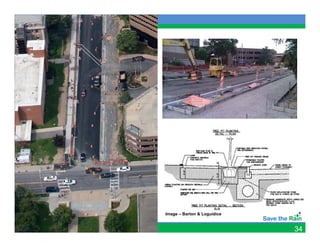
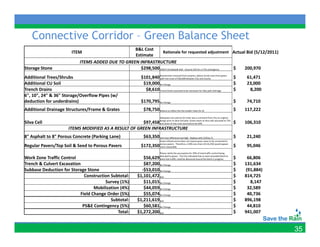
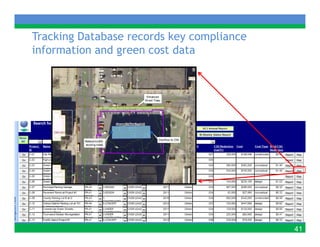
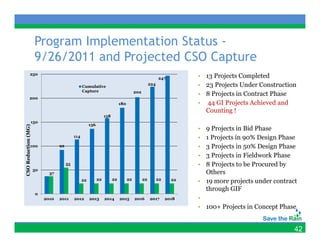
Onondaga County, New York
Save the Rain Program - Implementation Lessons
Learned from Nations 1st Green CSO Court Order
Joanne M. Mahoney, County Executive

     LID S
         Symposium - Phil d l hi PA
                i     Philadelphia,
     September 27th, 2011


                      Matthew Millea, Deputy County Executive,
                      Onondaga County

                      Brian Marengo, Matthew Marko, Rita Fordiani,
                      Andrew Potts, Dan Wible
                      CH2M HILL
Onondaga County,
      g       y,                                City f Syracuse
                                                Cit of S
   New York                                            Onondaga Lake


                                                       Onondaga Creek
 • 7,660 acres
 • 49 CSOs
                                 Harbor Brook
 • ~1 Billion gallons/year CSO
              g      /y


                                                                        2
• 1988 – Atlantic States Legal Foundation
  files lawsuit against County                      History
• 1989 – Litigation settled through
  METRO consent judgment                       Onondaga Lake Facts
• 1998 – METRO consent judgment
  replaced with Amended Consent              Watershed: 285 Square Miles
  Judgment (ACJ)
                                             1 Mile Wide – 4.6 Miles Long
•   1st   ACJ amendment May 1998
• 2006 ACJ Amended to include                   Average Depth: 35 feet
                                                     g    p
  consolidation of ammonia and
  phosphorus treatment and Harbor                Max Depth: 63 feet
  Brook conveyances and RTF
              y
                                              1940 – Swimming Banned
•   3rd   Amendment April 2008 (Extension)
• 2009 ACJ amended to authorize use of         1970 – Fishing Banned
  Gray and Green infrastructure

                                                                            3
ACJ Compliance Projects Completed to Date (1998-2008)
                                          (1998-
         Total Investment: $367 million
 1. Aeration System Upgrade
               y       pg                             21.   Siphon Rehabilitation
                                                              p
 2. Odor Control - residual handling and clarifiers   22.   Teall Brook FCF
 3. Chemical Storage Building and Feed System         23.   West St. Sewer Separation (CSOs 057, 058, 059)
 4. Digester and Lagoon Improvements                  24.   Water St. Sewer Separation (CSO 024)
 5. Phase II Plant Improvements                       25.   Brighton Sewer Separation (CSOs 053, 054)
 6. Ammonia Removal Pilot
                       l l                            26.
                                                       6    Ammonia Source Trackdown Program
                                                            A       i S            kd
 7. Phosphorus Removal Pilot – Phase I                27.   Tallman/Onondaga Sewer Separation (CSOs 038, 040,
 8. Digital System Upgrade                                  046a and 046b)
 9. Ammonia Removal – BAF                             28.   Midland Phase II (includes Regional Storage and
                                                            Treatment Facility plus 1,000 ft. pipeline)
 10. Phosphorus Removal – HRFS
                                                      29.   Phosphorus Removal Pilot – Phase II
 11. CSO Toxicity Evaluation Report
                                                      30.   Biosolids Handling (mechanical thickeners)
 12. Erie Boulevard Storage System Upgrade
                                                            Improvements – Metro
 13. Franklin St. FCF
                                                      31.   South Ave./Bissell St. Sewer Separation (CSOs 047 and
 14. Harbor Brook FCF                                       048)
                                                             4 )
 15. Hiawatha RTF                                     32.   Sewer Separation 050 – Parkway/Rockland
 16. Kirkpatrick St. Pump Station Upgrade             33.   Clinton Conveyances Phase 1 – pipeline outside the
 17. Maltbie St. FCF                                        Trolley Lot & Armory Square
 18. Midland Phase I Pipeline                         34.   Clinton Conveyances Phase 2A – pipeline behind the
 19.
 19 Newell St. Pilot Disinfection
            St                                              MOST under RR
 20. Onondaga Creek FCF - Boat                        35.   Sewer Separation 051 – Colvin Avenue


                                                                                                                    4
Water Quality Improvements
                  Q     y p
                    Phosphorus


Phosphorus discharge from METRO to Onondaga Lake has decreased from over
           300 pounds per day to approximately 50 pounds per day
                                                                           5
4th ACJ Amendment Authorized a
Balanced Approach to CSO Abatement
       Regulatory Goals            Community Impacts/Goals
 • Capture and Treat 95% of the     • Improve quality of life
   Annual CSO Volume via Gray y     • Promote Sustainability
   & Green Infrastructure
                                    • Ensure cost effectiveness in
 • Achieve water quality
                                      compliance with ACJ
   standards in tributaries and
                                      milestones
   lake


                           Major Milestones
               • 89.5% capture/elimination by 12/31/2013
                • 95% capture/elimination by 12/31/2018
                        p    /             y / /


                                                                     6
Save the Rain Program


                        7
Everyone is for Green
Infrastructure… Until they’re Not
 - Program Modifications
1. Establish a Forum to resolve policy decisions, remove
   barriers, modify regulations and standardize design
   details and maintenance agreements
2. D
   Demonstrate k t h l i on P bli L d th t can
            t t key technologies     Public Lands that
   scale up to widespread progress
3
3. Incentivize GI (e.g. Green Improvement Funds)
                  ( g           p                  )
4. Add Green Infrastructure onto existing capital projects


                                                             8
Project Development Process
    j          p
Project Concept Development
                                                                            Environmental
                                                                             Assessment

                                                                                Survey


                                                                   ment
                                                                          Infiltration Testing


                                                            Procurem
                                                                                Design

                                    Owner
                                   Approval
                                    pp              Yes                       Permitting
                                    (Y/N)
             Revise                                                          Construction
            Concept
                                                                                 SDCs

                              No
   Evaluate / Remove
     Policy Barriers
   Bi Weekly
   Bi-Weekly City / County                    Projects by
                                                 j      y
                                                                          Project Tracking
          Meeting                               Others


                                                                                                 9
6% Capture Using Green Infrastructure
     p         g
- Green 470 acres and reduce 247 MG/yr of CSO by 2018


                                                        10
Green Infrastructure Programs matched to
Impervious A
I     i    Area T
                Types t plan scaling f widespread
                      to l      li for id       d
implementation
      Impervious Area             Green Infrastructure
           Type                      Technologies
                       g
      Flat Roof Buildings            Vegetated Roof
                                       g
       Parking Areas &
                             Porous Pavements, Bioretention
         Sidewalks
                            Green Streets (Bioretention, Street
                                          (Bioretention
          Roadways
          R d
                                         Trees)
                                Downspout Disconnection
     Residential Rooftops        Rain Barrels & Cisterns
                                      Rain Gardens
      County Facilities &       Combination of the Above
          Schools                    Technologies


                                                                  11
GI Program Matrix Maps Implementation
       g               p  p
 Strategies to results
• St t
  Streets
• Parks & Open
  Space
• Parking
• Public Facilities
• Roofs
• Drainage area &
  Model
  Refinements
• Private Lands
   ▫   GIF
   ▫   Ordinance
   ▫   Rate Incentive
   ▫   Strategic
       Partners


                                         12
Implementation Program Development
  p               g          p
Framework
                                                                                 Review
                                                                                Evaluate
                                                                                  Adapt


 Program     Where         What               How            Who       How Much


                         Primary GI
                                                                         Target
           Impervious    Technology      Implementation
                                                            Owner      Reduction
              Area
              A           (e.g. Rain
                          ( g R i           Strategy
                                            St t g
                                                                        / Status
                           Garden)
 Public


                                                                   Outreach &
                                                                   Partnering
                                           Projects


 Private
                        Planning & Engineering Resource Management
                                        Procurement
                                Field Survey / Environmental
                                           y
                                    Tracking & Monitoring


                                                                                           13
Parking
       g


                                                         How                   Who          How Much
          Where                   What
                                                                                                   Target 
                                                                                       Target CSO  CSO 
               Area /         Primary Green 
                                                Implementation Strategy  
                                                Implementation Strategy                Reduction  Volume 
                                                                                       Reduction Volume
Program     Impervious        Infrastructure                                  Owner
                                                         (5)                            Volume  Reduction 
             Source (1)       Technology (2) 
                                                                                          (gal)     (% of 
                                                                                                   Total)

  03‐                                           Reconstruct City/County 
          Parking ‐ Public   Porous Pavement                                City/County 6,510,000   3%
Parking                                                  Lots


                                                                                                             14
2010 Projects
Parking Lots - City Lot #21


                              15
Dept. of Transportation Lot –Porous Asphalt
  p           p                       p
                  Before


                                              16
Dept. of Transportation Lot –Porous Asphalt
  p           p                       p
                  AFTER


                                              17
Dept. of Transportation Parking Lot


                                      18
Manages adjacent impervious areas


                                    19
DOT owner, City managed, County designed and financed


                                                        20
City L t
Cit Lot #3 - B f
             Before


                      21
City Parking Lot #3
   y       g                After Construction


                            Porous Concrete
             Captures over 628,000 gallons of stormwater annually


                                                                    22
Townsend Parking Lot ( Lot B ) &
                     (“Lot B”)
       Townsend Median


                                   23
Asphalt Lot with Infiltration Trenches
                             CSO reduction
                             692,000
                             gallons/year

                             Bid $342,000

                             $0.51/gallon


                                             24
Public Facilities


                                                                How               Who             How Much
             Where                     What
                                                                                                         Target CSO 
                                   Primary Green 
                                   Primary Green                                              Target CSO  Volume 
                                                                                              Target CSO Volume
              Area / Impervious                           Implementation 
Program                            Infrastructure                                Owner        Reduction  Reduction 
                 Source (1)                                 Strategy  (5)
                                   Technology (2)                                            Volume (gal) (% of 
                                                                                                           Total)
                                                           School District, 
                                                           School District
                                                                                  SCSD
                Public Schools          All            Reconstruction program

04‐Public                                                 Partner Programs      ESF, Other
                                                                                             14,003,000      6%
Facilities
                                                       Owner Redevelopment 
                                                                     p
                                Green Roof, Capture 
                                G     R f C t                                   Facilities
                                                                                F iliti
              County Facilities                             Schedule
                                      Reuse
                                                              Libraries         Facilities

                                                                                                                  25
Onondaga County
Civic Strip
Greening County Facilities Utilizing
Multiple Green Infrastructure
     p
Technologies


Showed to judge in 2009
Completed or in construction
                                       26
Green Infrastructure 2011
       Signature Projects
OnCenter Convention Center 60,000 sq ft. Green Roof
                           60 000 ft


                                                      27
OnCenter Green Roof


                      28
Onondaga County
Civic Strip
Greening County Facilities Utilizing
Multiple Green Infrastructure
     p
Technologies


Showed to judge in 2009
Completed or in construction
                                       29
OnCenter War Memorial
                    Water Reuse


GI Technology:           Rain cistern
Project Owner:           County
Capture Area:
C t  A                   44,000 square feet
                                       f t
Runoff Reduction:        400,000 gallons/yr
Estimated Annual 
Potable Water Savings:   127,000‐300,000 gallons


                                                   30
Streets
            Where                         What                             How                     Who

           Area / Impervious           Primary Green 
Program                                                          Implementation Strategy          Owner
                Source           Infrastructure Technology

              Residential /                                         Road and Utility 
                                                                                                 City DPW
           Commercial Roads /         Green Streets           Improvement/Redevelopment
               Boulevards                                          Greening the Grey             OCWEP

                                   Dry Well/Infiltration                                         New York 
               Highways                                      New York DOT Road R&R Program
                                        Trenches                                                   DOT
  01‐
Streets     Median & Traffic                                        Road and Utility 
                                       Bioretention                                              City DPW
                                                                                                    y
               Islands
               Il d                                           Improvement/Redevelopment
                                                              I          t/R d l      t
                                                             Sidewalk Reconstruction with new 
               Sidewalks             Porous Pavement                                             City DPW
                                                                          detail
                                                                    Road and Utility 
                                                                                                  Parks
          Streets/ROW (Ad Hoc)
          St t /ROW (Ad H )       Enhanced Street Trees
                                  E h    d St t T             Improvement/Redevelopment
                                                              I          t/R d l      t
                                                                Canopy Study Planting Plan        Parks


                                                                                                             31
Connective Corridor


              Capture Area:
              Capture Area:           7.5 acres
                                      7 5 acres
              Run‐off Reduction:      5,7 MG /year
              Construction Cost:      $
                                      $948,700 (bid)
                                          ,    ( )
              $/gallon runoff removed $0.17  
              $ /gallon CSO removed   $0.26            32
Linking with Major Transportation Reconstruction
        g        j        p
  Creates Green Progress (Phase 1 - 10.4 Acres)
                                   Phase 1 – 10 4 Acres
                                             10.4


Image – Barton & Loguidice

                                                          33
Connective Corridor


                      Image – Barton & Loguidice


                                                   34
Connective Corridor – Green Balance Sheet
                                                   B&L Cost 
                       ITEM                                       Rationale for requested adjustment Actual Bid (5/12/2011)
                                                   Estimate
                            ITEMS ADDED DUE TO GREEN INFRASTRUCTURE
Storage Stone                                         $298,500 $30/CY (Creekwalk bid) ‐ Assume $35 for a 17% contingency $        200,970 
Additional Trees/Shrubs 
Additional Trees/Shrubs                                                $101 840 Bioretention removed from projects, deduct shrub costs from green.  
                                                                                                             p j    ,
                                                                       $101,840 Split tree costs of $46,000 between City and County         g
                                                                                                                                                                $          61,471 
                                                                                                                                                                $          61 471
Additional CU Soil                                                      $19,000 No Change                                                                       $          23,000 
Trench Drains                                                            $8,610 Trench Drains assumed to be necessary for bike path drainage                    $             8,200 
6", 10", 24" & 36" Storage/Overflow Pipes (w/ 
deduction for underdrains)                                             $170,795 No Change                                                                       $          74,710 
Additional Drainage Structures/Frame & Grates
Addi i   lD i       S         /F     &G                                  $78,750 
                                                                         $78 750 Reduce to reflect the the smaller inlets for GI                                $        117,222 
                                                                                                                                                                $        117 222
                                                                                        Adequate root volume for trees was a comment from City on original 

Silva Cell                                           $97,458 design prior to Silva Cell pilot. Green share of silva cells assumed at 75%  $        106,310 
                                                             and share of tree costs assumed to be 50%.

                     ITEMS MODIFIED AS A RESULT OF GREEN INFRASTRUCTURE
8" Asphalt to 8" Porous Concrete (Parking Lane)                          $63,350 Unit Cost difference too high.  Replace with $10/sq. ft.
                                                                                                            g      p               q                            $          21,240 
                                                                                        Green infrastructure does not require grass areas to be converted to 
                                                                                        porous pavers.  Therefore, a 50% cost share ($116,250) would appear 
Regular Pavers/Top Soil & Seed to Porous Pavers                        $172,350         more reasonable                                                         $          95,046 
                                                                                        Please clarify the assumption for 39% of total traffic control being 

Work Zone Traffic Control                                               $56,629 allocated to green.  The City indicated that as work preceded block to 
                                                                                block that traffic could be detoured around the block in progress               $          66,806 
Trench & Culvert Excavation                                             $87,200 No Change                                                                       $        131,634 
Subbase Deduction for Storage Stone
        Deduction for Storage Stone                                   ‐$53,010
                                                                      ‐$53 010 No Change                                                                        $         (91,884)
                                                                                                                                                                $         (91 884)
                             Construction Subtotal:                 $1,101,472 N/A                                                                              $        814,725 
                                       Survey (1%)                      $11,015 No Change                                                                       $             8,147 
                                  Mobilization (4%)                     $44,059 No Change                                                                       $          32,589 
                           Field Change Order (5%)                      $55,074 No Change                                                                       $          40,736 
                                          Subtotal:                 $ ,
                                                                    $1,211,619 N/A
                                                                           ,    N/A                                                                             $
                                                                                                                                                                $        896,198 
                                                                                                                                                                               ,
                            PS&E Contingency (5%)                       $60,581 No Change                                                                       $          44,810 
                                              Total:                $1,272,200 N/A                                                                              $        941,007 


                                                                                                                                                                                       35
Parks O
P k & Open S
           Space
                                                                    How              Who
           Where                         What

                   Area /            Primary Green 
                                                          Implementation Strategy  
 Program        Impervious     Infrastructure Technology                            Owner
                                                                   (5)
                 Source (1)
                 Source (1)                (2) 
                                           (2)


               Parks (including 
                                 Disconnection into Park   Develop Park Green Plan   Parks
              adjacent Streets)
              adjacent Streets)

                                                          Delineate Drainage Area, 
                                  Use natural area & 
               Stream Inflow                              monitor & update model 
02‐Parks &                    drainage to detain/remove                              Parks
                  Removal                                (e.g. Thorden Park; Colvin 
Open Space                              inflow
                                                         St. / Oakwood Cementary)

                Stormwater 
                                 Constructed Wetland         Feasibility Studies     OCWEP
                   Areas

                Vacant Lots     Urban Forestry/Gardens      Vacant Land Strategy     Parks

                                                                                             36
CSO Treatment Wetland Project
                           CSO 018


                           Constructed
                           Wetland


                           Harbor
                           Brook


                                     37
Treatment Wetland Eliminates CSO 018

• 144 Acre CSO b i
      A         basin
• 40 overflows / year
• Significant Nutrient
  Removal
• Partner with SUNY ESF


                                   38
Courts 4 Kids connects
green to kids and area
sports icons

• Skiddy Park Porous
  Basketball Court
• P bli P i t P t
  Public-Private Partnership
                         hi
  ▫ Jim Boheim Foundation
  ▫ Courts4Kids
  ▫ CCarmello A th
           ll Anthony
     Foundation
• 11,000 sq ft porous asphalt


                                39
Incentivize GI: Green
Improvement Funds (GIF)
stimulates commercial
investment in green
    46   Applications
    32   Approved
    19   Projects under contract
     7   Projects Completed 2010                     King & King, Syracuse, NY
     6   Projects Completed 2011


         Where
         Wh                 What
                            Wh t             How         Who               How Much
                                                                           How Much
             Area /    Primary Green                              Target CSO    Target CSO Volume 
                                       Implementation 
   Program Impervious  Infrastructure                    Owner    Reduction      Reduction (% of 
                                           Strategy  
             Source     Technology                               Volume (gal)          Total)
  08‐Green 
  08 Green                                Review / 
                                          Review /
Improvement    All           All         Administer /    OCWEP   11,372,000            5%
  Fund (GIF)                            Track Awards

                                                                                                     40
Tracking Database records key compliance
information and green cost d
  f           d            data


                                           41
Program Implementation Status -
                       g      p
                    9/26/2011 and Projected CSO Capture
              250
                                                                                                       247         • 13 Projects Completed
                                                Cumulative
                                                                                                 224               • 23 Projects Under Construction
                                                Capture                               202
                                                                                                                   • 8 Projects in Contract Phase
             200
                                                                           180                                     • 44 GI Projects Achieved and
                                                                                                                     Counting !
                                                                                                                           i
                                                                158
                150
                                                     136
CS Reduction (MG)


                                                                                                                   • 9 Projects in Bid Phase
                                          114                                                                      • 1 Projects in 90% Design Phase
           n


               100              92                                                                                 • 3 Projects in 50% Design Phase
                                                                                                                   • 3 Projects in Fieldwork Phase
                                     55                                                                            • 8 Projects to be Procured by
 SO


                    50
                           37                                                                                        Others
                                                                                                                     Oth
                                                           22         22         22         22         22
                                                22                                                            22   • 19 more projects under contract
                                                                                                                     through GIF
                    0
                         2010   2011      2012       2013       2014       2015       2016       2017       2018   •
                                                                                                                   • 100+ Projects in Concept Phase


                                                                                                                                                   42
Program Implementation Status


                                43
Thank You!
             Questions ?
          Please Visit us at
         www.SaveTheRain.us

Marengo lid symposium_2011-09-25

  • 1.
    Onondaga County, NewYork Save the Rain Program - Implementation Lessons Learned from Nations 1st Green CSO Court Order Joanne M. Mahoney, County Executive LID S Symposium - Phil d l hi PA i Philadelphia, September 27th, 2011 Matthew Millea, Deputy County Executive, Onondaga County Brian Marengo, Matthew Marko, Rita Fordiani, Andrew Potts, Dan Wible CH2M HILL
  • 2.
    Onondaga County, g y, City f Syracuse Cit of S New York Onondaga Lake Onondaga Creek • 7,660 acres • 49 CSOs Harbor Brook • ~1 Billion gallons/year CSO g /y 2
  • 3.
    • 1988 –Atlantic States Legal Foundation files lawsuit against County History • 1989 – Litigation settled through METRO consent judgment Onondaga Lake Facts • 1998 – METRO consent judgment replaced with Amended Consent Watershed: 285 Square Miles Judgment (ACJ) 1 Mile Wide – 4.6 Miles Long • 1st ACJ amendment May 1998 • 2006 ACJ Amended to include Average Depth: 35 feet g p consolidation of ammonia and phosphorus treatment and Harbor Max Depth: 63 feet Brook conveyances and RTF y 1940 – Swimming Banned • 3rd Amendment April 2008 (Extension) • 2009 ACJ amended to authorize use of 1970 – Fishing Banned Gray and Green infrastructure 3
  • 4.
    ACJ Compliance ProjectsCompleted to Date (1998-2008) (1998- Total Investment: $367 million 1. Aeration System Upgrade y pg 21. Siphon Rehabilitation p 2. Odor Control - residual handling and clarifiers 22. Teall Brook FCF 3. Chemical Storage Building and Feed System 23. West St. Sewer Separation (CSOs 057, 058, 059) 4. Digester and Lagoon Improvements 24. Water St. Sewer Separation (CSO 024) 5. Phase II Plant Improvements 25. Brighton Sewer Separation (CSOs 053, 054) 6. Ammonia Removal Pilot l l 26. 6 Ammonia Source Trackdown Program A i S kd 7. Phosphorus Removal Pilot – Phase I 27. Tallman/Onondaga Sewer Separation (CSOs 038, 040, 8. Digital System Upgrade 046a and 046b) 9. Ammonia Removal – BAF 28. Midland Phase II (includes Regional Storage and Treatment Facility plus 1,000 ft. pipeline) 10. Phosphorus Removal – HRFS 29. Phosphorus Removal Pilot – Phase II 11. CSO Toxicity Evaluation Report 30. Biosolids Handling (mechanical thickeners) 12. Erie Boulevard Storage System Upgrade Improvements – Metro 13. Franklin St. FCF 31. South Ave./Bissell St. Sewer Separation (CSOs 047 and 14. Harbor Brook FCF 048) 4 ) 15. Hiawatha RTF 32. Sewer Separation 050 – Parkway/Rockland 16. Kirkpatrick St. Pump Station Upgrade 33. Clinton Conveyances Phase 1 – pipeline outside the 17. Maltbie St. FCF Trolley Lot & Armory Square 18. Midland Phase I Pipeline 34. Clinton Conveyances Phase 2A – pipeline behind the 19. 19 Newell St. Pilot Disinfection St MOST under RR 20. Onondaga Creek FCF - Boat 35. Sewer Separation 051 – Colvin Avenue 4
  • 5.
    Water Quality Improvements Q y p Phosphorus Phosphorus discharge from METRO to Onondaga Lake has decreased from over 300 pounds per day to approximately 50 pounds per day 5
  • 6.
    4th ACJ AmendmentAuthorized a Balanced Approach to CSO Abatement Regulatory Goals Community Impacts/Goals • Capture and Treat 95% of the • Improve quality of life Annual CSO Volume via Gray y • Promote Sustainability & Green Infrastructure • Ensure cost effectiveness in • Achieve water quality compliance with ACJ standards in tributaries and milestones lake Major Milestones • 89.5% capture/elimination by 12/31/2013 • 95% capture/elimination by 12/31/2018 p / y / / 6
  • 7.
    Save the RainProgram 7
  • 8.
    Everyone is forGreen Infrastructure… Until they’re Not - Program Modifications 1. Establish a Forum to resolve policy decisions, remove barriers, modify regulations and standardize design details and maintenance agreements 2. D Demonstrate k t h l i on P bli L d th t can t t key technologies Public Lands that scale up to widespread progress 3 3. Incentivize GI (e.g. Green Improvement Funds) ( g p ) 4. Add Green Infrastructure onto existing capital projects 8
  • 9.
    Project Development Process j p Project Concept Development Environmental Assessment Survey ment Infiltration Testing Procurem Design Owner Approval pp Yes Permitting (Y/N) Revise Construction Concept SDCs No Evaluate / Remove Policy Barriers Bi Weekly Bi-Weekly City / County Projects by j y Project Tracking Meeting Others 9
  • 10.
    6% Capture UsingGreen Infrastructure p g - Green 470 acres and reduce 247 MG/yr of CSO by 2018 10
  • 11.
    Green Infrastructure Programsmatched to Impervious A I i Area T Types t plan scaling f widespread to l li for id d implementation Impervious Area Green Infrastructure Type Technologies g Flat Roof Buildings Vegetated Roof g Parking Areas & Porous Pavements, Bioretention Sidewalks Green Streets (Bioretention, Street (Bioretention Roadways R d Trees) Downspout Disconnection Residential Rooftops Rain Barrels & Cisterns Rain Gardens County Facilities & Combination of the Above Schools Technologies 11
  • 12.
    GI Program MatrixMaps Implementation g p p Strategies to results • St t Streets • Parks & Open Space • Parking • Public Facilities • Roofs • Drainage area & Model Refinements • Private Lands ▫ GIF ▫ Ordinance ▫ Rate Incentive ▫ Strategic Partners 12
  • 13.
    Implementation Program Development p g p Framework Review Evaluate Adapt Program Where What How Who How Much Primary GI Target Impervious Technology Implementation Owner Reduction Area A (e.g. Rain ( g R i Strategy St t g / Status Garden) Public Outreach & Partnering Projects Private Planning & Engineering Resource Management Procurement Field Survey / Environmental y Tracking & Monitoring 13
  • 14.
    Parking g How Who How Much Where What Target  Target CSO  CSO  Area /  Primary Green  Implementation Strategy   Implementation Strategy Reduction  Volume  Reduction Volume Program Impervious  Infrastructure  Owner (5) Volume  Reduction  Source (1) Technology (2)  (gal) (% of  Total) 03‐ Reconstruct City/County  Parking ‐ Public Porous Pavement City/County 6,510,000 3% Parking Lots 14
  • 15.
    2010 Projects Parking Lots- City Lot #21 15
  • 16.
    Dept. of TransportationLot –Porous Asphalt p p p Before 16
  • 17.
    Dept. of TransportationLot –Porous Asphalt p p p AFTER 17
  • 18.
  • 19.
  • 20.
    DOT owner, Citymanaged, County designed and financed 20
  • 21.
    City L t CitLot #3 - B f Before 21
  • 22.
    City Parking Lot#3 y g After Construction Porous Concrete Captures over 628,000 gallons of stormwater annually 22
  • 23.
    Townsend Parking Lot( Lot B ) & (“Lot B”) Townsend Median 23
  • 24.
    Asphalt Lot withInfiltration Trenches CSO reduction 692,000 gallons/year Bid $342,000 $0.51/gallon 24
  • 25.
    Public Facilities How Who How Much Where What Target CSO  Primary Green  Primary Green Target CSO  Volume  Target CSO Volume Area / Impervious  Implementation  Program Infrastructure  Owner Reduction  Reduction  Source (1) Strategy  (5) Technology (2)  Volume (gal) (% of  Total) School District,  School District SCSD Public Schools All Reconstruction program 04‐Public  Partner Programs ESF, Other 14,003,000 6% Facilities Owner Redevelopment  p Green Roof, Capture  G R f C t Facilities F iliti County Facilities Schedule Reuse Libraries Facilities 25
  • 26.
    Onondaga County Civic Strip GreeningCounty Facilities Utilizing Multiple Green Infrastructure p Technologies Showed to judge in 2009 Completed or in construction 26
  • 27.
    Green Infrastructure 2011 Signature Projects OnCenter Convention Center 60,000 sq ft. Green Roof 60 000 ft 27
  • 28.
  • 29.
    Onondaga County Civic Strip GreeningCounty Facilities Utilizing Multiple Green Infrastructure p Technologies Showed to judge in 2009 Completed or in construction 29
  • 30.
    OnCenter War Memorial Water Reuse GI Technology: Rain cistern Project Owner: County Capture Area: C t  A 44,000 square feet    f t Runoff Reduction: 400,000 gallons/yr Estimated Annual  Potable Water Savings: 127,000‐300,000 gallons 30
  • 31.
    Streets Where What How Who Area / Impervious  Primary Green  Program Implementation Strategy Owner Source Infrastructure Technology Residential /  Road and Utility  City DPW Commercial Roads /  Green Streets Improvement/Redevelopment Boulevards Greening the Grey OCWEP Dry Well/Infiltration  New York  Highways New York DOT Road R&R Program Trenches DOT 01‐ Streets Median & Traffic  Road and Utility  Bioretention City DPW y Islands Il d Improvement/Redevelopment I t/R d l t Sidewalk Reconstruction with new  Sidewalks Porous Pavement City DPW detail Road and Utility  Parks Streets/ROW (Ad Hoc) St t /ROW (Ad H ) Enhanced Street Trees E h d St t T Improvement/Redevelopment I t/R d l t Canopy Study Planting Plan Parks 31
  • 32.
    Connective Corridor Capture Area: Capture Area: 7.5 acres 7 5 acres Run‐off Reduction: 5,7 MG /year Construction Cost: $ $948,700 (bid) , ( ) $/gallon runoff removed $0.17   $ /gallon CSO removed   $0.26 32
  • 33.
    Linking with MajorTransportation Reconstruction g j p Creates Green Progress (Phase 1 - 10.4 Acres) Phase 1 – 10 4 Acres 10.4 Image – Barton & Loguidice 33
  • 34.
    Connective Corridor Image – Barton & Loguidice 34
  • 35.
    Connective Corridor –Green Balance Sheet B&L Cost  ITEM Rationale for requested adjustment Actual Bid (5/12/2011) Estimate ITEMS ADDED DUE TO GREEN INFRASTRUCTURE Storage Stone $298,500 $30/CY (Creekwalk bid) ‐ Assume $35 for a 17% contingency $        200,970  Additional Trees/Shrubs  Additional Trees/Shrubs $101 840 Bioretention removed from projects, deduct shrub costs from green.   p j , $101,840 Split tree costs of $46,000 between City and County g $          61,471  $ 61 471 Additional CU Soil $19,000 No Change $          23,000  Trench Drains $8,610 Trench Drains assumed to be necessary for bike path drainage $             8,200  6", 10", 24" & 36" Storage/Overflow Pipes (w/  deduction for underdrains) $170,795 No Change $          74,710  Additional Drainage Structures/Frame & Grates Addi i lD i S /F &G $78,750  $78 750 Reduce to reflect the the smaller inlets for GI $        117,222  $ 117 222 Adequate root volume for trees was a comment from City on original  Silva Cell $97,458 design prior to Silva Cell pilot. Green share of silva cells assumed at 75%  $        106,310  and share of tree costs assumed to be 50%. ITEMS MODIFIED AS A RESULT OF GREEN INFRASTRUCTURE 8" Asphalt to 8" Porous Concrete (Parking Lane) $63,350 Unit Cost difference too high.  Replace with $10/sq. ft. g p q $          21,240  Green infrastructure does not require grass areas to be converted to  porous pavers.  Therefore, a 50% cost share ($116,250) would appear  Regular Pavers/Top Soil & Seed to Porous Pavers  $172,350  more reasonable  $          95,046  Please clarify the assumption for 39% of total traffic control being  Work Zone Traffic Control $56,629 allocated to green.  The City indicated that as work preceded block to  block that traffic could be detoured around the block in progress $          66,806  Trench & Culvert Excavation $87,200 No Change $        131,634  Subbase Deduction for Storage Stone Deduction for Storage Stone  ‐$53,010 ‐$53 010 No Change $         (91,884) $ (91 884) Construction Subtotal: $1,101,472 N/A $        814,725  Survey (1%) $11,015 No Change $             8,147  Mobilization (4%) $44,059 No Change $          32,589  Field Change Order (5%) $55,074 No Change $          40,736  Subtotal: $ , $1,211,619 N/A , N/A $ $        896,198  , PS&E Contingency (5%) $60,581 No Change $          44,810  Total: $1,272,200 N/A $        941,007  35
  • 36.
    Parks O P k& Open S Space How Who Where What Area /  Primary Green  Implementation Strategy   Program Impervious  Infrastructure Technology  Owner (5) Source (1) Source (1) (2)  (2) Parks (including  Disconnection into Park Develop Park Green Plan Parks adjacent Streets) adjacent Streets) Delineate Drainage Area,  Use natural area &  Stream Inflow  monitor & update model  02‐Parks &  drainage to detain/remove  Parks Removal (e.g. Thorden Park; Colvin  Open Space inflow St. / Oakwood Cementary) Stormwater  Constructed Wetland Feasibility Studies OCWEP Areas Vacant Lots  Urban Forestry/Gardens Vacant Land Strategy Parks 36
  • 37.
    CSO Treatment WetlandProject CSO 018 Constructed Wetland Harbor Brook 37
  • 38.
    Treatment Wetland EliminatesCSO 018 • 144 Acre CSO b i A basin • 40 overflows / year • Significant Nutrient Removal • Partner with SUNY ESF 38
  • 39.
    Courts 4 Kidsconnects green to kids and area sports icons • Skiddy Park Porous Basketball Court • P bli P i t P t Public-Private Partnership hi ▫ Jim Boheim Foundation ▫ Courts4Kids ▫ CCarmello A th ll Anthony Foundation • 11,000 sq ft porous asphalt 39
  • 40.
    Incentivize GI: Green ImprovementFunds (GIF) stimulates commercial investment in green 46 Applications 32 Approved 19 Projects under contract 7 Projects Completed 2010 King & King, Syracuse, NY 6 Projects Completed 2011 Where Wh What Wh t How Who How Much How Much Area /  Primary Green  Target CSO  Target CSO Volume  Implementation  Program Impervious  Infrastructure  Owner Reduction  Reduction (% of  Strategy   Source Technology  Volume (gal) Total) 08‐Green  08 Green Review /  Review / Improvement  All All Administer /  OCWEP 11,372,000 5% Fund (GIF) Track Awards 40
  • 41.
    Tracking Database recordskey compliance information and green cost d f d data 41
  • 42.
    Program Implementation Status- g p 9/26/2011 and Projected CSO Capture 250 247 • 13 Projects Completed Cumulative 224 • 23 Projects Under Construction Capture 202 • 8 Projects in Contract Phase 200 180 • 44 GI Projects Achieved and Counting ! i 158 150 136 CS Reduction (MG) • 9 Projects in Bid Phase 114 • 1 Projects in 90% Design Phase n 100 92 • 3 Projects in 50% Design Phase • 3 Projects in Fieldwork Phase 55 • 8 Projects to be Procured by SO 50 37 Others Oth 22 22 22 22 22 22 22 • 19 more projects under contract through GIF 0 2010 2011 2012 2013 2014 2015 2016 2017 2018 • • 100+ Projects in Concept Phase 42
  • 43.
  • 44.
    Thank You! Questions ? Please Visit us at www.SaveTheRain.us