Downloaded 37 times

![WQv Short-cut Example
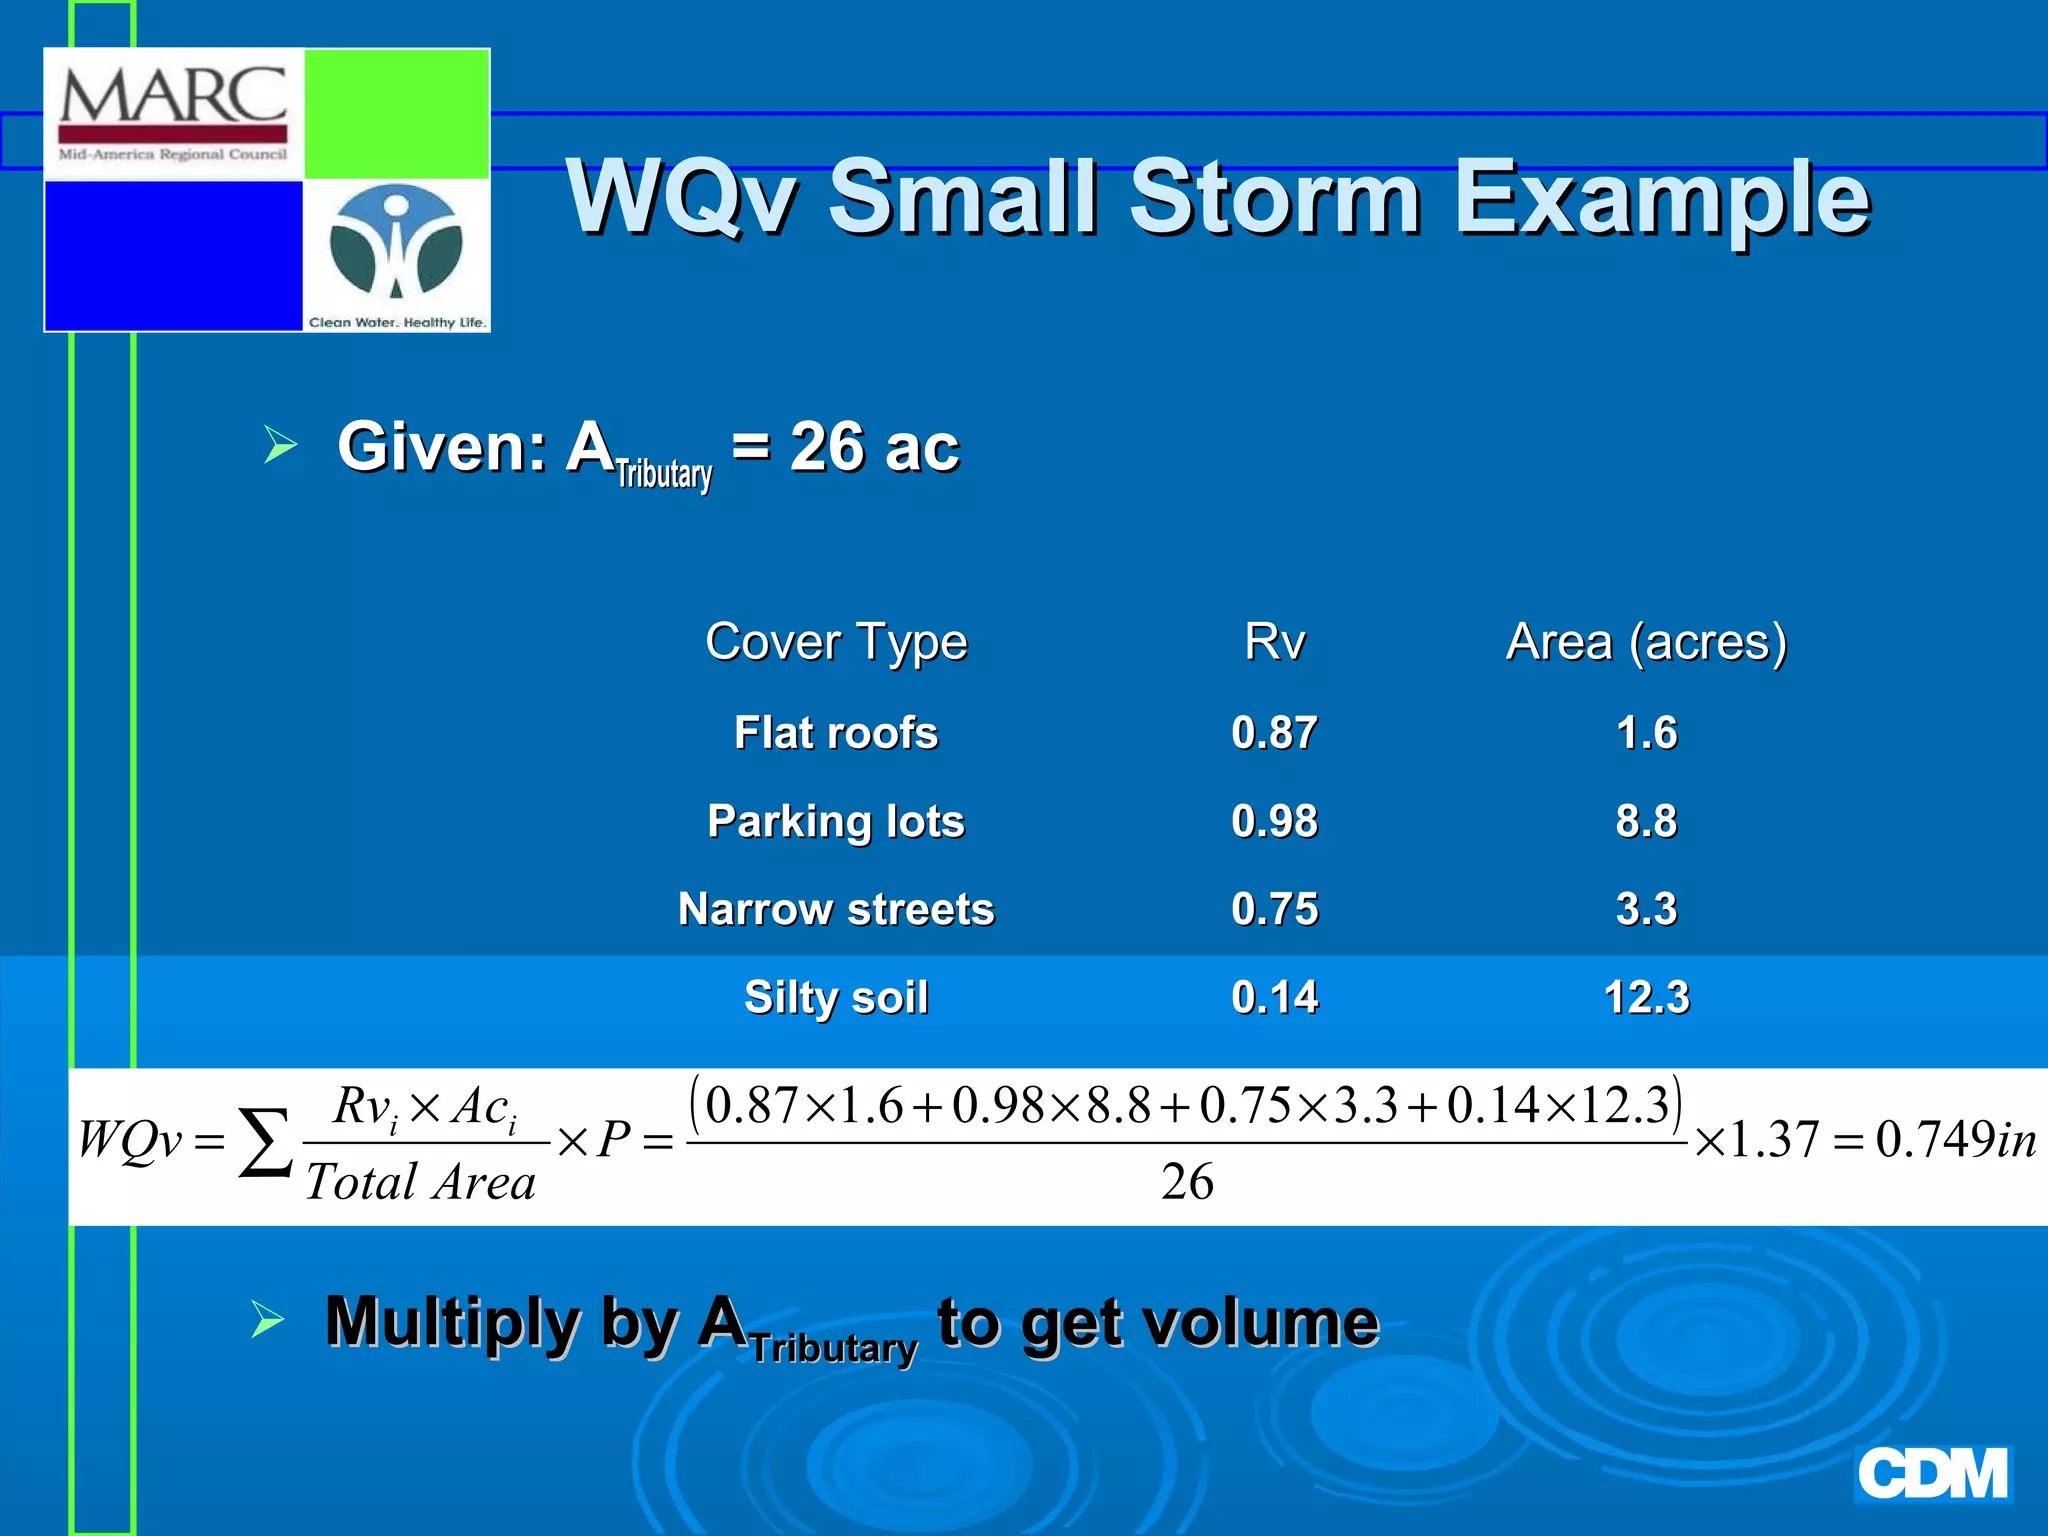
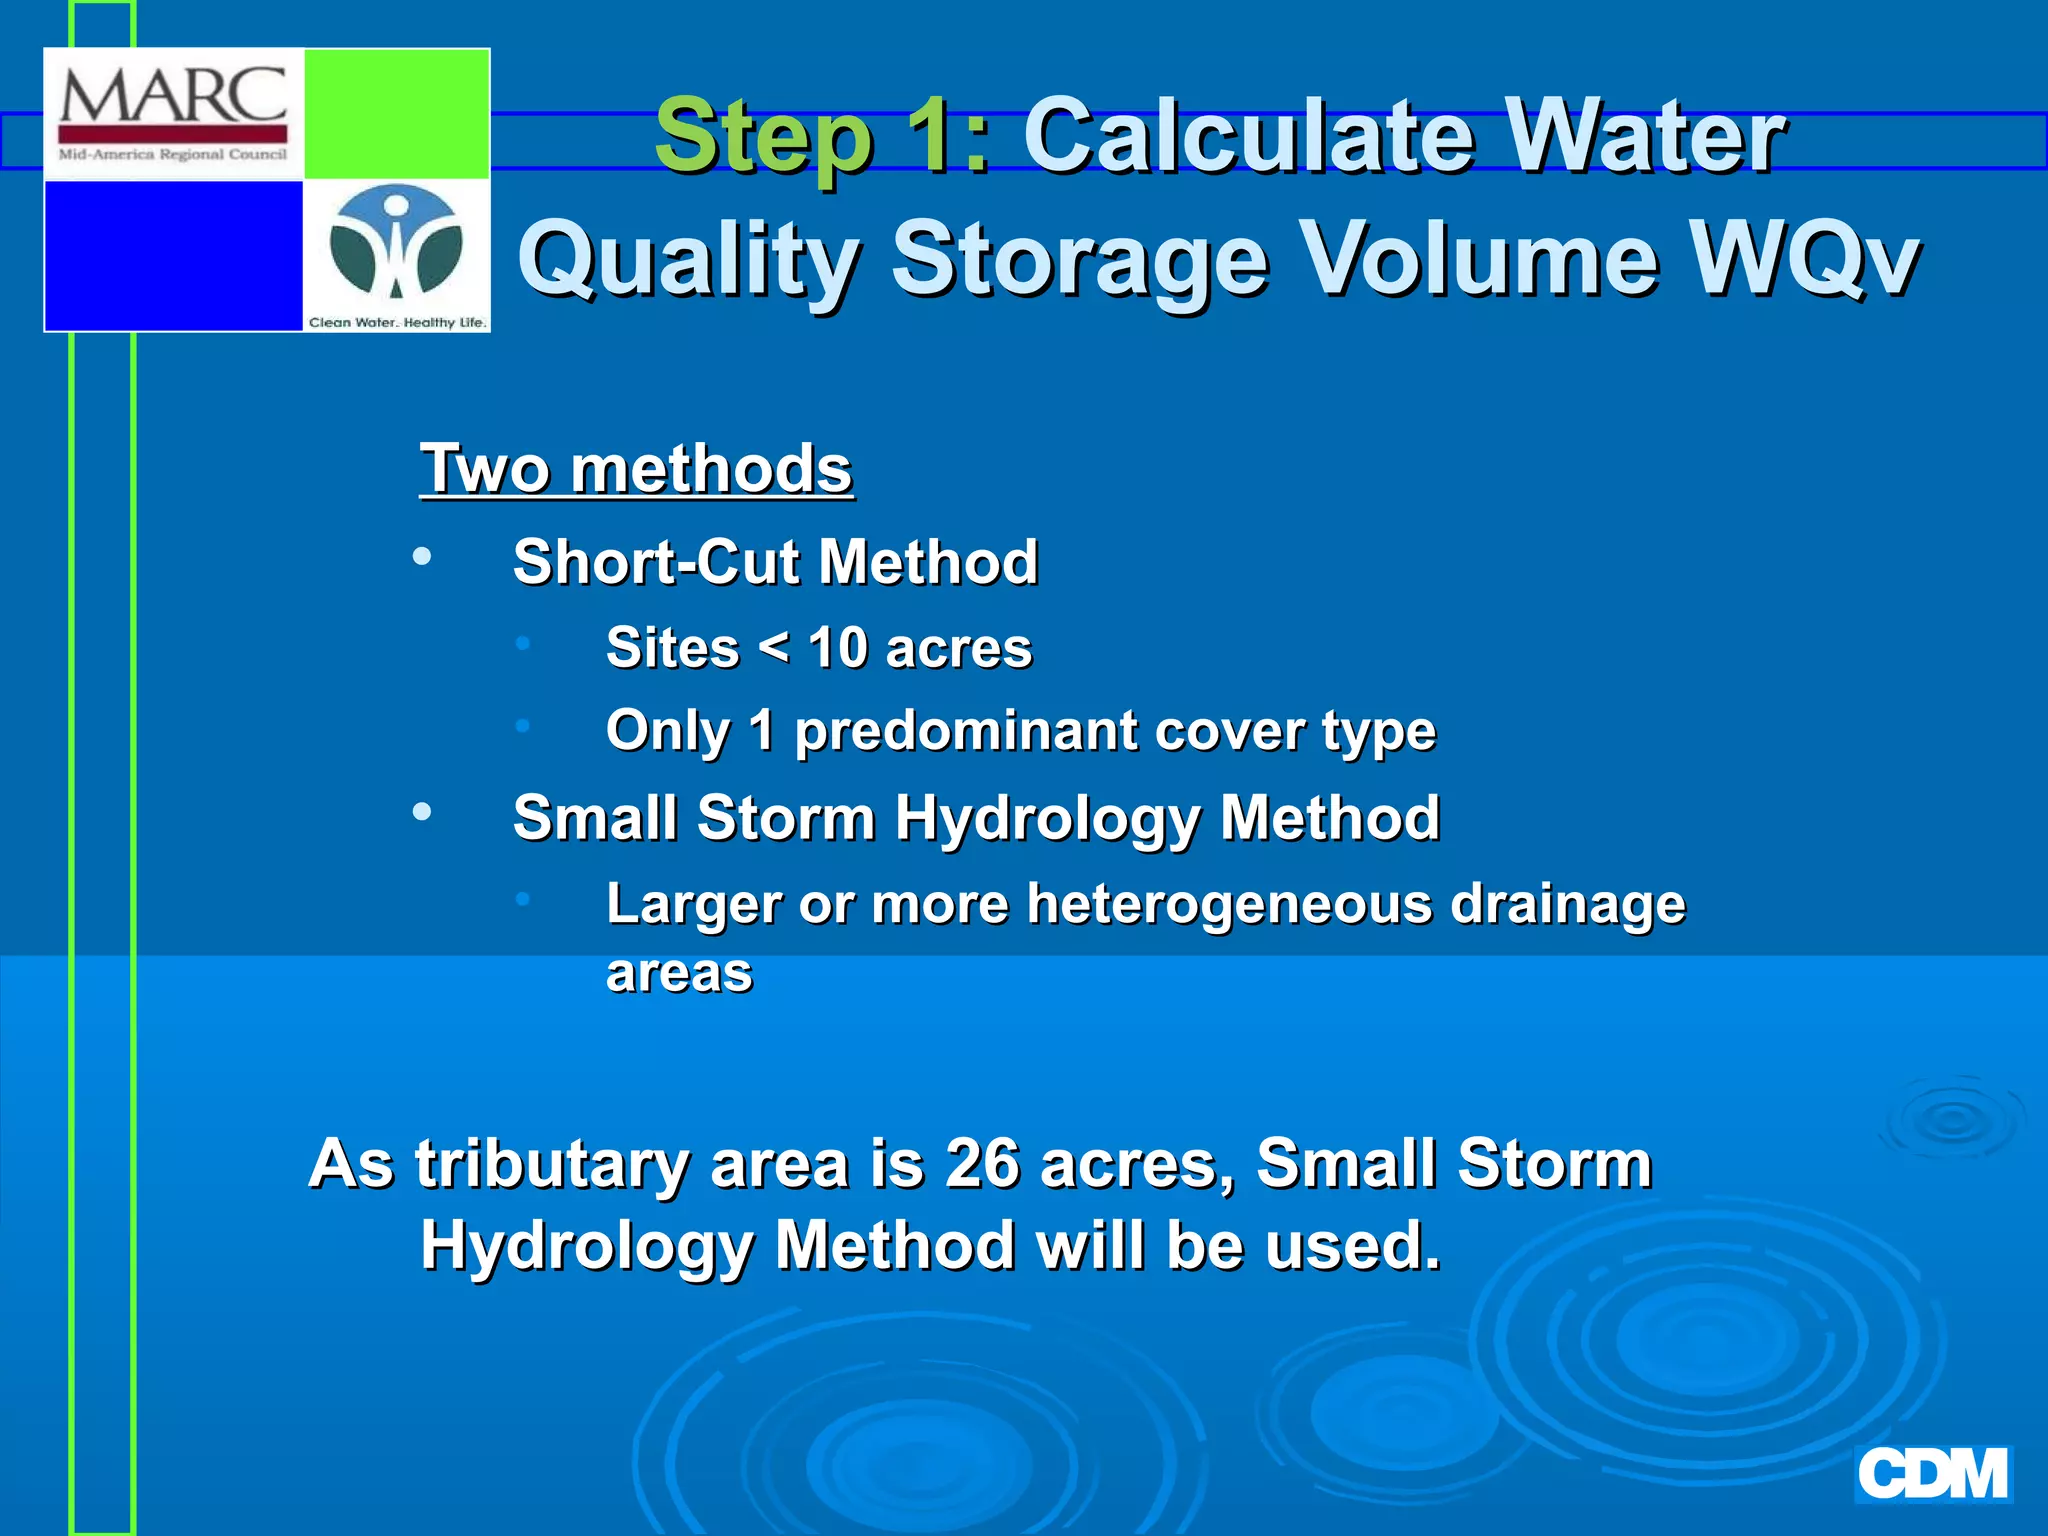
Given
Tributary area (ATributary) = 2.5 acres
%impervious = 80%
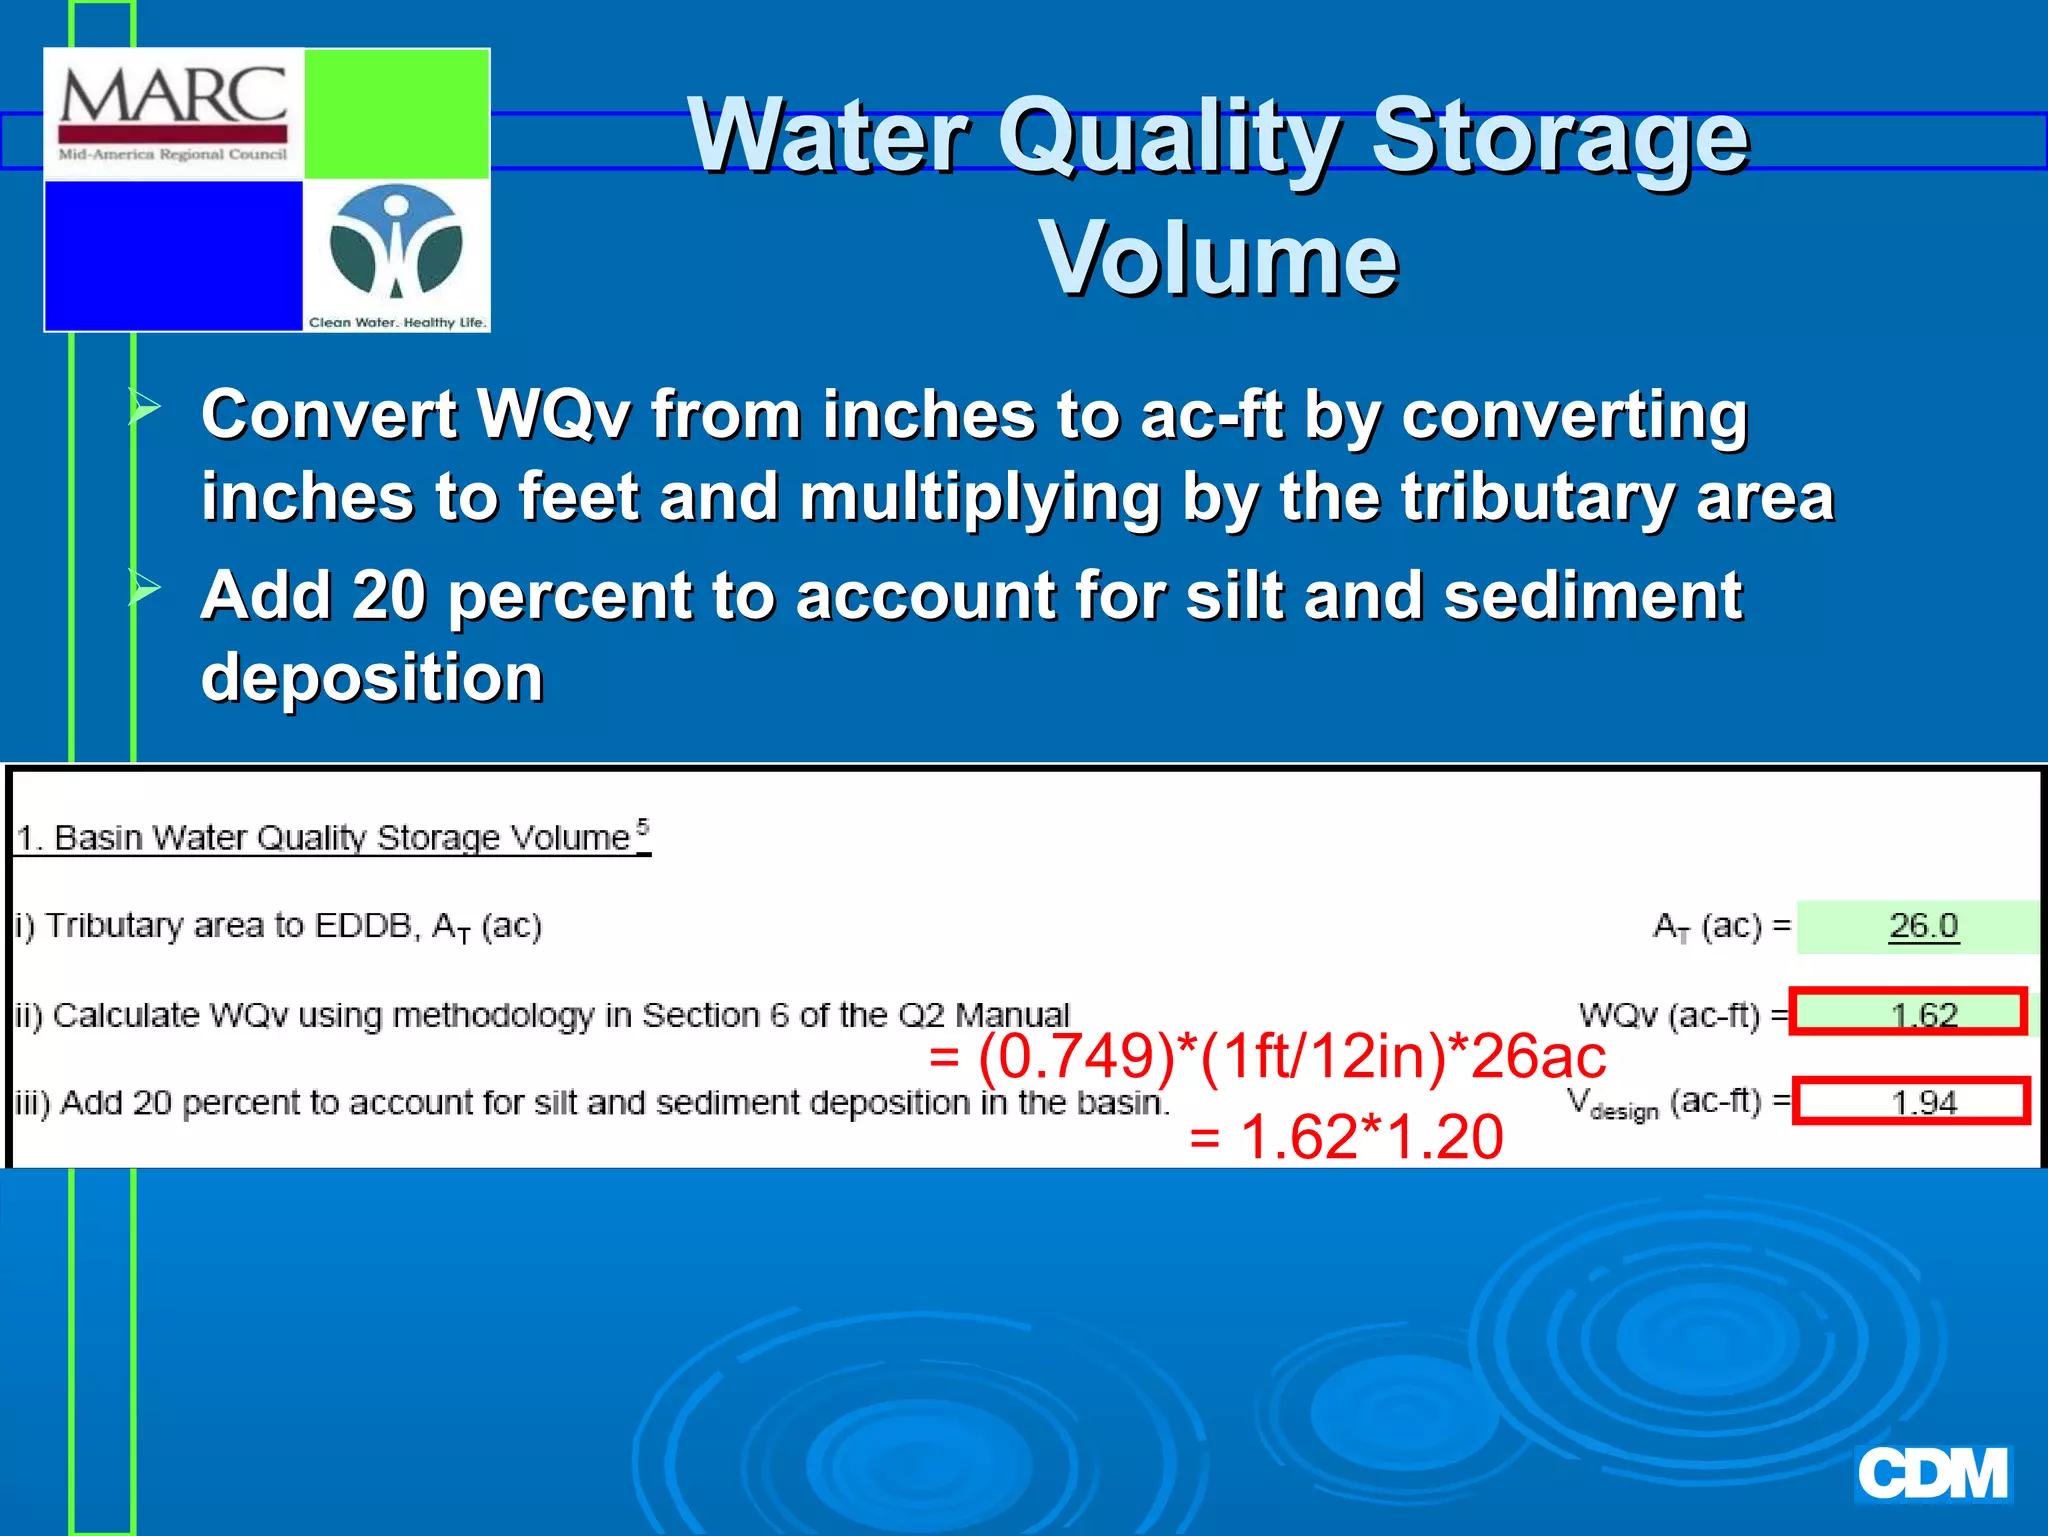
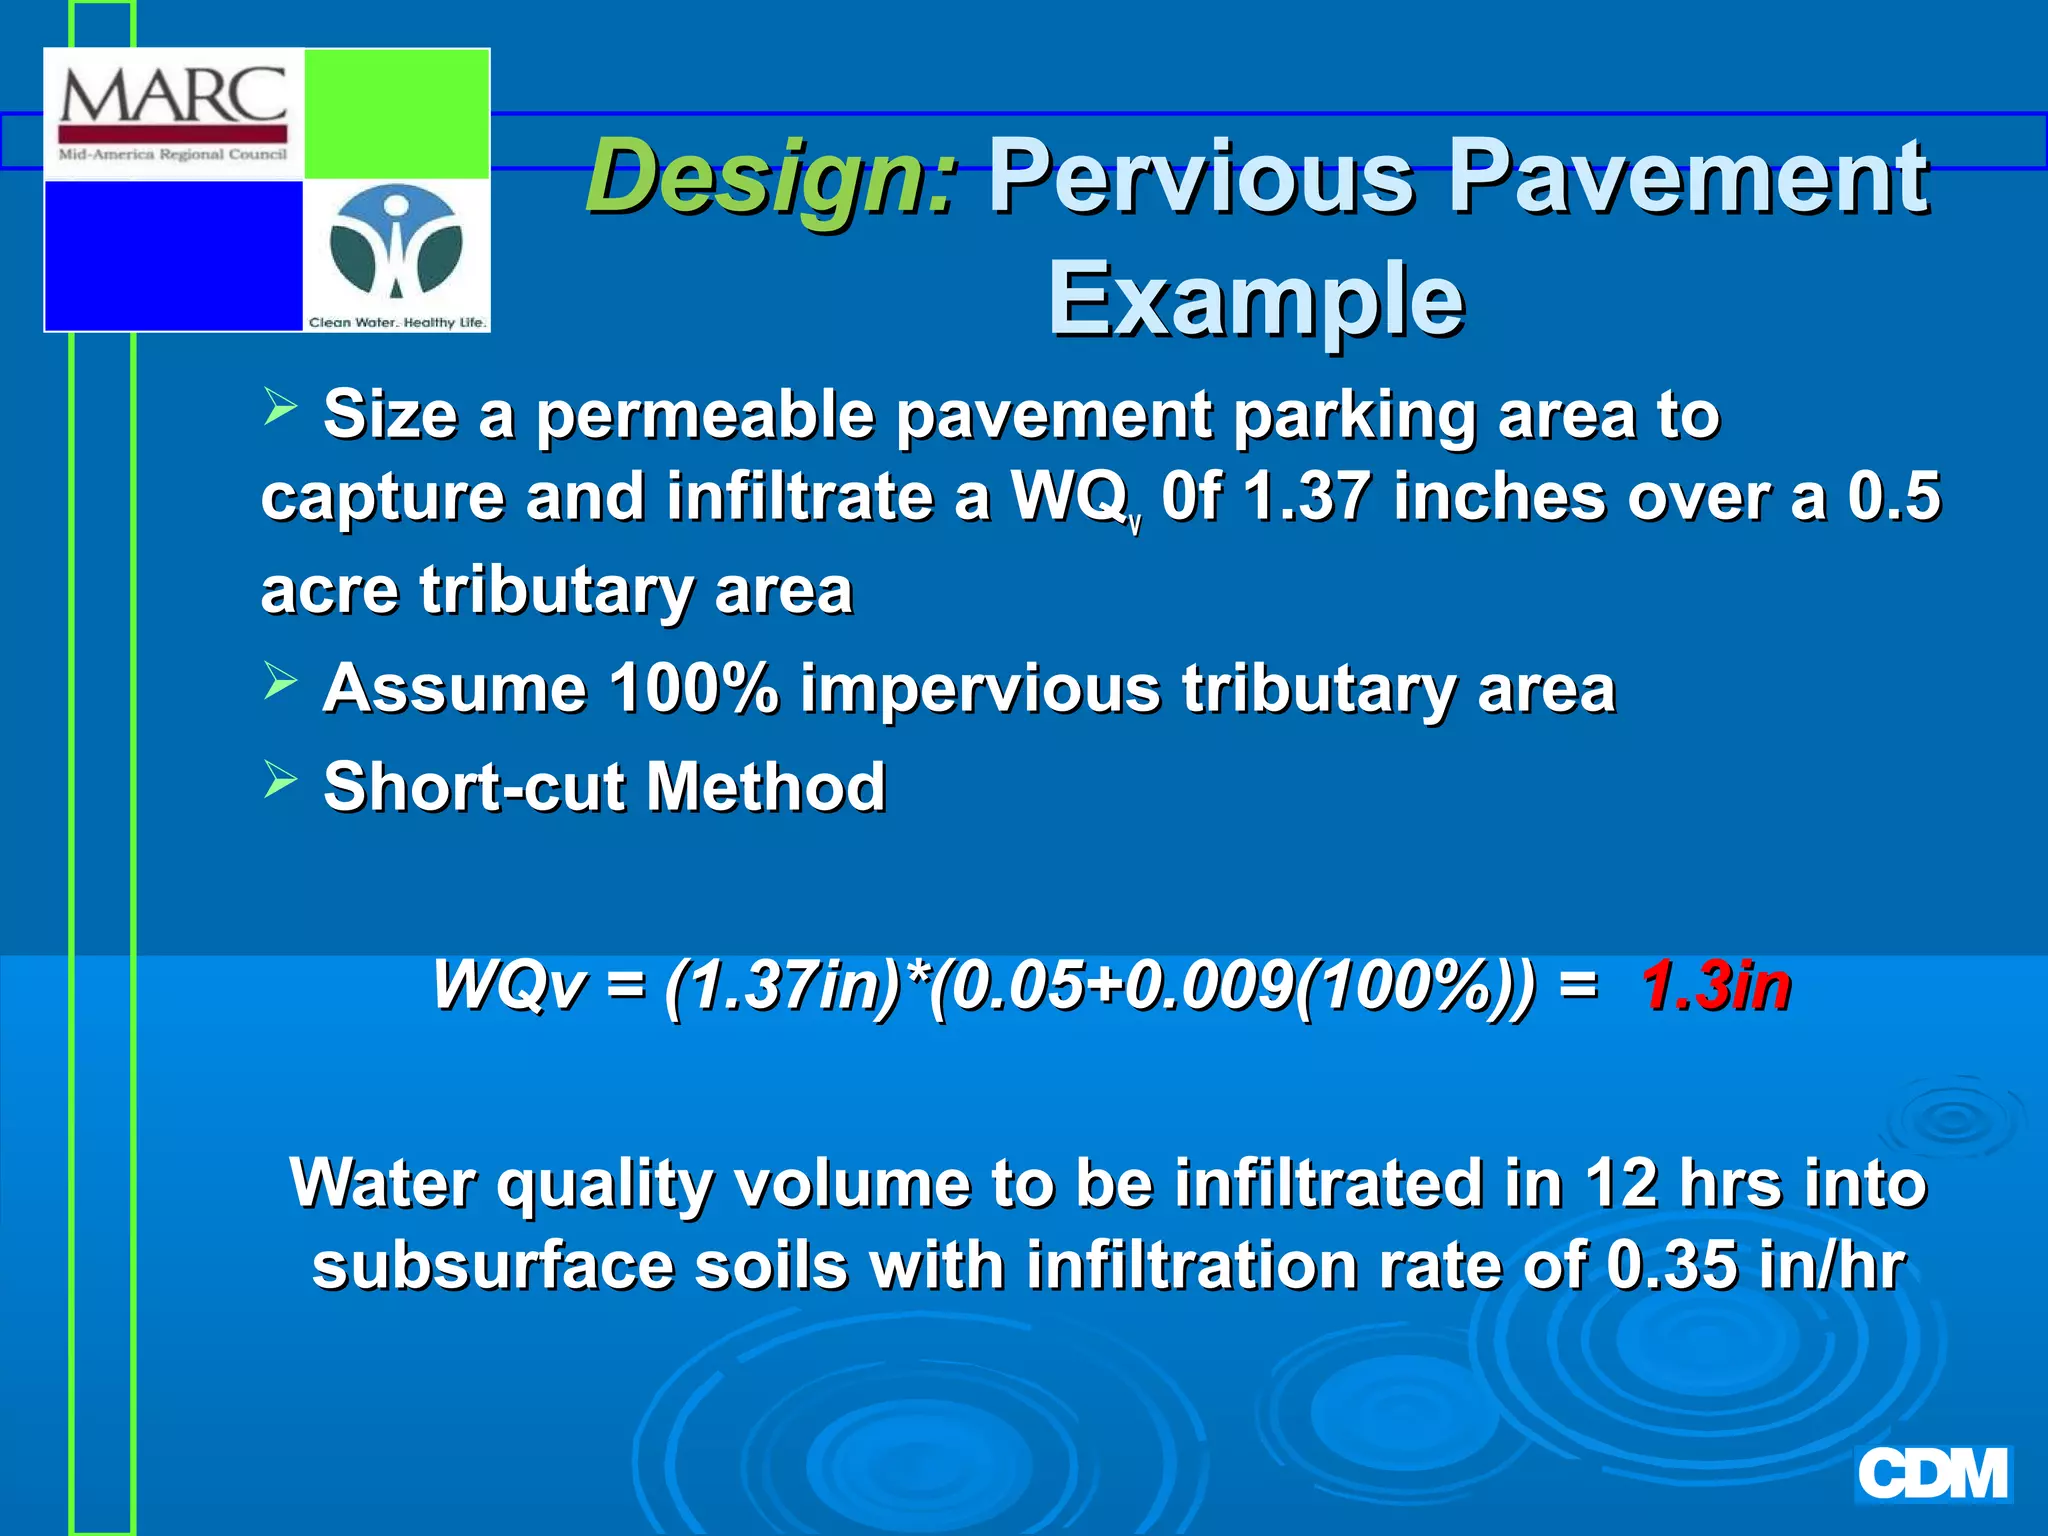
WQv = 1.37in * [0.05 + (0.009 * 80%)] = 1.06 in
Multiply by ATributary to get volume
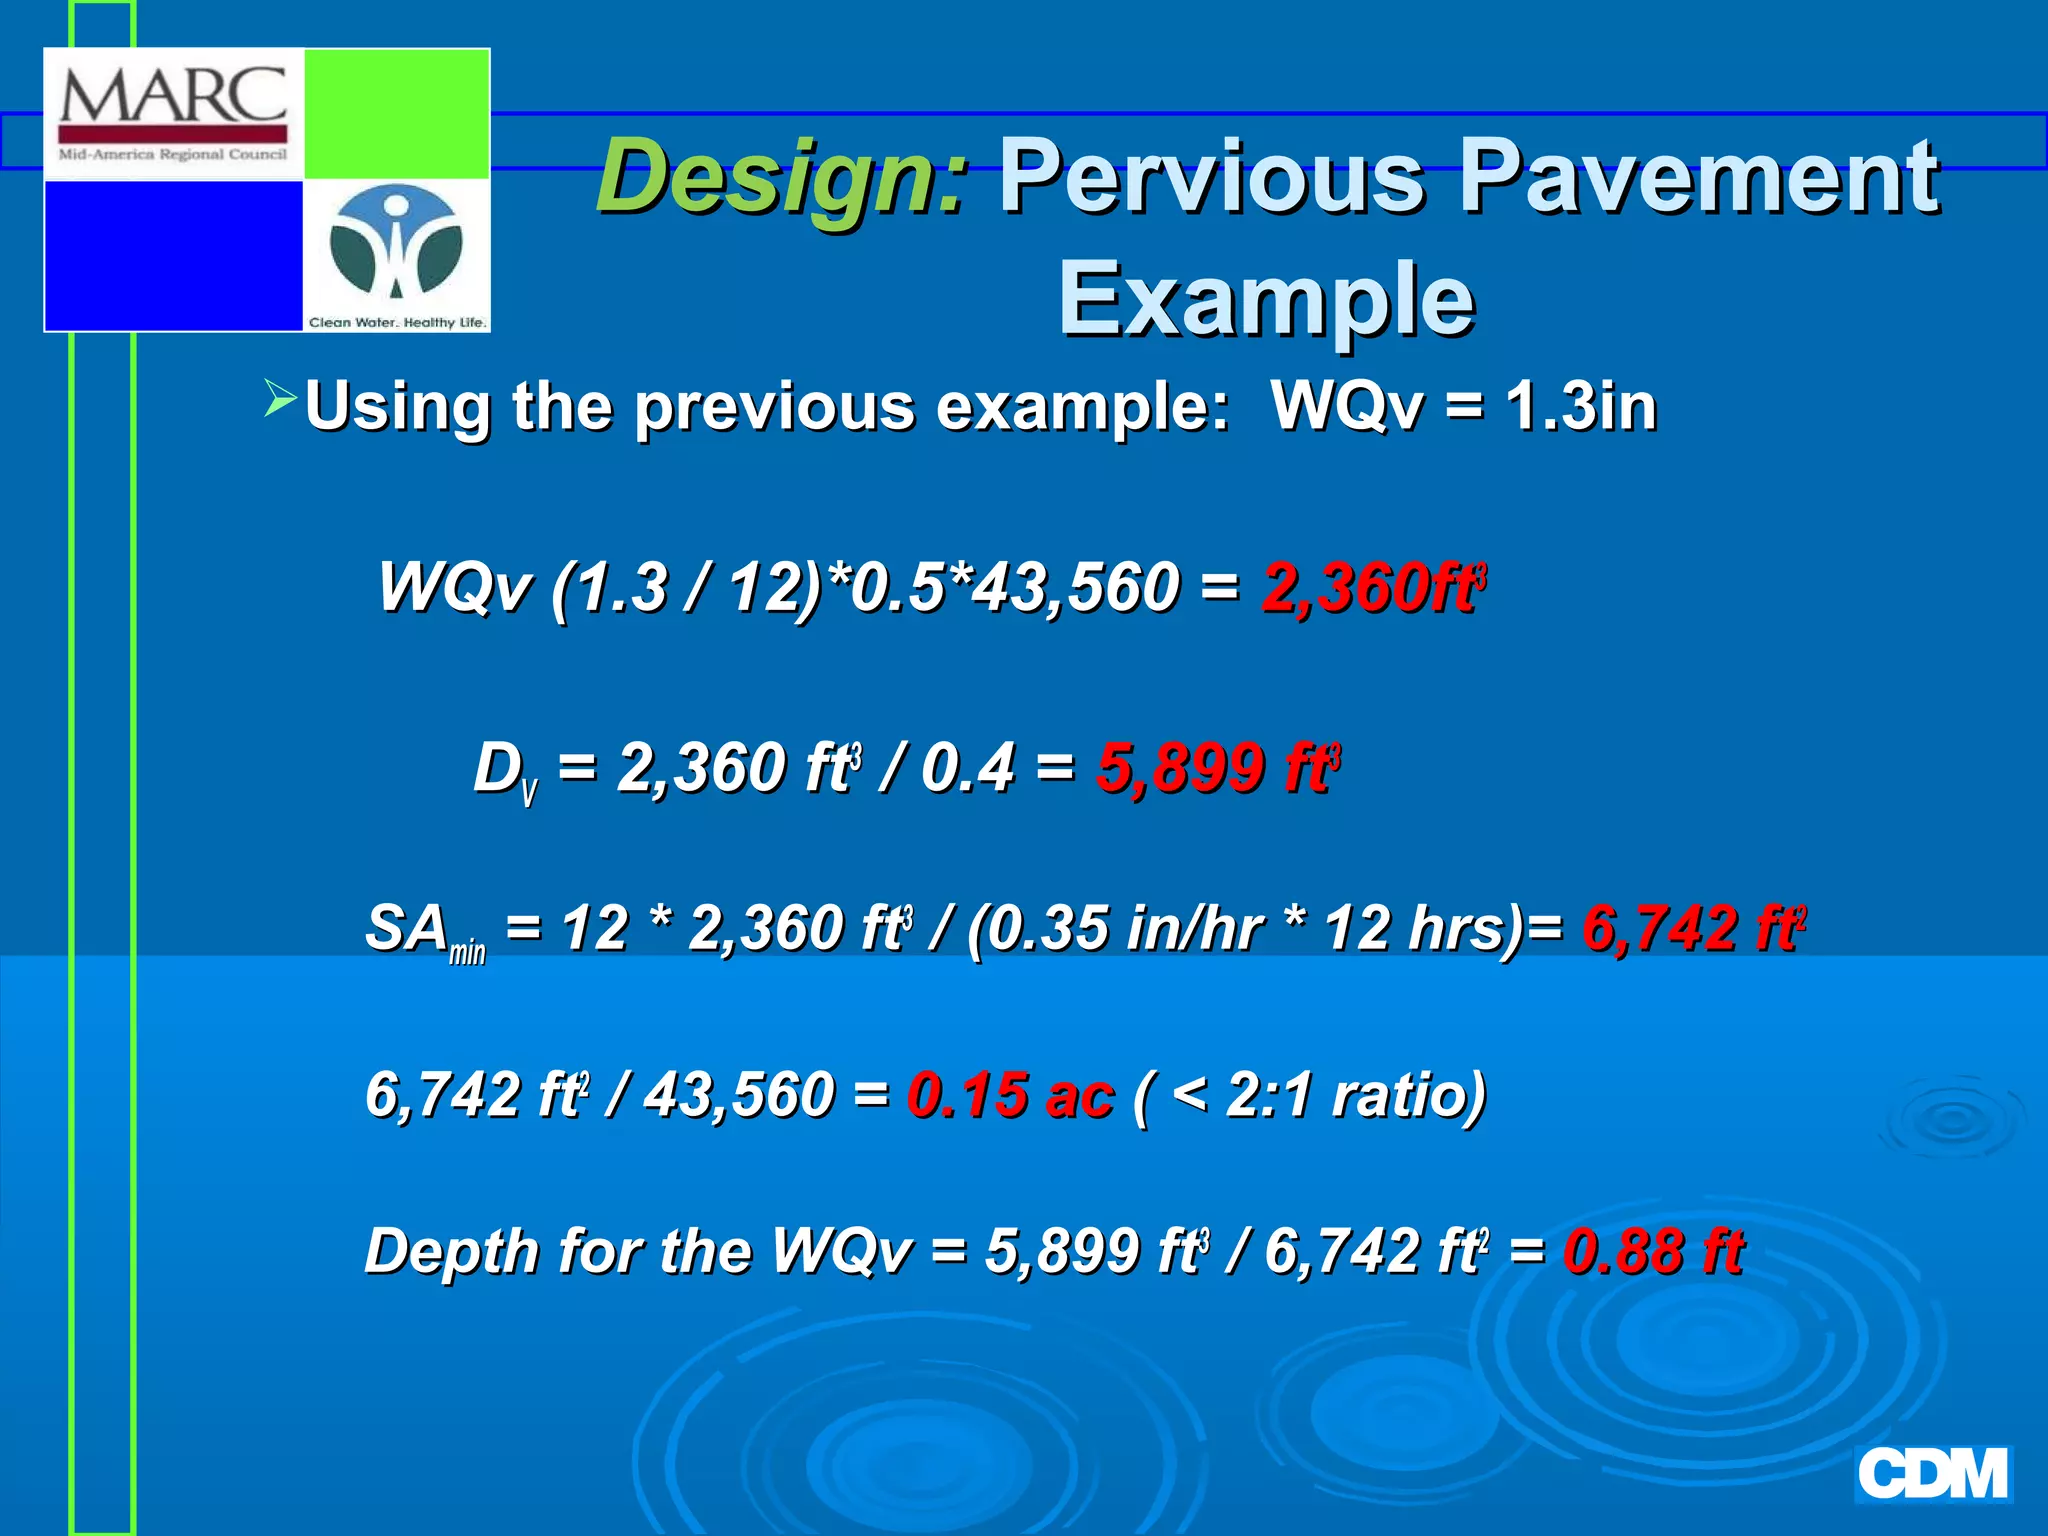
1.06 * 1ft/12in * 2.5 acres = 0.22 ac-ft
If only 50% impervious WQv = 0.14 ac-ft](https://image.slidesharecdn.com/2008-2009module4-140304121229-phpapp01/75/MARC-BMP-Manual-Training-Module-4-20-2048.jpg)


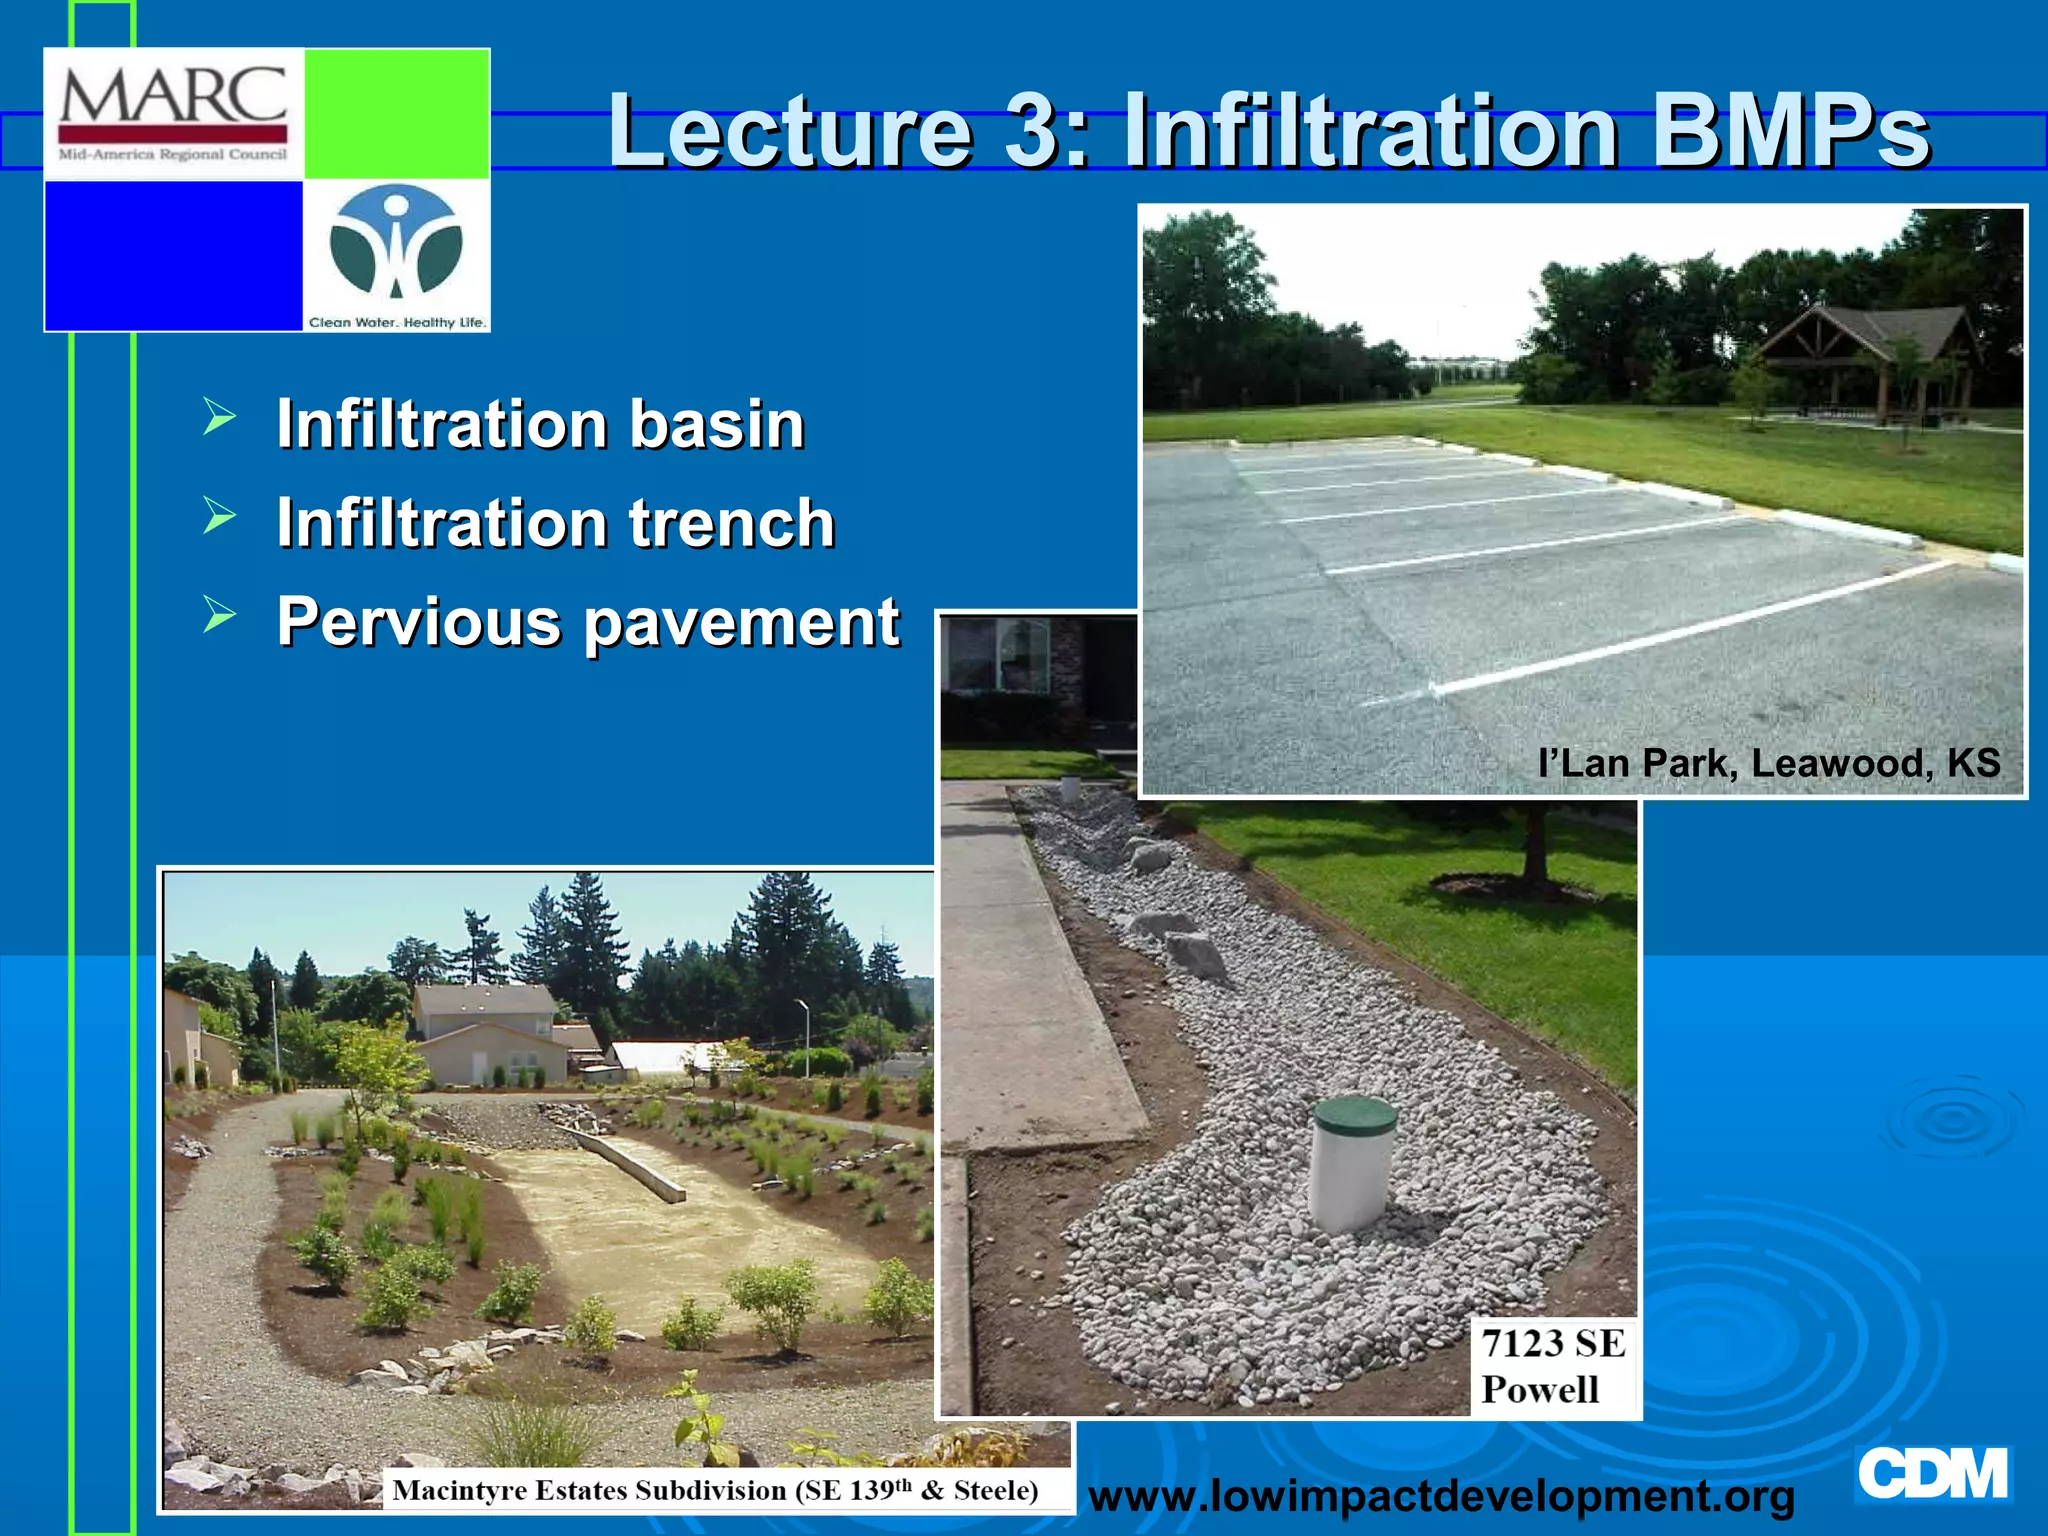


This document provides an overview and agenda for a training module on extended dry detention basins and infiltration practices. The first lecture reviews watershed planning concepts from Module 1 and introduces extended dry detention basins. The second lecture covers the design of extended dry detention basins through a design example and activity. The third lecture discusses infiltration practices including infiltration basins, trenches, and porous pavement. The training aims to explain structural best management practices for treating stormwater runoff.


