Download to read offline
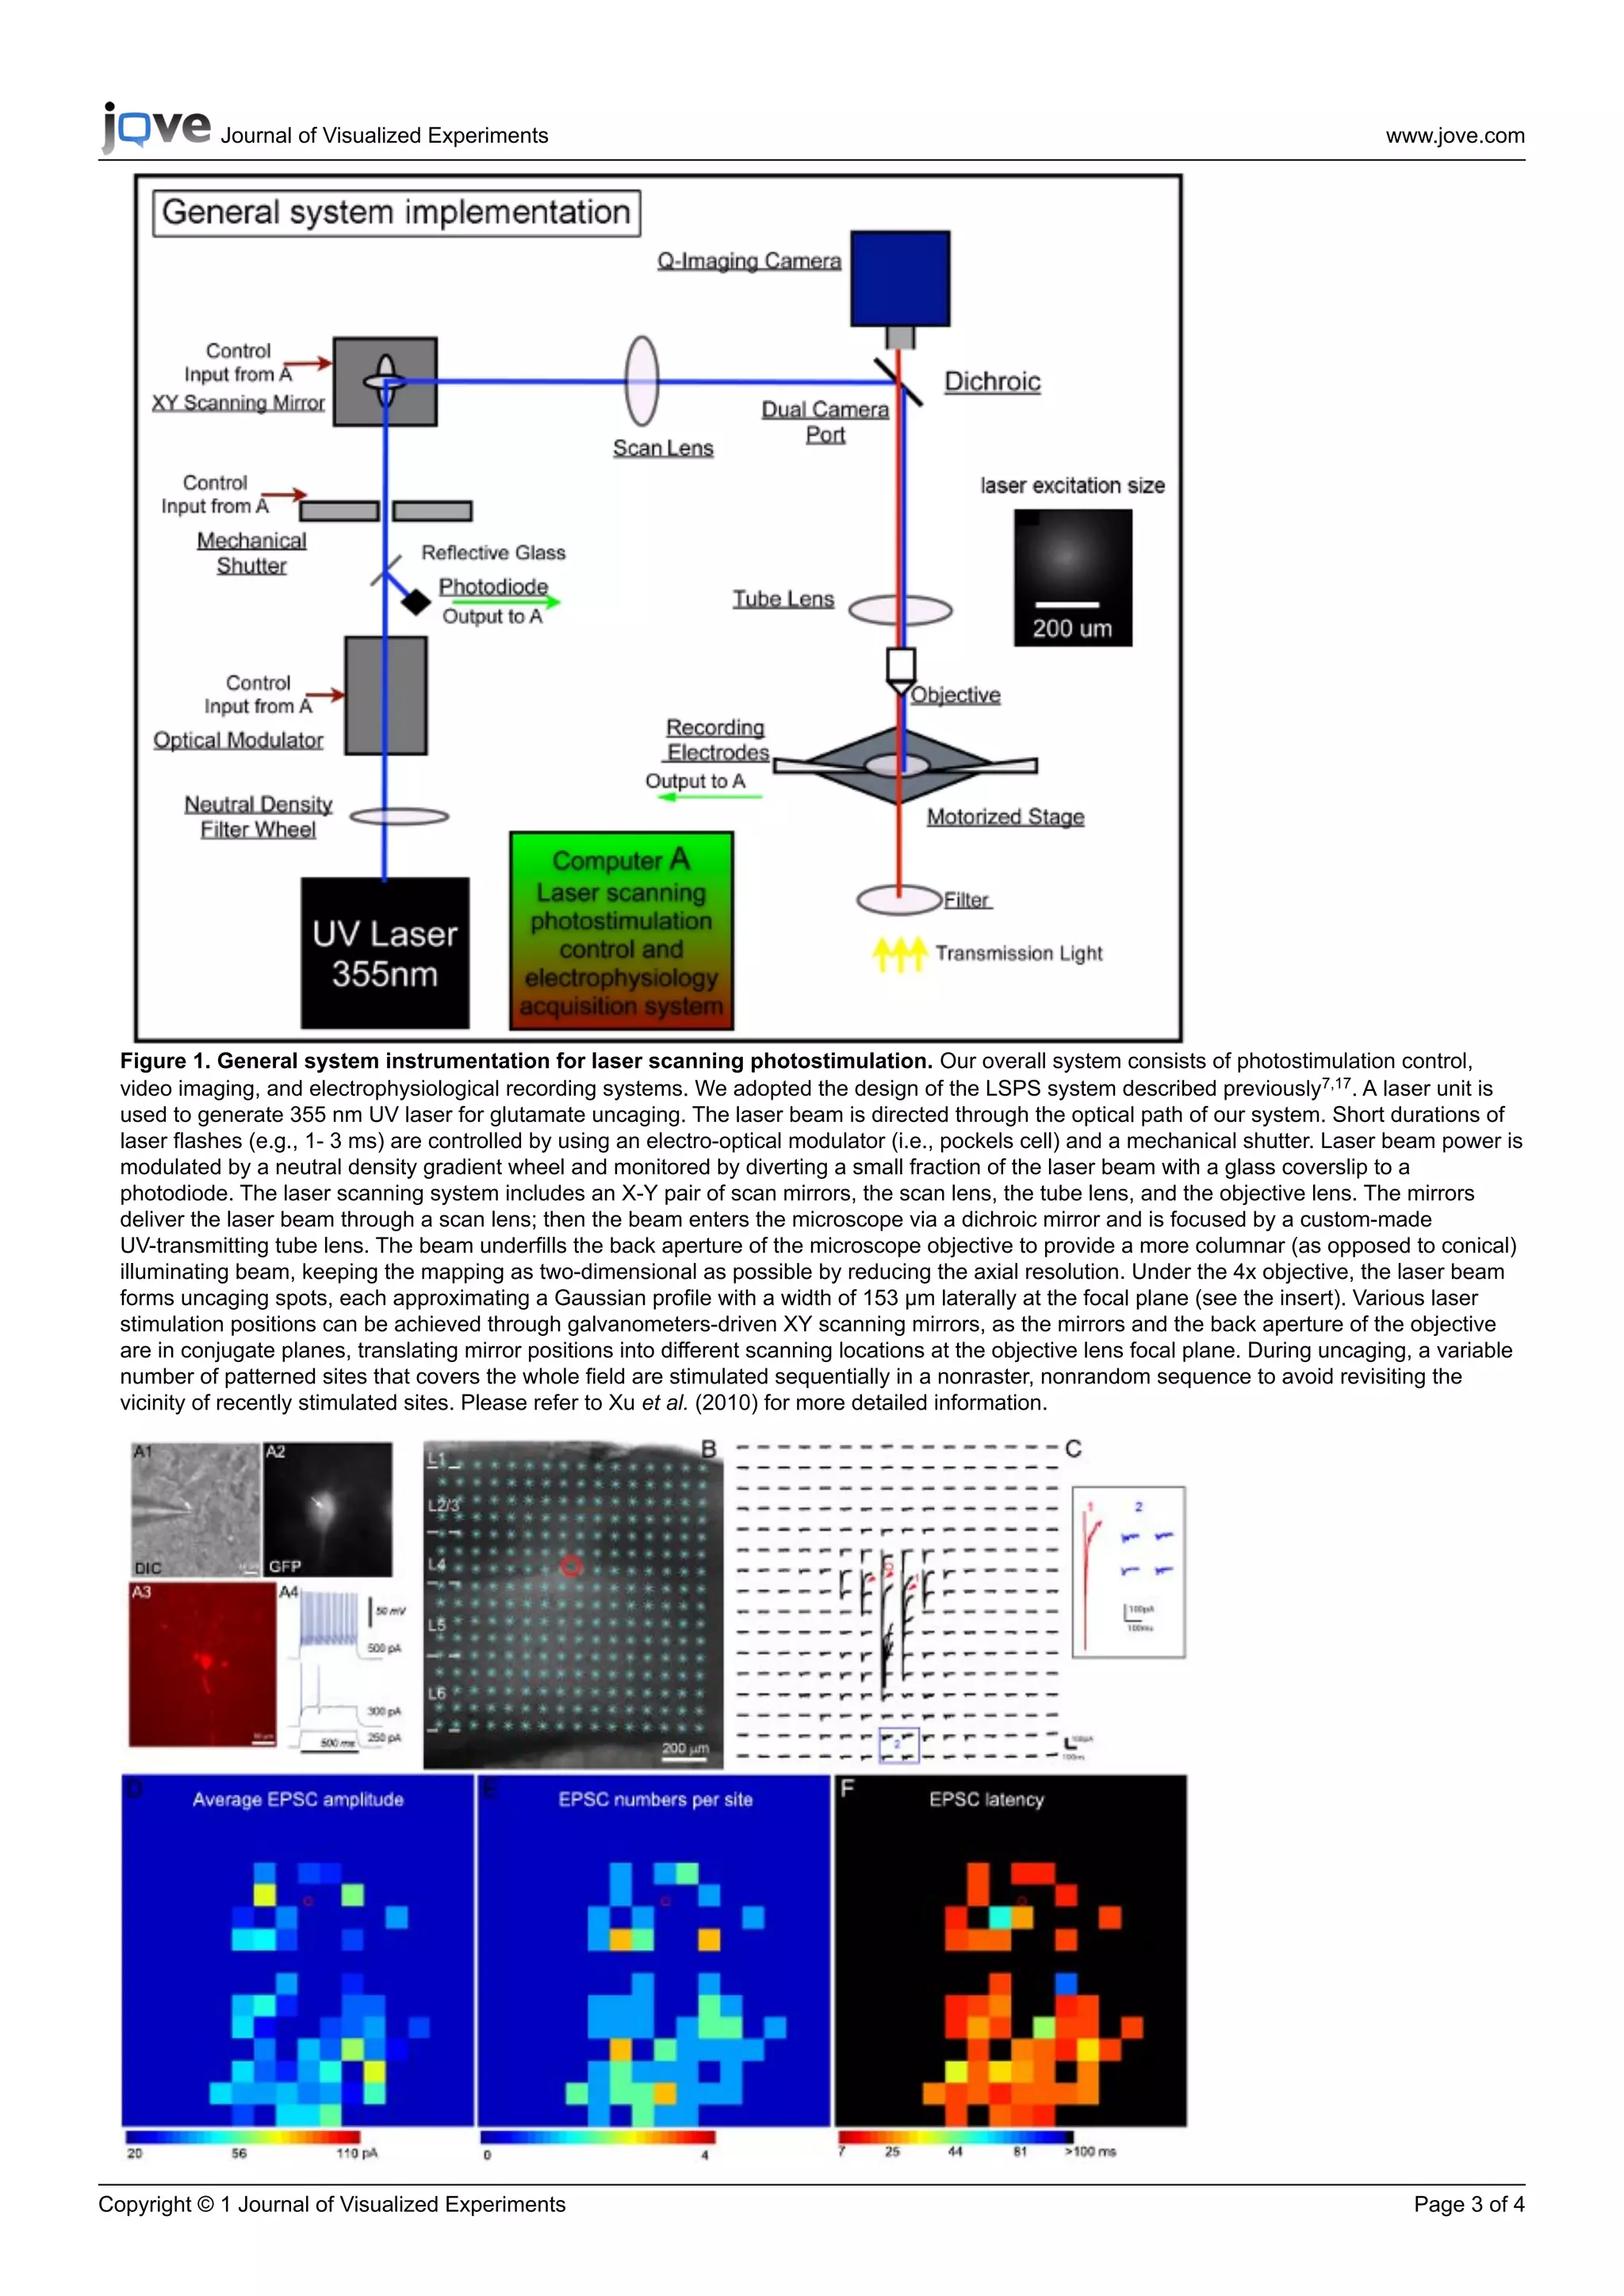
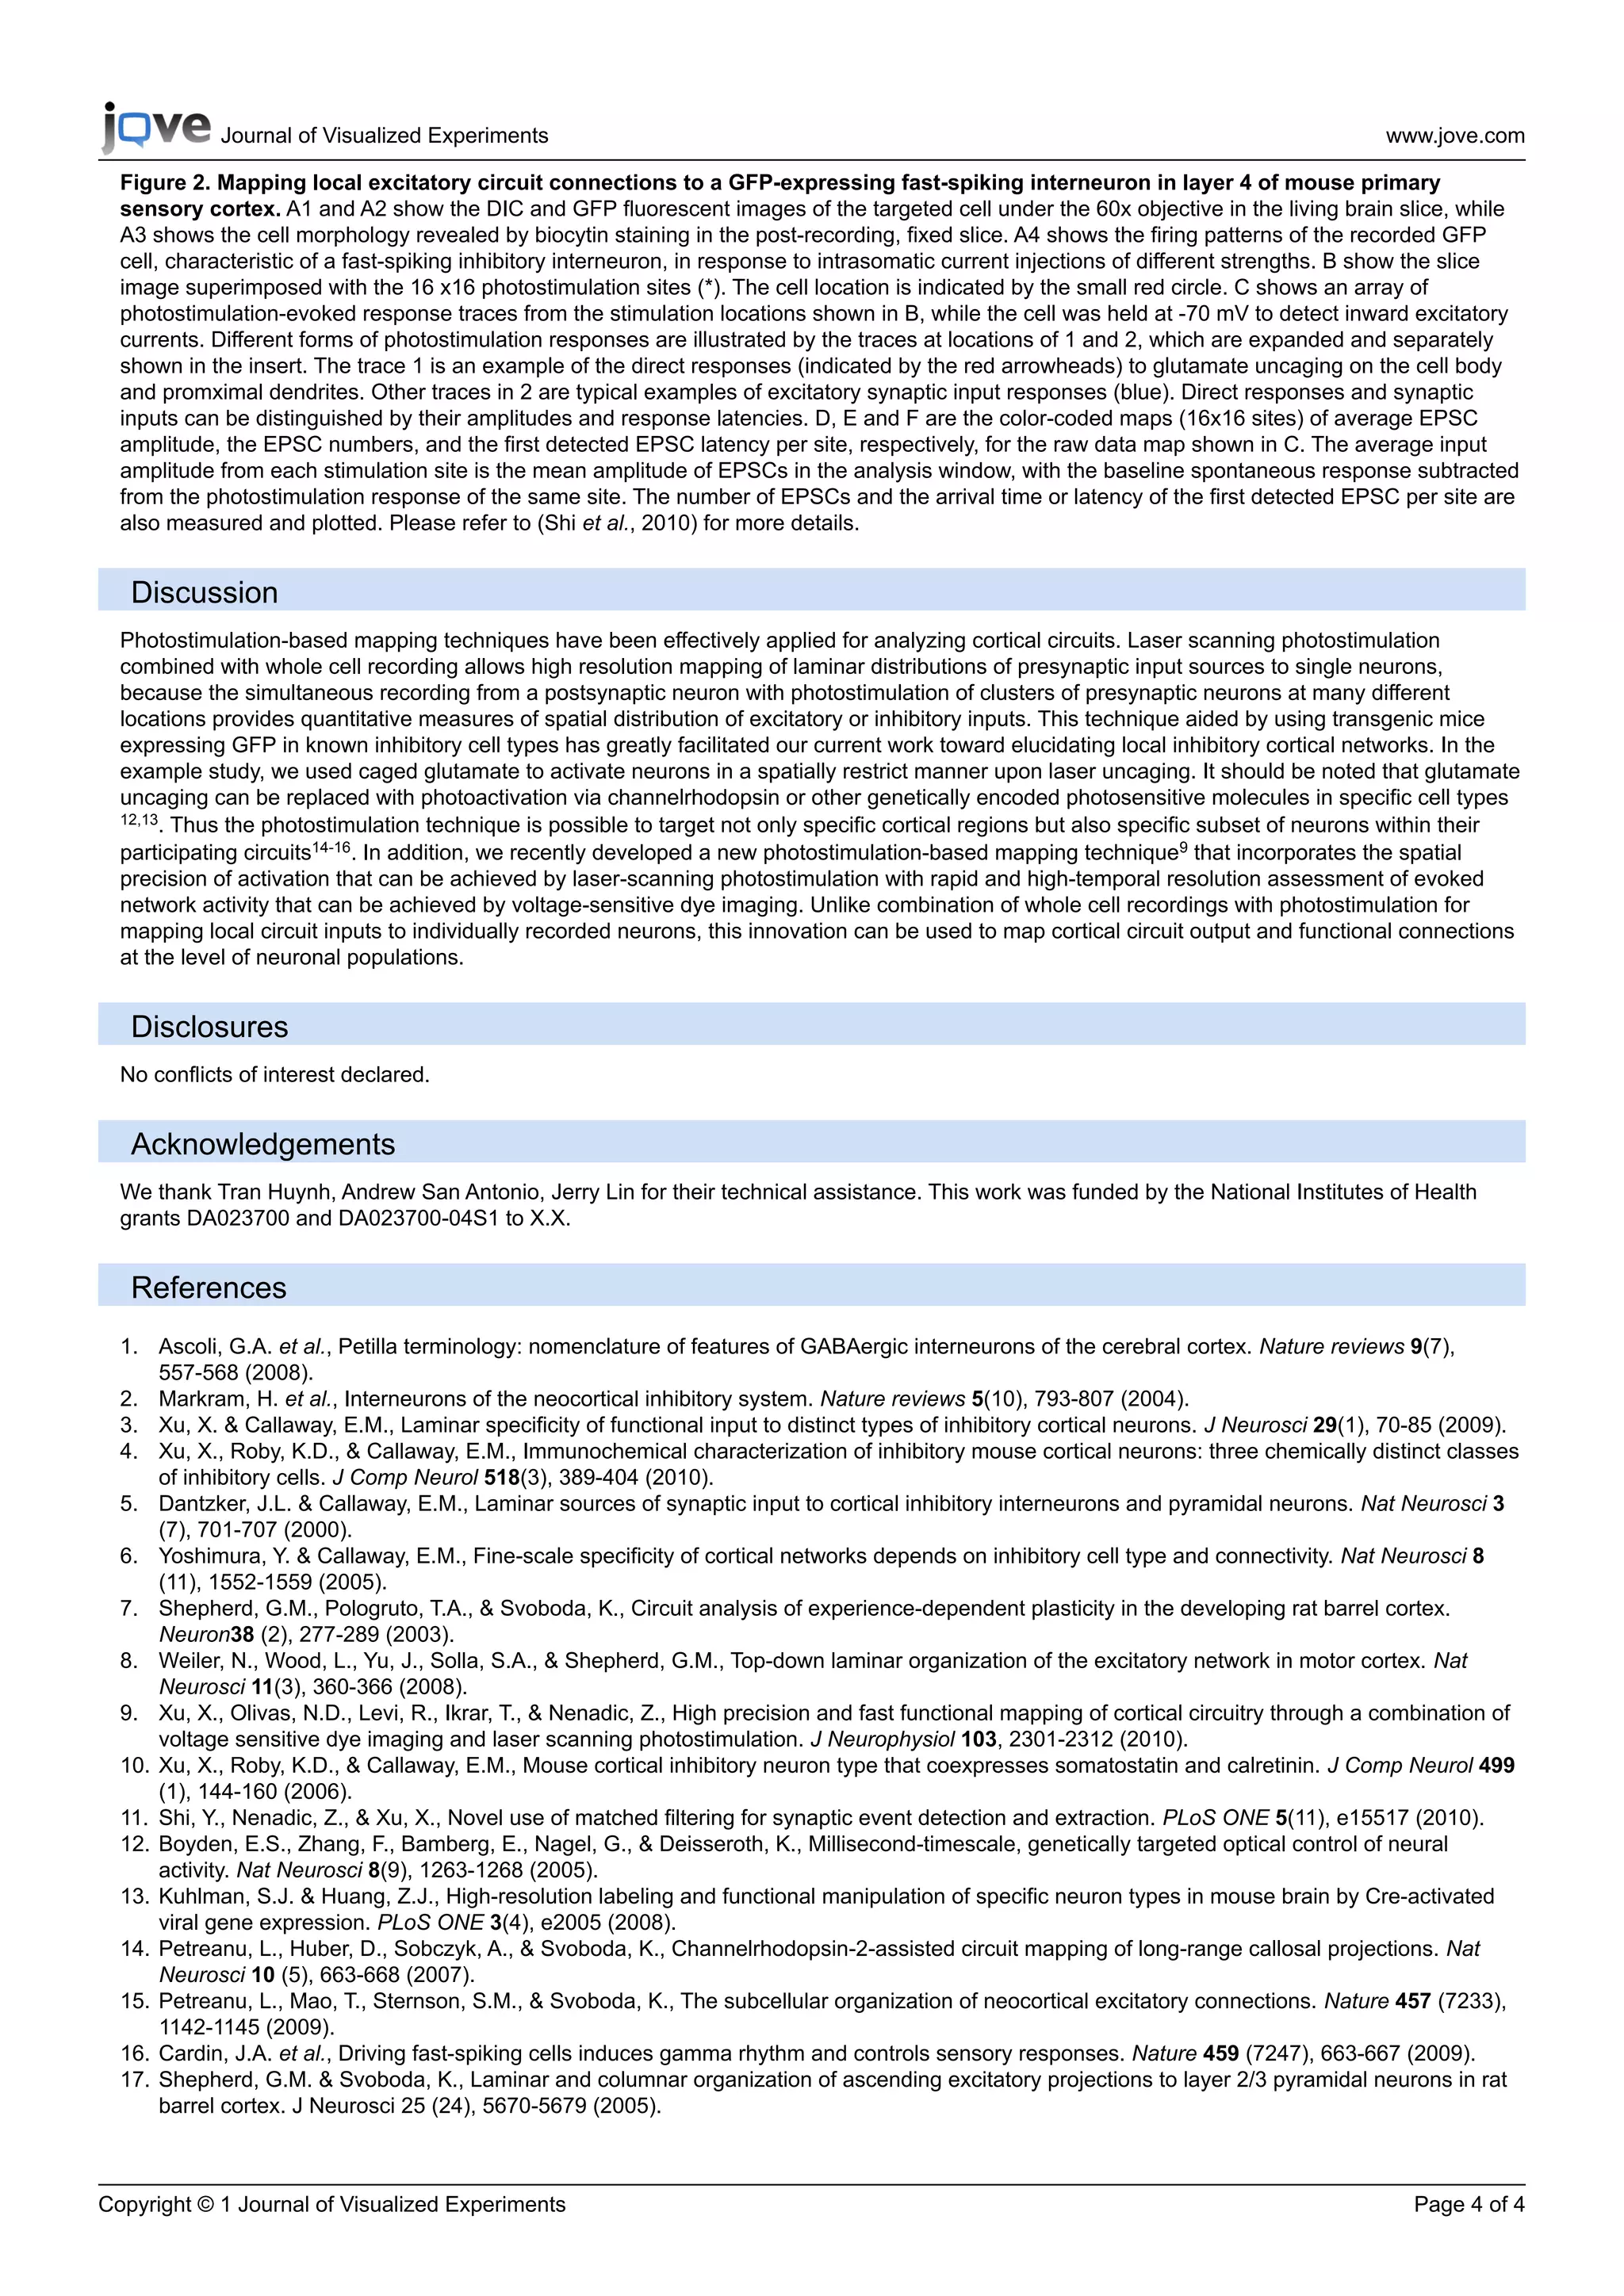

1) The document describes a technique called laser scanning photostimulation (LSPS) combined with whole-cell patch clamp recording to map local inhibitory neuronal circuits. 2) LSPS uses laser pulses to selectively activate neurons via glutamate uncaging, allowing mapping of excitatory and inhibitory synaptic inputs onto recorded neurons from many stimulation sites. 3) An example is provided showing excitatory synaptic input maps for a fast-spiking inhibitory interneuron in mouse somatosensory cortex, revealing strong input from layer 4 and deeper layers.


