This presentation provides an overview of Magnesita to investors. Key points include:
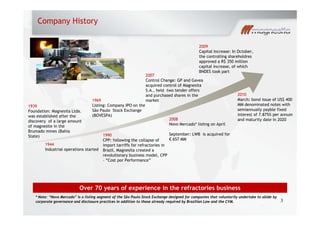
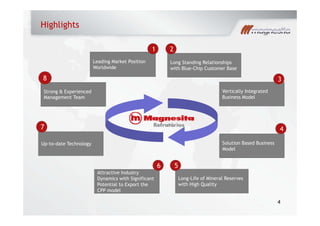
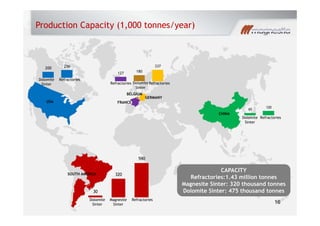
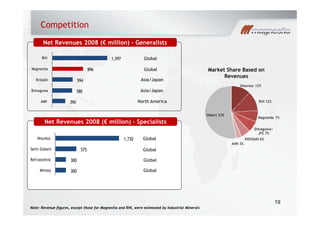
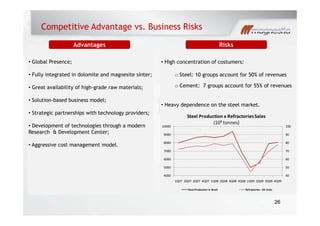
- Magnesita is the world's largest producer of refractory products with a leading market position and over 70 years of experience.
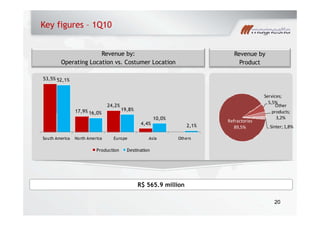
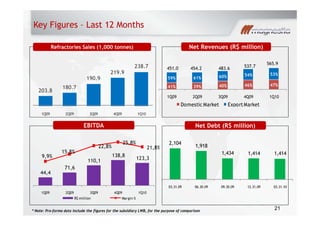
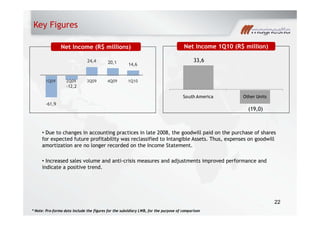
- In the first quarter of 2010, revenues were R$565.9 million, a 21.8% increase in EBITDA margin from the prior year.
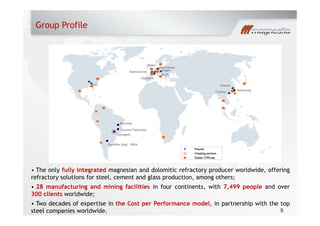
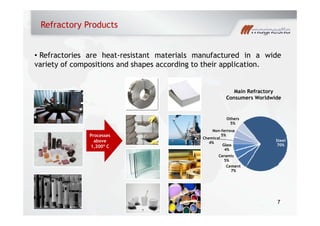
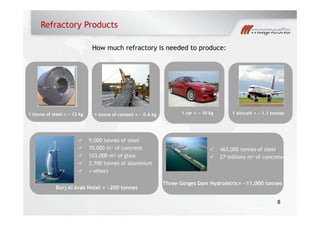
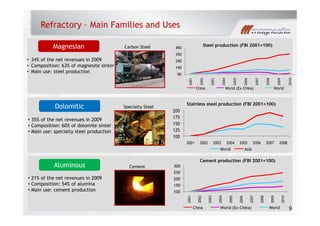
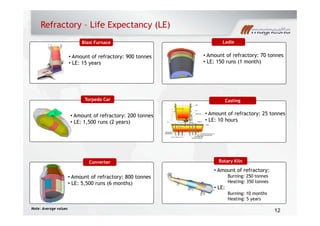
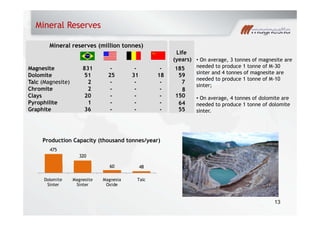
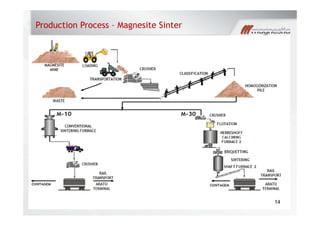
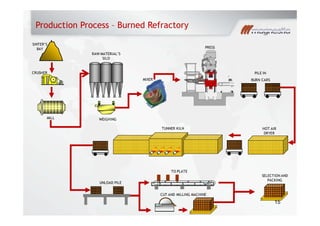
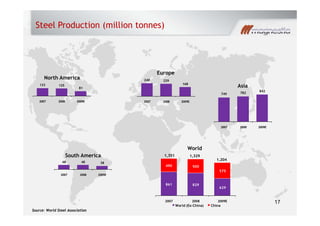
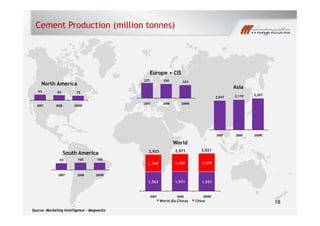
- The company has mineral reserves expected to last over 50 years across various sites and produces refractory products for steel, cement, glass and other industries.
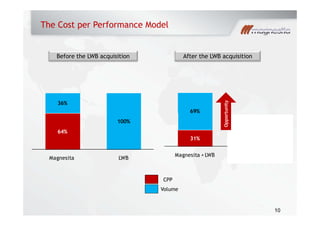
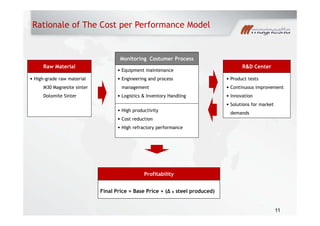
- Magnesita has expanded globally through acquisitions and employs its proprietary Cost per Performance business model.