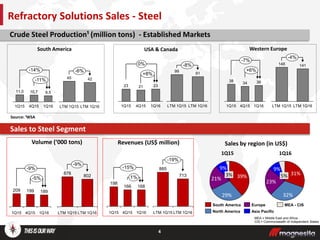
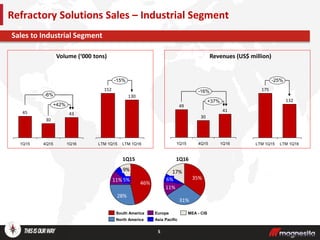
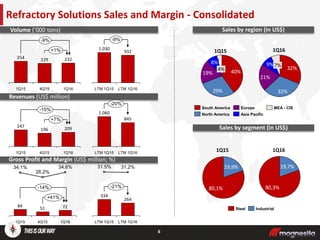
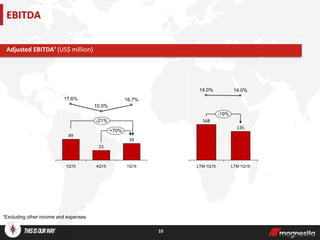
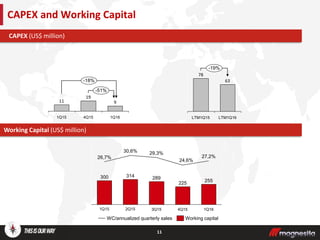
Earnings Call – 1Q16 Results
May 16th, 2016
The consolidated financial statements presented here are consistent with the criteria of international accounting standards - IFRS issued by the
International Accounting Standards Board – IASB, based on audited financial information. Non-financial information contained herein, as well
as other operational information, were not audited by independent auditors and may include forward-looking statements and reflects the
current views and perspectives of the management on the evolution of macro-economic environment, conditions of the mining and
refractories industries, company performance and financial results. Any statements, projections, expectations, estimates and plans contained
in this document that do not describe historical facts, and the factors or trends affecting financial condition, liquidity or results of operations,
are forward-looking statements and involve several risks and uncertainties.
This presentation should not be construed as legal, tax, investment or other advice. This presentation does not constitute an offer, or invitation,
or solicitation of an offer, to subscribe for or purchase any securities, and neither any part of this presentation nor any information or
statement contained herein shall form the basis of or be relied upon in connection with any contract or commitment whatsoever. Under no
circumstances, neither the Company nor its subsidiaries, directors, officers, agents or employees be liable to third parties (including investors)
for any investment decision based on information and statements in this presentation, or for any damages resulting therefrom, corresponding
or specific.
The information presented or contained in this presentation is current as of the date hereof and is subject to change without notice. Magnesita
has no obligation to update it or revise it in light of new information and / or in face of future events, safeguard the current regulations which
we are submitted to. This presentation and its contents are proprietary information of the Company and may not be reproduced or circulated,
partially or completely, without the prior written consent of the Company.
Magnesita’s commercial transactions are in compliance with international trading sanctions rules
Disclaimer
2
Magnesita diversified substantially since 2013
Several geographies and segments developed over the past 3 years
Products being sold in more than 100 countries
Sales outside Established markets already account for ~25% of total sales (~10% in 2012)
Sales in BRL account for ~less than 20% of total sales
Pursuing long term growth opportunities in markets with adequate and sustainable margins
Countries where Magnesita has developed sustainable
business with steel and cement industries
3
4
Crude Steel Production¹ (million tons) - Established Markets
Volume (‘000 tons)
Sales to Steel Segment
Revenues (US$ million)
4Q15 1Q16
189199
1Q15
209
-9%
-5%
-15%
4Q15
166
1%
198
168
1Q15 1Q16
Refractory Solutions Sales - Steel
Sales by region (in US$)
-9%
LTM 1Q15 LTM 1Q16
802
878
-19%
LTM 1Q16
713
LTM 1Q15
885
32%
5%
23%
9%
31%
1Q16
29%
3% 39%
9%
21%
1Q15
Asia PacificNorth America
MEA - CISSouth America Europe
South America
Source: ¹WSA
USA & Canada Western Europe
9,5
-14%
1Q164Q15
10,7
1Q15
11,0
-11%
4Q15
21
1Q15
0%
1Q16
2323
+8%
34 36
1Q15 1Q164Q15
-7%
38
+6%
LTM 1Q16
42
LTM 1Q15
-6%
45
99
LTM 1Q15
-8%
LTM 1Q16
91
LTM 1Q15
148 141
-4%
LTM 1Q16
MEA = Middle East and Africa
CIS = Commonwealth of Independent States
5
Sales to Industrial Segment
Refractory Solutions Sales – Industrial Segment
Volume (‘000 tons) Revenues (US$ million)
-6%
1Q16
30
45 43
4Q151Q15
+42%
-16%
1Q16
41
4Q15
30
49
1Q15
+37%
LTM 1Q16
130
LTM 1Q15
152
-15%
132
175
-25%
LTM 1Q16LTM 1Q15
31%
6% 35%
17%
11%
46%
28%
9%
11% 5%
South America
North America Asia Pacific
Europe MEA - CIS
1Q161Q15
Refractory Solutions Sales and Margin - Consolidated
Volume (‘000 tons)
Revenues (US$ million)
Gross Profit and Margin (US$ million; %)
1Q16
+1%
229
-9%
4Q15
232
1Q15
254
84 7251
34.6%
26.2%
1Q15
34.1%
-14%
4Q15
+41%
1Q16
+7%
247
1Q164Q151Q15
-15%
196 209
-9%
LTM 1Q15 LTM 1Q16
932
1.030
-20%
845
LTM 1Q16LTM 1Q15
1.060
LTM 1Q15
264
334
31.5%
-21%
31.2%
LTM 1Q16
6
32%
32%
7%9%
21%
19%
4%
8%
29%
40%
Asia Pacific
MEA - CISEuropeSouth America
North America
1Q161Q15
19,7%
80,3%
19,9%
80,1%
1Q161Q15
Steel Industrial
Sales by region (in US$)
Sales by segment (in US$)
7
Revenues (US$ million) Gross Profit and Margin (US$ million; %)
Revenues (US$ million)
Minerals and Services Sales and Margin
-33%
11
4Q15
16
1Q15 1Q16
-32%
16
-19%
4Q15
18
-16%
14
1Q15 1Q16
17
5,1
33,4% 37,3%
1Q16
4,1
1Q15
-21%
-24%
4Q15
5,4
31,4%
-50%
-24%
1Q15
4,2
4Q15
2,1
14,7%
23,7%
1Q16
2,7
16,3%
Minerals
Services
LTM 1Q16
-7%
61
LTM 1Q15
66
+10%
LTM 1Q16
39.0%
LTM 1Q15
33.0%
22
24
LTM 1Q15
60
-16%
LTM 1Q16
71
15,2
LTM 1Q15
21,3%
-41%
LTM 1Q16
15,0%
9,0
Gross Profit and Margin (US$ million; %)
8
Consolidated Sales and Gross Profit
Por Segmento
229
1Q15
281
1Q16
+2%
-17%
234
4Q15
Gross Profit
Consolidated Revenue (US$ million)
966
1.196
LTM 1Q15
-19%
LTM 1Q16
+32%
4Q15
60
94
33.6%
-16%
1Q16
79
26.0%
1Q15
33.3%
371
296
-20%
30.7%
LTM 1Q15
31.0%
LTM 1Q16
4,7%
6,1%
89,3%
6,2%
5,8%
87,9%
1Q161Q15
MineralsRefractories Services
Gross Profit (US$ million)
9
SG&A expenses
Freight expenses (US$ million)
G&A
373643
-3%
-14%
1Q16
15.7%15.6%
4Q151Q15
15.2%
Fixed SG&A
% of sales
157
190
LTM 1Q16
15.9%
LTM 1Q15
-18%
16.3%
Fixed SG&A (US$ million)
131416
-4%
1Q15
-16%
1Q16
5.7%
6.0%
4Q15
5.6%
% of sales
Freight expenses
54
73
5.6%
6.1%
LTM 1Q15 LTM 1Q16
-25%
10
EBITDA
+70%
1Q15 4Q15
10.0%
1Q16
49
16.7%
23
17.6%
-21%
39
-19%
168
135
14.0%14.0%
LTM 1Q15 LTM 1Q16
¹Excluding other income and expenses
G&AAdjusted EBITDA¹ (US$ million)
11
CAPEX and Working Capital
Working Capital
CAPEX (US$ million)
9
1Q15 4Q15
19
1Q16
-18%
11
-51%
-19%
63
LTM1Q15
78
LTM1Q16
Working Capital (US$ million)
289
29,3%
2Q15
314
30,6%
1Q15
300
26,7%
1Q16
255
27,2%
4Q15
225
24,6%
3Q15
Working capitalWC/annualized quarterly sales
12
Capital Structure (US$ million)
Leverage (US$ million)
Net Debt per Currency
Leverage Excl. Perpetual (US$ million)
EUR
BRL
30%
57%
14%
USD
*EBITDA excluding other revenues/expenses
Total Excluding Perpetual Bond
*EBITDA excluding other revenues/expenses
Leverage ratio Leverage ratio ex-perpetual
4,1x
3,6x3,5x3,5x
3,2x
135
548
1Q164Q15
168
3Q15
527
1Q15 2Q15
152158
537551
145
532
EBITDANet Debt Net Debt / EBITDA¹
1,9x
1,7x
2,2x
277
152
298
168
3Q15
1,9x
145
4Q15
158
1Q15
135
1Q16
1,9x
287
2Q15
301282
Net Debt / EBITDA¹EBITDANet Debt
Amortization Schedule
115
10198
210
2019 2020
118
Perp.
250
58
201820172016mar-16
Amortization Perpetual BondCash position
Amortization Schedule
118
20172016
210
Perp.
115
101
250
2019
58
98
2018 2020mar-16
AmortizationCash position Perpetual Bond
Octavio Pereira Lopes
CEO
Eduardo Gotilla
CFO e IRO
Daniel Domiciano Silva
IR Manager
Phone: +55 11 3152-3237/3241/3202
ri@magnesita.com
www.magnesita.com/ri
13
Investor Relations

Ppt 1 t16 en 5 (1)

  • 1.
    Earnings Call –1Q16 Results May 16th, 2016
  • 2.
    The consolidated financialstatements presented here are consistent with the criteria of international accounting standards - IFRS issued by the International Accounting Standards Board – IASB, based on audited financial information. Non-financial information contained herein, as well as other operational information, were not audited by independent auditors and may include forward-looking statements and reflects the current views and perspectives of the management on the evolution of macro-economic environment, conditions of the mining and refractories industries, company performance and financial results. Any statements, projections, expectations, estimates and plans contained in this document that do not describe historical facts, and the factors or trends affecting financial condition, liquidity or results of operations, are forward-looking statements and involve several risks and uncertainties. This presentation should not be construed as legal, tax, investment or other advice. This presentation does not constitute an offer, or invitation, or solicitation of an offer, to subscribe for or purchase any securities, and neither any part of this presentation nor any information or statement contained herein shall form the basis of or be relied upon in connection with any contract or commitment whatsoever. Under no circumstances, neither the Company nor its subsidiaries, directors, officers, agents or employees be liable to third parties (including investors) for any investment decision based on information and statements in this presentation, or for any damages resulting therefrom, corresponding or specific. The information presented or contained in this presentation is current as of the date hereof and is subject to change without notice. Magnesita has no obligation to update it or revise it in light of new information and / or in face of future events, safeguard the current regulations which we are submitted to. This presentation and its contents are proprietary information of the Company and may not be reproduced or circulated, partially or completely, without the prior written consent of the Company. Magnesita’s commercial transactions are in compliance with international trading sanctions rules Disclaimer 2
  • 3.
    Magnesita diversified substantiallysince 2013 Several geographies and segments developed over the past 3 years Products being sold in more than 100 countries Sales outside Established markets already account for ~25% of total sales (~10% in 2012) Sales in BRL account for ~less than 20% of total sales Pursuing long term growth opportunities in markets with adequate and sustainable margins Countries where Magnesita has developed sustainable business with steel and cement industries 3
  • 4.
    4 Crude Steel Production¹(million tons) - Established Markets Volume (‘000 tons) Sales to Steel Segment Revenues (US$ million) 4Q15 1Q16 189199 1Q15 209 -9% -5% -15% 4Q15 166 1% 198 168 1Q15 1Q16 Refractory Solutions Sales - Steel Sales by region (in US$) -9% LTM 1Q15 LTM 1Q16 802 878 -19% LTM 1Q16 713 LTM 1Q15 885 32% 5% 23% 9% 31% 1Q16 29% 3% 39% 9% 21% 1Q15 Asia PacificNorth America MEA - CISSouth America Europe South America Source: ¹WSA USA & Canada Western Europe 9,5 -14% 1Q164Q15 10,7 1Q15 11,0 -11% 4Q15 21 1Q15 0% 1Q16 2323 +8% 34 36 1Q15 1Q164Q15 -7% 38 +6% LTM 1Q16 42 LTM 1Q15 -6% 45 99 LTM 1Q15 -8% LTM 1Q16 91 LTM 1Q15 148 141 -4% LTM 1Q16 MEA = Middle East and Africa CIS = Commonwealth of Independent States
  • 5.
    5 Sales to IndustrialSegment Refractory Solutions Sales – Industrial Segment Volume (‘000 tons) Revenues (US$ million) -6% 1Q16 30 45 43 4Q151Q15 +42% -16% 1Q16 41 4Q15 30 49 1Q15 +37% LTM 1Q16 130 LTM 1Q15 152 -15% 132 175 -25% LTM 1Q16LTM 1Q15 31% 6% 35% 17% 11% 46% 28% 9% 11% 5% South America North America Asia Pacific Europe MEA - CIS 1Q161Q15
  • 6.
    Refractory Solutions Salesand Margin - Consolidated Volume (‘000 tons) Revenues (US$ million) Gross Profit and Margin (US$ million; %) 1Q16 +1% 229 -9% 4Q15 232 1Q15 254 84 7251 34.6% 26.2% 1Q15 34.1% -14% 4Q15 +41% 1Q16 +7% 247 1Q164Q151Q15 -15% 196 209 -9% LTM 1Q15 LTM 1Q16 932 1.030 -20% 845 LTM 1Q16LTM 1Q15 1.060 LTM 1Q15 264 334 31.5% -21% 31.2% LTM 1Q16 6 32% 32% 7%9% 21% 19% 4% 8% 29% 40% Asia Pacific MEA - CISEuropeSouth America North America 1Q161Q15 19,7% 80,3% 19,9% 80,1% 1Q161Q15 Steel Industrial Sales by region (in US$) Sales by segment (in US$)
  • 7.
    7 Revenues (US$ million)Gross Profit and Margin (US$ million; %) Revenues (US$ million) Minerals and Services Sales and Margin -33% 11 4Q15 16 1Q15 1Q16 -32% 16 -19% 4Q15 18 -16% 14 1Q15 1Q16 17 5,1 33,4% 37,3% 1Q16 4,1 1Q15 -21% -24% 4Q15 5,4 31,4% -50% -24% 1Q15 4,2 4Q15 2,1 14,7% 23,7% 1Q16 2,7 16,3% Minerals Services LTM 1Q16 -7% 61 LTM 1Q15 66 +10% LTM 1Q16 39.0% LTM 1Q15 33.0% 22 24 LTM 1Q15 60 -16% LTM 1Q16 71 15,2 LTM 1Q15 21,3% -41% LTM 1Q16 15,0% 9,0 Gross Profit and Margin (US$ million; %)
  • 8.
    8 Consolidated Sales andGross Profit Por Segmento 229 1Q15 281 1Q16 +2% -17% 234 4Q15 Gross Profit Consolidated Revenue (US$ million) 966 1.196 LTM 1Q15 -19% LTM 1Q16 +32% 4Q15 60 94 33.6% -16% 1Q16 79 26.0% 1Q15 33.3% 371 296 -20% 30.7% LTM 1Q15 31.0% LTM 1Q16 4,7% 6,1% 89,3% 6,2% 5,8% 87,9% 1Q161Q15 MineralsRefractories Services Gross Profit (US$ million)
  • 9.
    9 SG&A expenses Freight expenses(US$ million) G&A 373643 -3% -14% 1Q16 15.7%15.6% 4Q151Q15 15.2% Fixed SG&A % of sales 157 190 LTM 1Q16 15.9% LTM 1Q15 -18% 16.3% Fixed SG&A (US$ million) 131416 -4% 1Q15 -16% 1Q16 5.7% 6.0% 4Q15 5.6% % of sales Freight expenses 54 73 5.6% 6.1% LTM 1Q15 LTM 1Q16 -25%
  • 10.
    10 EBITDA +70% 1Q15 4Q15 10.0% 1Q16 49 16.7% 23 17.6% -21% 39 -19% 168 135 14.0%14.0% LTM 1Q15LTM 1Q16 ¹Excluding other income and expenses G&AAdjusted EBITDA¹ (US$ million)
  • 11.
    11 CAPEX and WorkingCapital Working Capital CAPEX (US$ million) 9 1Q15 4Q15 19 1Q16 -18% 11 -51% -19% 63 LTM1Q15 78 LTM1Q16 Working Capital (US$ million) 289 29,3% 2Q15 314 30,6% 1Q15 300 26,7% 1Q16 255 27,2% 4Q15 225 24,6% 3Q15 Working capitalWC/annualized quarterly sales
  • 12.
    12 Capital Structure (US$million) Leverage (US$ million) Net Debt per Currency Leverage Excl. Perpetual (US$ million) EUR BRL 30% 57% 14% USD *EBITDA excluding other revenues/expenses Total Excluding Perpetual Bond *EBITDA excluding other revenues/expenses Leverage ratio Leverage ratio ex-perpetual 4,1x 3,6x3,5x3,5x 3,2x 135 548 1Q164Q15 168 3Q15 527 1Q15 2Q15 152158 537551 145 532 EBITDANet Debt Net Debt / EBITDA¹ 1,9x 1,7x 2,2x 277 152 298 168 3Q15 1,9x 145 4Q15 158 1Q15 135 1Q16 1,9x 287 2Q15 301282 Net Debt / EBITDA¹EBITDANet Debt Amortization Schedule 115 10198 210 2019 2020 118 Perp. 250 58 201820172016mar-16 Amortization Perpetual BondCash position Amortization Schedule 118 20172016 210 Perp. 115 101 250 2019 58 98 2018 2020mar-16 AmortizationCash position Perpetual Bond
  • 13.
    Octavio Pereira Lopes CEO EduardoGotilla CFO e IRO Daniel Domiciano Silva IR Manager Phone: +55 11 3152-3237/3241/3202 ri@magnesita.com www.magnesita.com/ri 13 Investor Relations