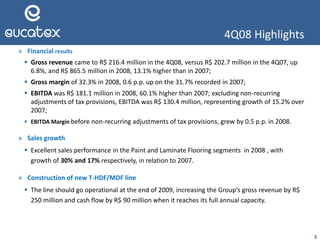
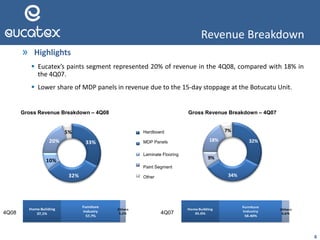
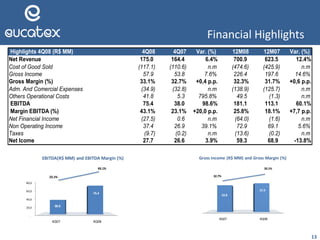
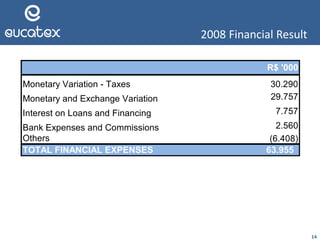
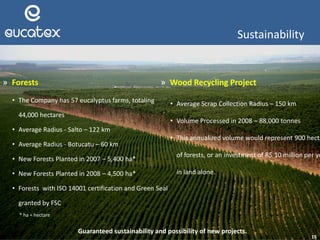
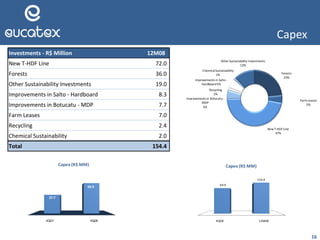
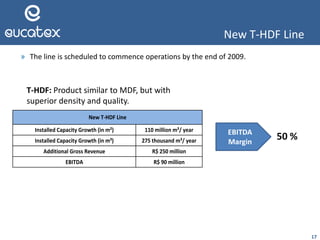
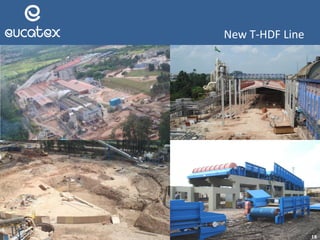
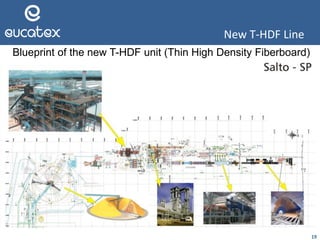
4Q08 Conference Call
April 2, 2009
2
Disclaimer
This presentation includes forward‐looking statements that are subject to
risks and uncertainties based on the beliefs and assumptions of the
management of Eucatex S.A. Indústria e Comércio, and on information
currently available to the Company.
Forward‐looking statements are not guarantees of performance. They
involve risks, uncertainties and assumptions because they relate to future
events and therefore depend on circumstances that may or may not occur.
Investors should understand that overall economic conditions, industry
conditions and other operating factors may affect the company’s future
results and may lead to results that differ materially from those expressed
in such forward‐looking statements.
4Q08 Highlights
3
» Financial results
 Gross revenue came to R$ 216.4 million in the 4Q08, versus R$ 202.7 million in the 4Q07, up
6.8%, and R$ 865.5 million in 2008, 13.1% higher than in 2007;
 Gross margin of 32.3% in 2008, 0.6 p.p. up on the 31.7% recorded in 2007;
 EBITDA was R$ 181.1 million in 2008, 60.1% higher than 2007; excluding non-recurring
adjustments of tax provisions, EBITDA was R$ 130.4 million, representing growth of 15.2% over
2007;
 EBITDA Margin before non-recurring adjustments of tax provisions, grew by 0.5 p.p. in 2008.
» Sales growth
 Excellent sales performance in the Paint and Laminate Flooring segments in 2008 , with
growth of 30% and 17% respectively, in relation to 2007.
» Construction of new T-HDF/MDF line
 The line should go operational at the end of 2009, increasing the Group’s gross revenue by R$
250 million and cash flow by R$ 90 million when it reaches its full annual capacity.
4
Revenue Breakdown
» Highlights
 Eucatex’s paints segment represented 20% of revenue in the 4Q08, compared with 18% in
the 4Q07.
 Lower share of MDP panels in revenue due to the 15-day stoppage at the Botucatu Unit.
33%
32%
10%
20%
5%
Distribuiçãoda ReceitaBruta - 4T08
Chapas de Fibra
Painéis MDP
Pisos Laminados
SegmentoTintas
Outros
32%
34%
9%
18%
7%
Distribuiçãoda ReceitaBruta - 4T07Gross Revenue Breakdown – 4Q08
Laminate Flooring
Other
Hardboard
Gross Revenue Breakdown – 4Q07
Paint Segment
MDP Panels
4Q074Q08
Home Building
37,1%
Furniture
Industry
57,7%
Others
5,2%
Home Building
35.0%
Furniture
Industry
58.40%
Others
6,6%
5
» The first and largest unit of the Eucatex Group.
 Location: Salto-SP
 Area: Land – 540,000 m² / Built area – 153,000 m²
 Gross Revenue in 2008: R$ 285 million (20 % from exports to over 25 countries)
 Number of employees: 808
» Main products and installed capacity in the year:
 Hardboard 240,000 m³
 Panels and Doors 1,800,000 pc
 Paint Capacity 50,000,000 m²
Boards Unit
Hardboard
12M08 12M07
91% 84%
Utilizaçãoda Capacidade Instalada
Chapa de Fibra
12M08 12M07
45% 43%
Market Share (MercadoInterno)
Chapa de Fibra 6
100
106
0,5
0,6
0,7
0,8
0,9
1
1,1
1
21
41
61
81
101
121
2007 2008
Preço x Custo - Chapa de Fibra
Volumes m2 (base 100) Preço-Custo (base 100)
Hardboard
Installed Capacity Used
Price vs. Cost - Hardboard
Volume m² (base 100)
1.1
0.9
Market Share (Domestic Market)
Hardboard
Price-Cost (base 100)
0.8
0.7
0.6
0.5
7
The only plant in Latin America capable of laminating paper during the production of
MDP panels.
 Location: Botucatu-SP
 Area: Land 372,000 m²/ Built area: 62,000m²
 Gross Revenue in 2008: R$ 359 million
 Number of Employees: 368
Main products and installed capacities in the year:
 MDP 430,000 m³
 Flooring 7,200,000 m²
 Low pressure finishing (BP) and Lacca 20,000,000 m²
MDP and Flooring Unit
MDP Panels
12M08 12M07
89% 91%
Utilizaçãoda Capacidade Instalada
Painéis MDP
12M08 12M07
13% 14%
Market Share
Painéis MDP 8
100
94
0,50
0,60
0,70
0,80
0,90
1,00
1,10
1,4
21,4
41,4
61,4
81,4
101,4
121,4
2007 2008
Análise de Volume e Preçox Custo - MDP
Volumes m2 (base 100) Preço-Custo (base 100)
Installed Capacity Used
Volume m² (base 100)
MDP Panels
Analysis of Volume and Price vs. Cost - MDP
Price-Cost (base 100)
MDP Panels
Wood Sales Mix
» Eucatex’s sales mix has larger market share of coated products in relation to market peers;
» In the 4Q08, coated products, which have higher value added, represented 98% of the MDP
produced; and
» Lacca accounted for 24% of MDP sales in 2008.
(*) Fonte: ABIPA e Empresas
9
» The company offers differentiated products
such as Eucatop and Lacca.
4T07 4T08 Mercado- 12M08
90%
99%
25%
Proporção de MDP revestido
EUCATEX
Cru
Revestido
Share of coated MDP
Standard
Coated
4Q07 4Q08 Market – 12M08
(*) Source: ABIPA and Companies
Flooring
12M08 12M07
62% 55%
Utilizaçãoda Capacidade Instalada
Pisos Laminados
12M08 12M07
31% 31%
Market Share
Pisos Laminados 10
100
113
-
0,20
0,40
0,60
0,80
1,00
1,20
90
95
100
105
110
115
2007 2008
Análise de Volume e Preço x Custo- Pisos
Volumes m2 (base 100) Preço-Custo (base 100)
Analysis of Volume and Price vs. Cost - Flooring
Installed Capacity Used
Laminate Flooring
Laminate Flooring
Volume m² (base 100) Price-cost (base 100)
1.20
0.20
0.80
1.00
0.40
0.60
Paint and Varnish Unit
Inaugurated in 1994, this unit is one of the most modern in Latin America, thanks to its
state-of-the art equipment and high-tech laboratory.
 Location: Salto-SP
 Area: Land: 960,000 m² / Built area: 36,000 m²
 Gross Revenue in 2008: R$ 153 million
 Number of Employees: 199
Installed capacity in the year:
 Capacity: 36 million gallons/year
11
12
Paints
12M08 12M07
40% 33%
Utilizaçãoda Capacidade Instalada
12M08 12M07
6% 6%
Market Share (*)
(*) estimativa Eucatex
100 121
0,50
0,60
0,70
0,80
0,90
1,00
1,10
-
20
40
60
80
100
120
140
2007 2008
Análise Volume e Preço x Custo - Tintas
Volumes m2 (base 100) Preço-Custo (base 100)
Analysis of Volume and Price vs. Cost - Paint
Installed Capacity Used
Volume m² (base 100) Price-cost (base 100)
(*) Eucatex’s estimates
1.00
0.90
0.80
0.70
0.60
0.50
1.10
13
Financial Highlights
Highlights 4Q08 (R$ MM) 4Q08 4Q07 Var. (%) 12M08 12M07 Var. (%)
Net Revenue 175.0 164.4 6.4% 700.9 623.5 12.4%
Cost of Good Sold (117.1) (110.6) n.m (474.6) (425.9) n.m
Gross Income 57.9 53.8 7.6% 226.4 197.6 14.6%
Gross Margin (%) 33.1% 32.7% +0,4 p.p. 32.3% 31.7% +0,6 p.p.
Adm. And Comercial Expenses (34.9) (32.8) n.m (138.9) (125.7) n.m
Others Operational Costs 41.8 5.3 795.8% 49.5 (1.3) n.m
EBITDA 75.4 38.0 98.6% 181.1 113.1 60.1%
Margin EBITDA (%) 43.1% 23.1% +20,0 p.p. 25.8% 18.1% +7,7 p.p.
Net Financial Income (27.5) 0.6 n.m (64.0) (1.6) n.m
Non Operating Income 37.4 26.9 39.1% 72.9 69.1 5.6%
Taxes (9.7) (0.2) n.m (13.6) (0.2) n.m
Net Icome 27.7 26.6 3.9% 59.3 68.9 -13.8%
4Q07 4Q08
53.8
57.9
Gross Income (R$ MM) and Gross Margin (%)
33.1%
32.7%
-
20,0
40,0
60,0
80,0
4Q07 4Q08
38.0
75.4
EBITDA(R$ MM) and EBITDA Margin (%)
43.1%
23.1%
2008 Financial Result
14
Monetary Variation - Taxes 30.290
Monetary and Exchange Variation 29.757
Interest on Loans and Financing 7.757
Bank Expenses and Commissions 2.560
Others (6.408)
R$ '000
TOTAL FINANCIAL EXPENSES 63.955
15
» Forests
• The Company has 57 eucalyptus farms, totaling
44,000 hectares
• Average Radius - Salto – 122 km
• Average Radius - Botucatu – 60 km
• New Forests Planted in 2007 – 5,400 ha*
• New Forests Planted in 2008 – 4,500 ha*
• Forests with ISO 14001 certification and Green Seal
granted by FSC
Guaranteed sustainability and possibility of new projects.
Sustainability
* ha = hectare
» Wood Recycling Project
• Average Scrap Collection Radius – 150 km
• Volume Processed in 2008 – 88,000 tonnes
• This annualized volume would represent 900 hecta
of forests, or an investment of R$ 10 million per ye
in land alone.
Capex
16
Investments - R$ Million 12M08
New T-HDF Line 72.0
Forests 36.0
Other Sustainability Investments 19.0
Improvements in Salto - Hardboard 8.3
Improvements in Botucatu - MDP 7.7
Farm Leases 7.0
Recycling 2.4
Chemical Sustainability 2.0
Total 154.4
Forests
23%
FarmLeases
5%
NewT-HDF Line
47%
Improvements in Botucatu -
MDP
5%
Recycling
2%
Improvements in Salto -
Hardboard5%
ChemicalSustainability
1%
Other Sustainability Investments
12%
4Q08 12M08
69.9
154.4
Capex (R$ MM)
4Q07 4Q08
27.7
69.9
Capex (R$ MM)
17
» The line is scheduled to commence operations by the end of 2009.
New T-HDF Line
EBITDA
Margin
50 %
T-HDF: Product similar to MDF, but with
superior density and quality.
Installed Capacity Growth (in m²) 110 million m²/ year
Installed Capacity Growth (in m³) 275 thousand m³/ year
Additional Gross Revenue R$ 250 million
EBITDA R$ 90 million
New T-HDF Line
18
New T-HDF Line
19
New T-HDF Line
Blueprint of the new T-HDF unit (Thin High Density Fiberboard)
20
Debt
Debt (R$ Million) 4Q08 4Q07 Var. (%)
Short Term Debt 35.7 20.1 77.5%
Long Term Debt 57.8 68.3 -15.3%
Gross Debt 93.5 88.4 5.8%
Cash and Cash Equivalents 11.0 11.0 0.1%
Net Debt 82.5 77.4 6.6%
% Short Term Debt 38% 23% +15.0 p.p.
Net Casth (Debt)/EBITDA 0.6 0.7 -8.0%
2006 2007 2008
0.8 x
0.7 x
0.6 x
Net Debt vs Ebtida
Net Debt / EBITDA
Short
Term
38%
LongTerm
62%
Debt Profile
4Q08
21
Capital Markets
21** Source: Eucatex and Bloomberg – April 2, 2009
EV/EBITDA* Ratio
EUCATEX x Brazilian Peers
EUCA4 vs. IBOV
» Price of EUCA4 on December 31, 2008: R$ 2.90
» Variation between January 1, 2007 and April 1, 2009:
EUCA4: -16.7% IBOV: -8%
* Source: Eucatex and Bloomberg - April 2, 2009 *** Source: Bloomberg – April 2, 2009
EV/EBITDA** Ratio
EUCATEX x International Peers
MASISA SA COPEC
(Arauco)
0
100
200
300
400
500
600
700
800
900
1000
-
1,00
2,00
3,00
4,00
5,00
6,00
7,00
8,00
9,00
10,00
Vol. Fin.
(R$mil)
Preço fech.
(R$)
Vol('000) EUCA4 IBOV base 100
4T08
2.4 x
4.4 x 4.70 x
2.4 x
7.5 x
10.7 x (***)
Duratex* Satipel
22
» New T-HDF/MDF line – strategically differentiated from competition;
» Exports – traditional exporter of thin boards, with own office in the USA;
» Differentiated electric and thermal power costs: electric energy purchase
agreement till 2012 (including for the new T-HDF line) and self-sufficiency in
biomass for thermal power generation through its pioneer recycling project;
» Forest self-sustainability guaranteed by 44,000 hectares of forest area with ISO
14001 certification and Green Seal granted by FSC;
» Paint segment with above-market growth rates and installed capacity to sustain
this growth;
» Concluding phase of real estate properties launched between 2006 and 2008,
provides excellent prospects for the markets where we operate; and
» Higher share appreciation potential (EV/EBITDA) compared to peers.
Final Remarks
23
IR Contact
José Antonio G. de Carvalho
Executive Vice President and Investor Relations Officer
(11) 3049-2361
ri@eucatex.com.br
www.eucatex.com.br/ri

Presentations

  • 1.
  • 2.
    2 Disclaimer This presentation includesforward‐looking statements that are subject to risks and uncertainties based on the beliefs and assumptions of the management of Eucatex S.A. Indústria e Comércio, and on information currently available to the Company. Forward‐looking statements are not guarantees of performance. They involve risks, uncertainties and assumptions because they relate to future events and therefore depend on circumstances that may or may not occur. Investors should understand that overall economic conditions, industry conditions and other operating factors may affect the company’s future results and may lead to results that differ materially from those expressed in such forward‐looking statements.
  • 3.
    4Q08 Highlights 3 » Financialresults  Gross revenue came to R$ 216.4 million in the 4Q08, versus R$ 202.7 million in the 4Q07, up 6.8%, and R$ 865.5 million in 2008, 13.1% higher than in 2007;  Gross margin of 32.3% in 2008, 0.6 p.p. up on the 31.7% recorded in 2007;  EBITDA was R$ 181.1 million in 2008, 60.1% higher than 2007; excluding non-recurring adjustments of tax provisions, EBITDA was R$ 130.4 million, representing growth of 15.2% over 2007;  EBITDA Margin before non-recurring adjustments of tax provisions, grew by 0.5 p.p. in 2008. » Sales growth  Excellent sales performance in the Paint and Laminate Flooring segments in 2008 , with growth of 30% and 17% respectively, in relation to 2007. » Construction of new T-HDF/MDF line  The line should go operational at the end of 2009, increasing the Group’s gross revenue by R$ 250 million and cash flow by R$ 90 million when it reaches its full annual capacity.
  • 4.
    4 Revenue Breakdown » Highlights Eucatex’s paints segment represented 20% of revenue in the 4Q08, compared with 18% in the 4Q07.  Lower share of MDP panels in revenue due to the 15-day stoppage at the Botucatu Unit. 33% 32% 10% 20% 5% Distribuiçãoda ReceitaBruta - 4T08 Chapas de Fibra Painéis MDP Pisos Laminados SegmentoTintas Outros 32% 34% 9% 18% 7% Distribuiçãoda ReceitaBruta - 4T07Gross Revenue Breakdown – 4Q08 Laminate Flooring Other Hardboard Gross Revenue Breakdown – 4Q07 Paint Segment MDP Panels 4Q074Q08 Home Building 37,1% Furniture Industry 57,7% Others 5,2% Home Building 35.0% Furniture Industry 58.40% Others 6,6%
  • 5.
    5 » The firstand largest unit of the Eucatex Group.  Location: Salto-SP  Area: Land – 540,000 m² / Built area – 153,000 m²  Gross Revenue in 2008: R$ 285 million (20 % from exports to over 25 countries)  Number of employees: 808 » Main products and installed capacity in the year:  Hardboard 240,000 m³  Panels and Doors 1,800,000 pc  Paint Capacity 50,000,000 m² Boards Unit
  • 6.
    Hardboard 12M08 12M07 91% 84% UtilizaçãodaCapacidade Instalada Chapa de Fibra 12M08 12M07 45% 43% Market Share (MercadoInterno) Chapa de Fibra 6 100 106 0,5 0,6 0,7 0,8 0,9 1 1,1 1 21 41 61 81 101 121 2007 2008 Preço x Custo - Chapa de Fibra Volumes m2 (base 100) Preço-Custo (base 100) Hardboard Installed Capacity Used Price vs. Cost - Hardboard Volume m² (base 100) 1.1 0.9 Market Share (Domestic Market) Hardboard Price-Cost (base 100) 0.8 0.7 0.6 0.5
  • 7.
    7 The only plantin Latin America capable of laminating paper during the production of MDP panels.  Location: Botucatu-SP  Area: Land 372,000 m²/ Built area: 62,000m²  Gross Revenue in 2008: R$ 359 million  Number of Employees: 368 Main products and installed capacities in the year:  MDP 430,000 m³  Flooring 7,200,000 m²  Low pressure finishing (BP) and Lacca 20,000,000 m² MDP and Flooring Unit
  • 8.
    MDP Panels 12M08 12M07 89%91% Utilizaçãoda Capacidade Instalada Painéis MDP 12M08 12M07 13% 14% Market Share Painéis MDP 8 100 94 0,50 0,60 0,70 0,80 0,90 1,00 1,10 1,4 21,4 41,4 61,4 81,4 101,4 121,4 2007 2008 Análise de Volume e Preçox Custo - MDP Volumes m2 (base 100) Preço-Custo (base 100) Installed Capacity Used Volume m² (base 100) MDP Panels Analysis of Volume and Price vs. Cost - MDP Price-Cost (base 100) MDP Panels
  • 9.
    Wood Sales Mix »Eucatex’s sales mix has larger market share of coated products in relation to market peers; » In the 4Q08, coated products, which have higher value added, represented 98% of the MDP produced; and » Lacca accounted for 24% of MDP sales in 2008. (*) Fonte: ABIPA e Empresas 9 » The company offers differentiated products such as Eucatop and Lacca. 4T07 4T08 Mercado- 12M08 90% 99% 25% Proporção de MDP revestido EUCATEX Cru Revestido Share of coated MDP Standard Coated 4Q07 4Q08 Market – 12M08 (*) Source: ABIPA and Companies
  • 10.
    Flooring 12M08 12M07 62% 55% UtilizaçãodaCapacidade Instalada Pisos Laminados 12M08 12M07 31% 31% Market Share Pisos Laminados 10 100 113 - 0,20 0,40 0,60 0,80 1,00 1,20 90 95 100 105 110 115 2007 2008 Análise de Volume e Preço x Custo- Pisos Volumes m2 (base 100) Preço-Custo (base 100) Analysis of Volume and Price vs. Cost - Flooring Installed Capacity Used Laminate Flooring Laminate Flooring Volume m² (base 100) Price-cost (base 100) 1.20 0.20 0.80 1.00 0.40 0.60
  • 11.
    Paint and VarnishUnit Inaugurated in 1994, this unit is one of the most modern in Latin America, thanks to its state-of-the art equipment and high-tech laboratory.  Location: Salto-SP  Area: Land: 960,000 m² / Built area: 36,000 m²  Gross Revenue in 2008: R$ 153 million  Number of Employees: 199 Installed capacity in the year:  Capacity: 36 million gallons/year 11
  • 12.
    12 Paints 12M08 12M07 40% 33% UtilizaçãodaCapacidade Instalada 12M08 12M07 6% 6% Market Share (*) (*) estimativa Eucatex 100 121 0,50 0,60 0,70 0,80 0,90 1,00 1,10 - 20 40 60 80 100 120 140 2007 2008 Análise Volume e Preço x Custo - Tintas Volumes m2 (base 100) Preço-Custo (base 100) Analysis of Volume and Price vs. Cost - Paint Installed Capacity Used Volume m² (base 100) Price-cost (base 100) (*) Eucatex’s estimates 1.00 0.90 0.80 0.70 0.60 0.50 1.10
  • 13.
    13 Financial Highlights Highlights 4Q08(R$ MM) 4Q08 4Q07 Var. (%) 12M08 12M07 Var. (%) Net Revenue 175.0 164.4 6.4% 700.9 623.5 12.4% Cost of Good Sold (117.1) (110.6) n.m (474.6) (425.9) n.m Gross Income 57.9 53.8 7.6% 226.4 197.6 14.6% Gross Margin (%) 33.1% 32.7% +0,4 p.p. 32.3% 31.7% +0,6 p.p. Adm. And Comercial Expenses (34.9) (32.8) n.m (138.9) (125.7) n.m Others Operational Costs 41.8 5.3 795.8% 49.5 (1.3) n.m EBITDA 75.4 38.0 98.6% 181.1 113.1 60.1% Margin EBITDA (%) 43.1% 23.1% +20,0 p.p. 25.8% 18.1% +7,7 p.p. Net Financial Income (27.5) 0.6 n.m (64.0) (1.6) n.m Non Operating Income 37.4 26.9 39.1% 72.9 69.1 5.6% Taxes (9.7) (0.2) n.m (13.6) (0.2) n.m Net Icome 27.7 26.6 3.9% 59.3 68.9 -13.8% 4Q07 4Q08 53.8 57.9 Gross Income (R$ MM) and Gross Margin (%) 33.1% 32.7% - 20,0 40,0 60,0 80,0 4Q07 4Q08 38.0 75.4 EBITDA(R$ MM) and EBITDA Margin (%) 43.1% 23.1%
  • 14.
    2008 Financial Result 14 MonetaryVariation - Taxes 30.290 Monetary and Exchange Variation 29.757 Interest on Loans and Financing 7.757 Bank Expenses and Commissions 2.560 Others (6.408) R$ '000 TOTAL FINANCIAL EXPENSES 63.955
  • 15.
    15 » Forests • TheCompany has 57 eucalyptus farms, totaling 44,000 hectares • Average Radius - Salto – 122 km • Average Radius - Botucatu – 60 km • New Forests Planted in 2007 – 5,400 ha* • New Forests Planted in 2008 – 4,500 ha* • Forests with ISO 14001 certification and Green Seal granted by FSC Guaranteed sustainability and possibility of new projects. Sustainability * ha = hectare » Wood Recycling Project • Average Scrap Collection Radius – 150 km • Volume Processed in 2008 – 88,000 tonnes • This annualized volume would represent 900 hecta of forests, or an investment of R$ 10 million per ye in land alone.
  • 16.
    Capex 16 Investments - R$Million 12M08 New T-HDF Line 72.0 Forests 36.0 Other Sustainability Investments 19.0 Improvements in Salto - Hardboard 8.3 Improvements in Botucatu - MDP 7.7 Farm Leases 7.0 Recycling 2.4 Chemical Sustainability 2.0 Total 154.4 Forests 23% FarmLeases 5% NewT-HDF Line 47% Improvements in Botucatu - MDP 5% Recycling 2% Improvements in Salto - Hardboard5% ChemicalSustainability 1% Other Sustainability Investments 12% 4Q08 12M08 69.9 154.4 Capex (R$ MM) 4Q07 4Q08 27.7 69.9 Capex (R$ MM)
  • 17.
    17 » The lineis scheduled to commence operations by the end of 2009. New T-HDF Line EBITDA Margin 50 % T-HDF: Product similar to MDF, but with superior density and quality. Installed Capacity Growth (in m²) 110 million m²/ year Installed Capacity Growth (in m³) 275 thousand m³/ year Additional Gross Revenue R$ 250 million EBITDA R$ 90 million New T-HDF Line
  • 18.
  • 19.
    19 New T-HDF Line Blueprintof the new T-HDF unit (Thin High Density Fiberboard)
  • 20.
    20 Debt Debt (R$ Million)4Q08 4Q07 Var. (%) Short Term Debt 35.7 20.1 77.5% Long Term Debt 57.8 68.3 -15.3% Gross Debt 93.5 88.4 5.8% Cash and Cash Equivalents 11.0 11.0 0.1% Net Debt 82.5 77.4 6.6% % Short Term Debt 38% 23% +15.0 p.p. Net Casth (Debt)/EBITDA 0.6 0.7 -8.0% 2006 2007 2008 0.8 x 0.7 x 0.6 x Net Debt vs Ebtida Net Debt / EBITDA Short Term 38% LongTerm 62% Debt Profile 4Q08
  • 21.
    21 Capital Markets 21** Source:Eucatex and Bloomberg – April 2, 2009 EV/EBITDA* Ratio EUCATEX x Brazilian Peers EUCA4 vs. IBOV » Price of EUCA4 on December 31, 2008: R$ 2.90 » Variation between January 1, 2007 and April 1, 2009: EUCA4: -16.7% IBOV: -8% * Source: Eucatex and Bloomberg - April 2, 2009 *** Source: Bloomberg – April 2, 2009 EV/EBITDA** Ratio EUCATEX x International Peers MASISA SA COPEC (Arauco) 0 100 200 300 400 500 600 700 800 900 1000 - 1,00 2,00 3,00 4,00 5,00 6,00 7,00 8,00 9,00 10,00 Vol. Fin. (R$mil) Preço fech. (R$) Vol('000) EUCA4 IBOV base 100 4T08 2.4 x 4.4 x 4.70 x 2.4 x 7.5 x 10.7 x (***) Duratex* Satipel
  • 22.
    22 » New T-HDF/MDFline – strategically differentiated from competition; » Exports – traditional exporter of thin boards, with own office in the USA; » Differentiated electric and thermal power costs: electric energy purchase agreement till 2012 (including for the new T-HDF line) and self-sufficiency in biomass for thermal power generation through its pioneer recycling project; » Forest self-sustainability guaranteed by 44,000 hectares of forest area with ISO 14001 certification and Green Seal granted by FSC; » Paint segment with above-market growth rates and installed capacity to sustain this growth; » Concluding phase of real estate properties launched between 2006 and 2008, provides excellent prospects for the markets where we operate; and » Higher share appreciation potential (EV/EBITDA) compared to peers. Final Remarks
  • 23.
    23 IR Contact José AntonioG. de Carvalho Executive Vice President and Investor Relations Officer (11) 3049-2361 ri@eucatex.com.br www.eucatex.com.br/ri