Download as PDF, PPTX
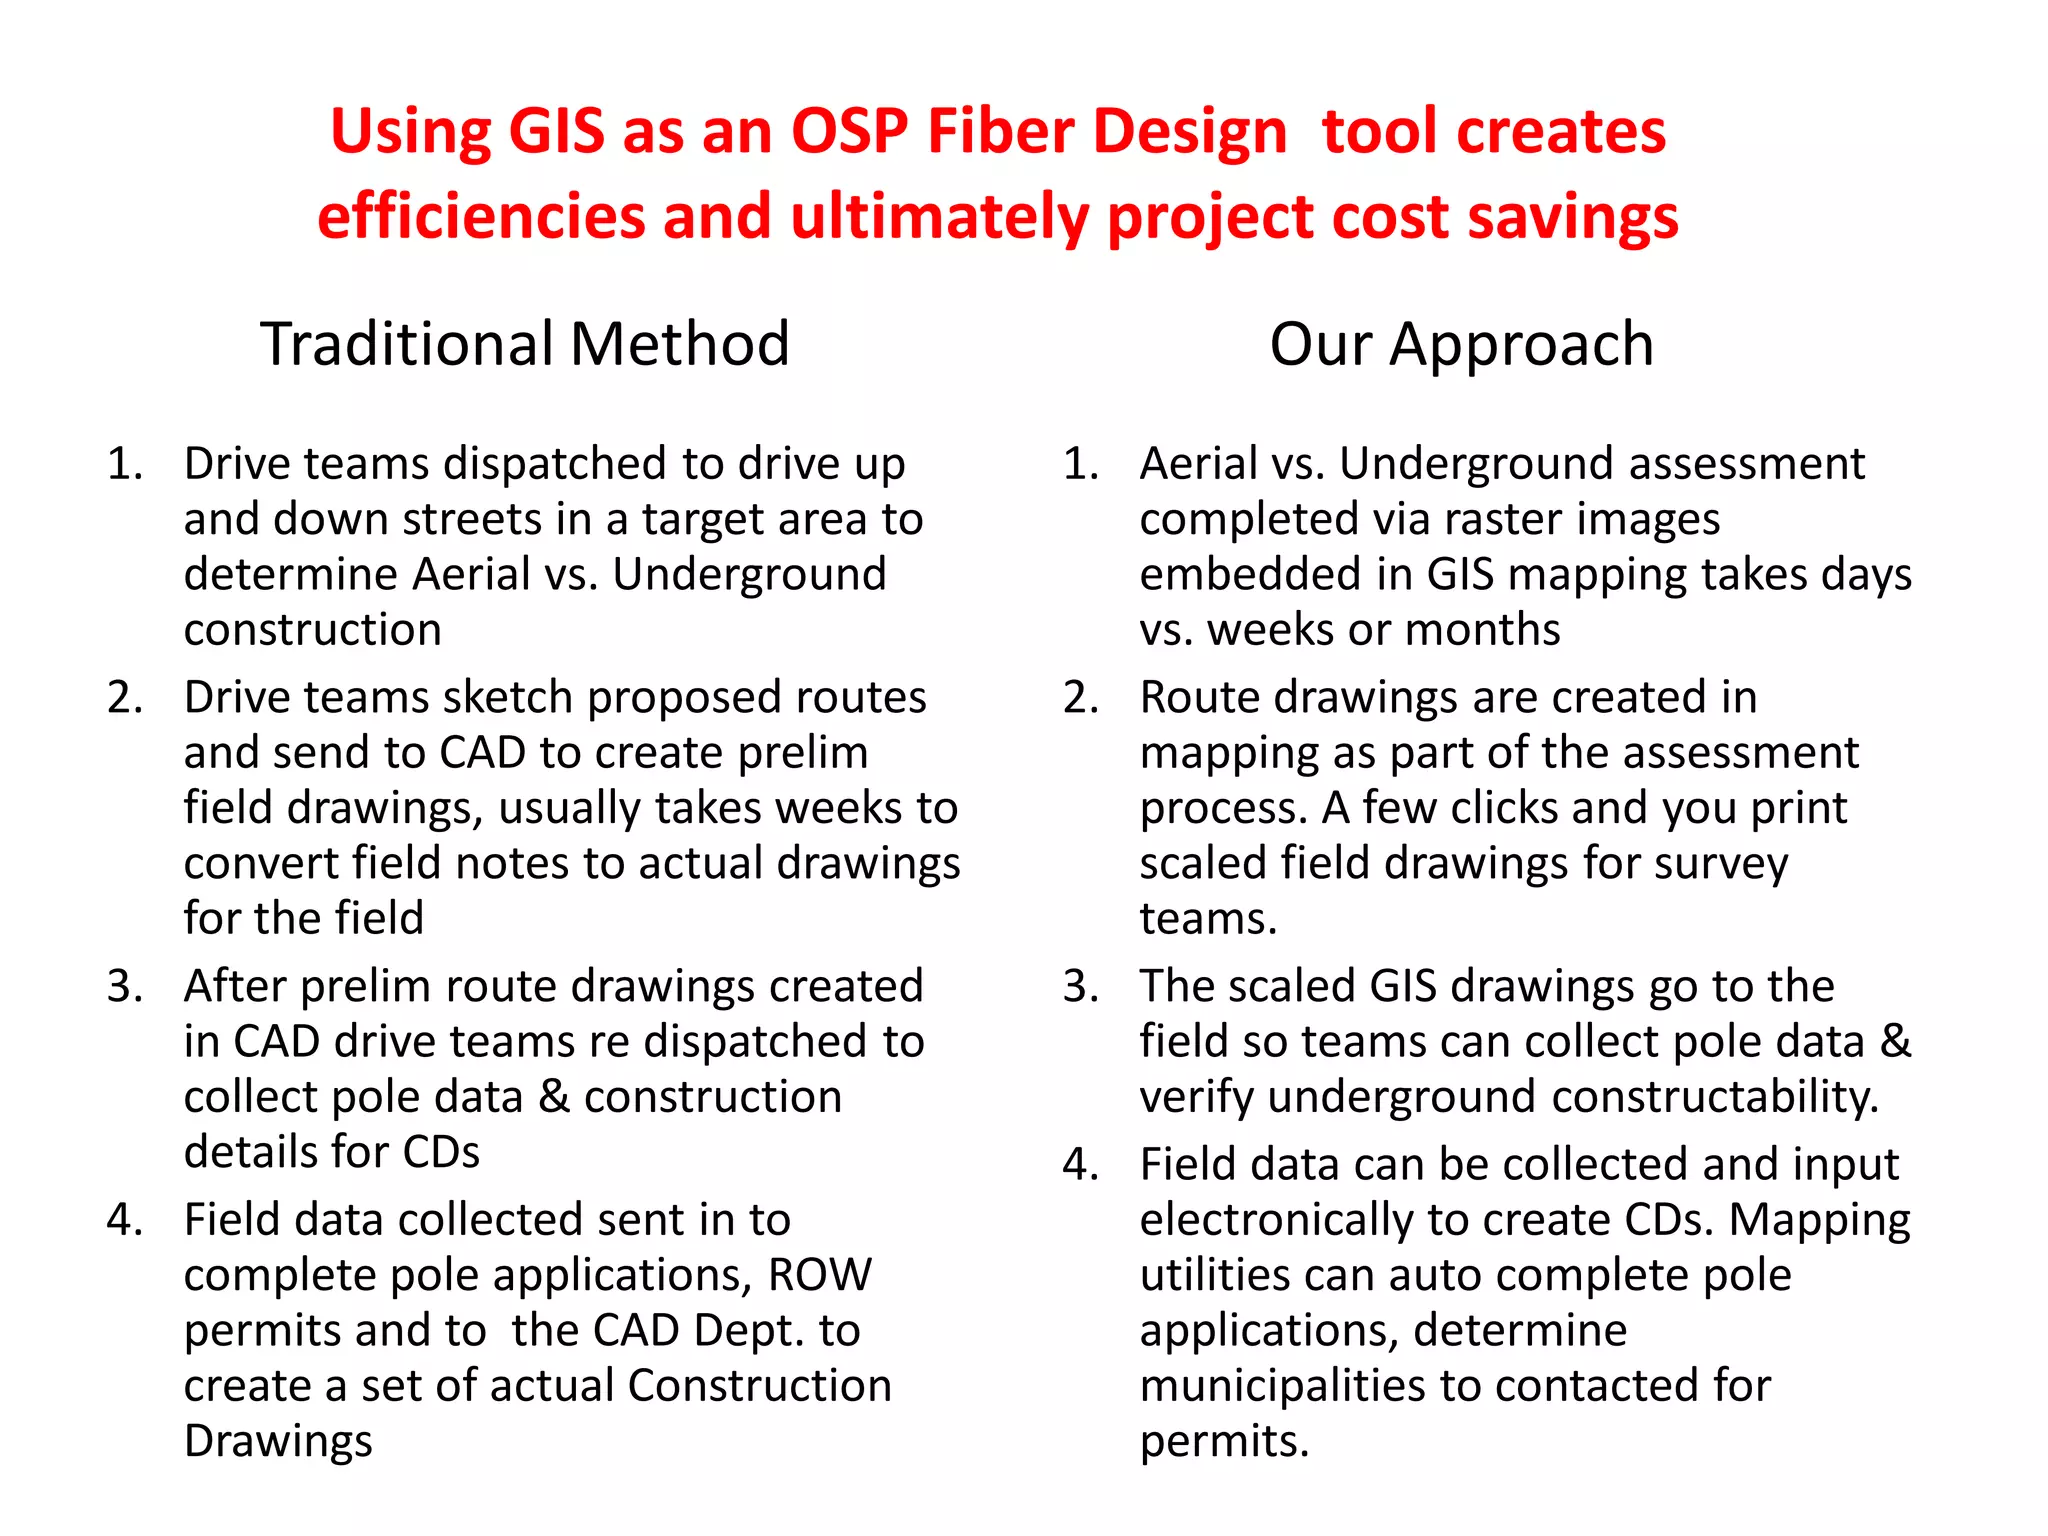
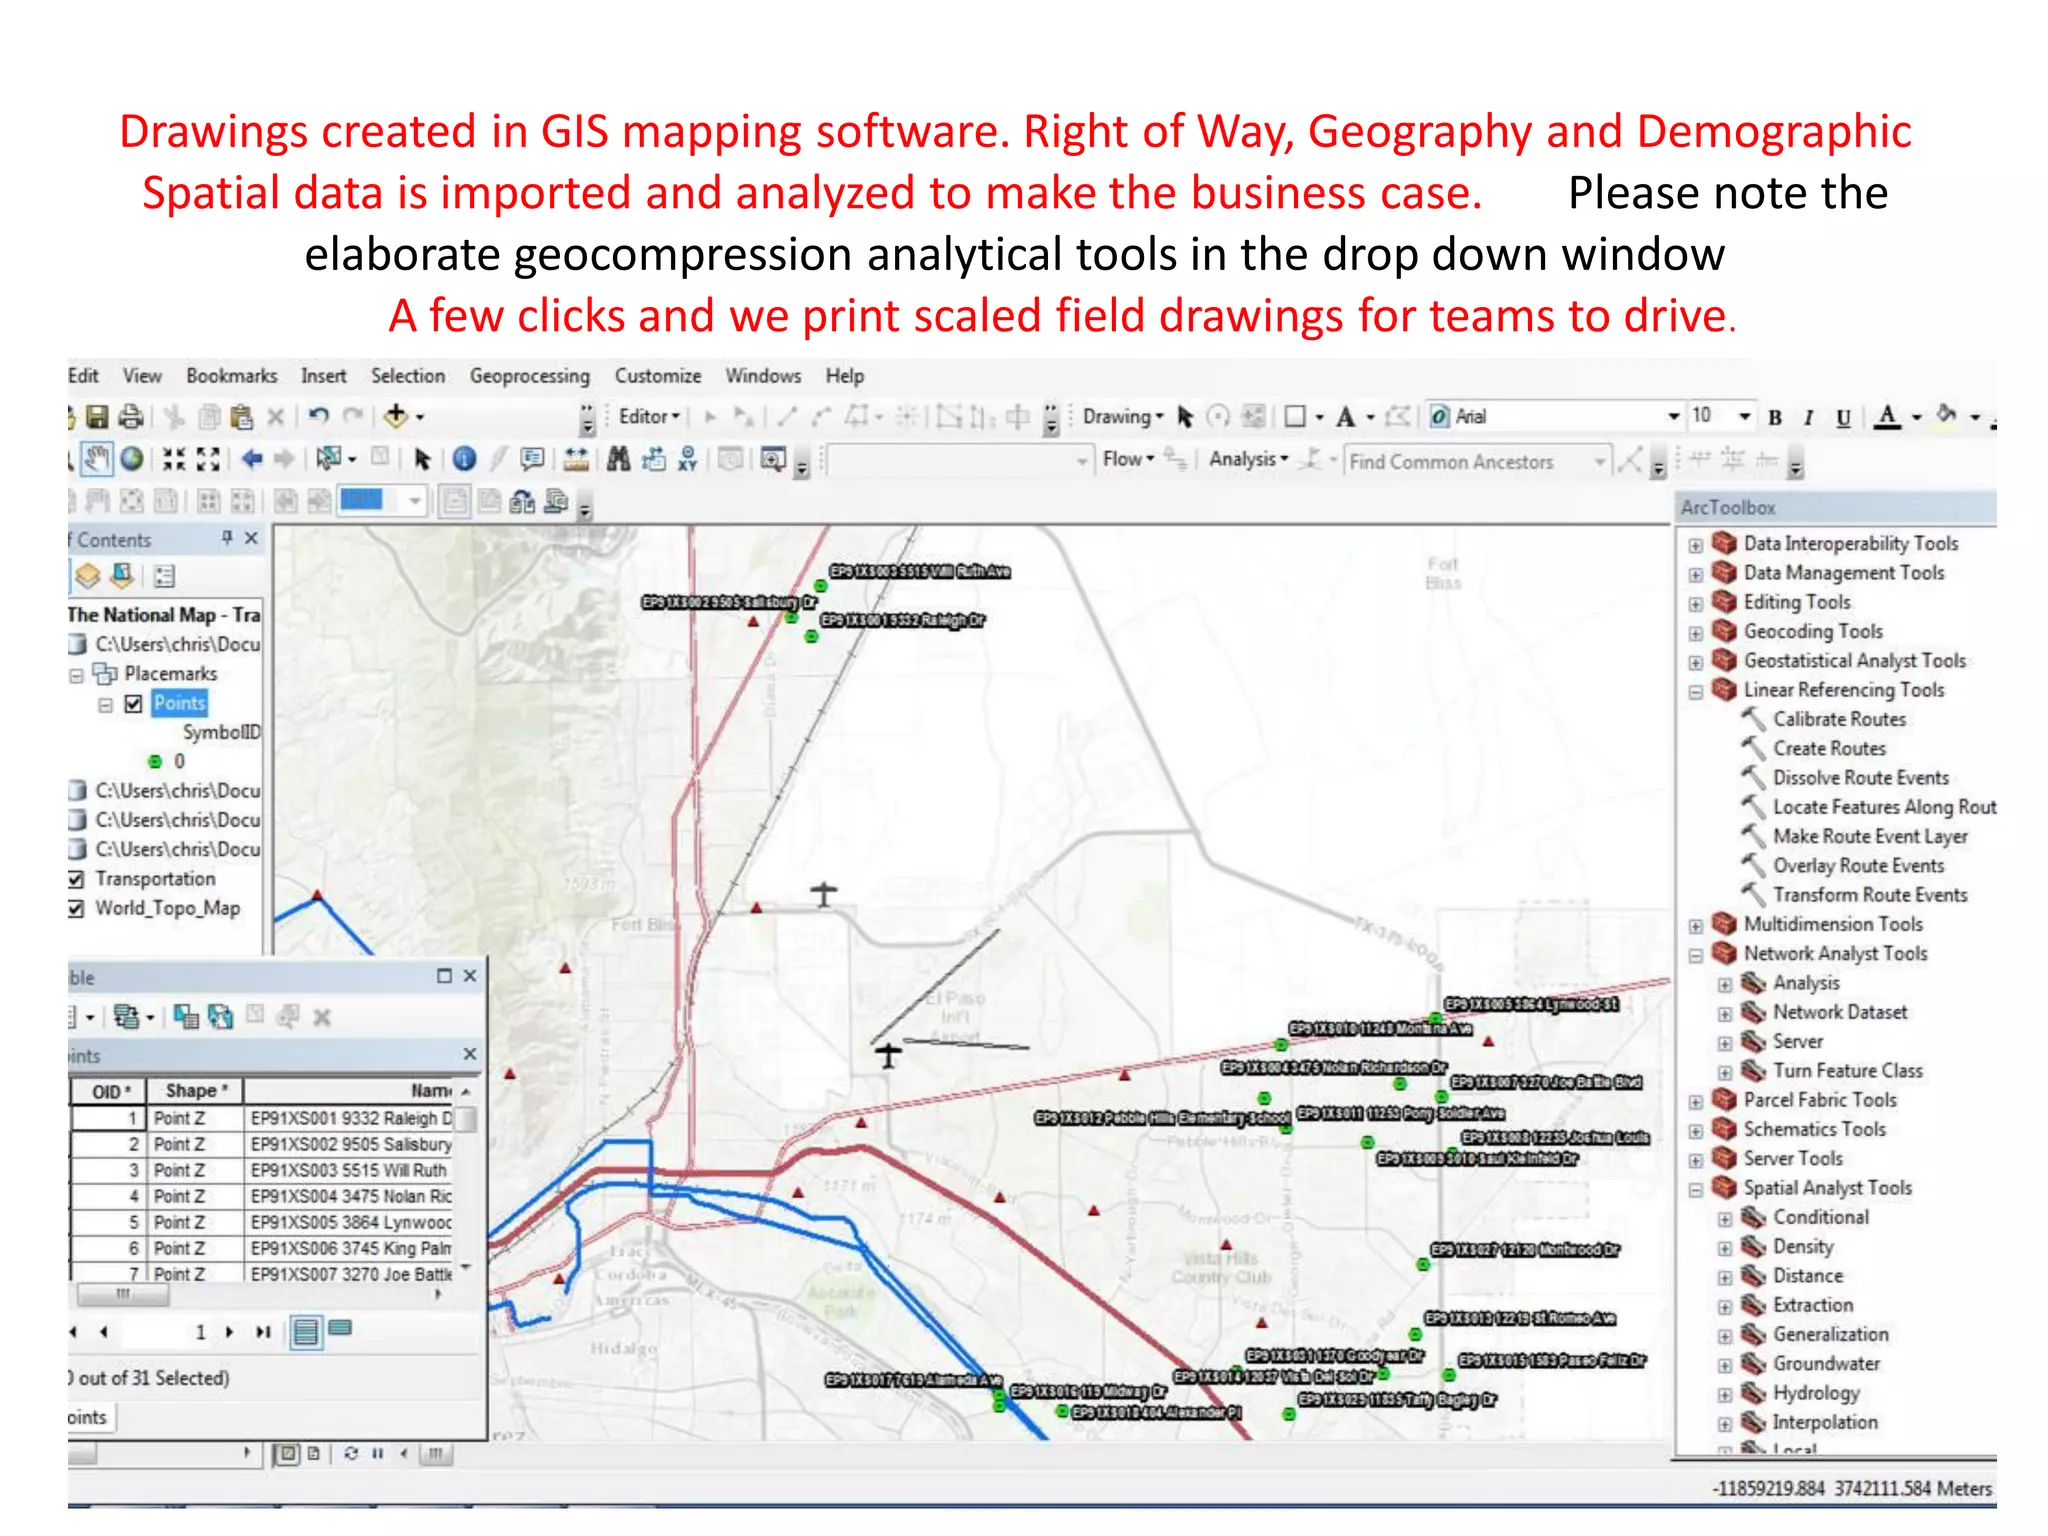
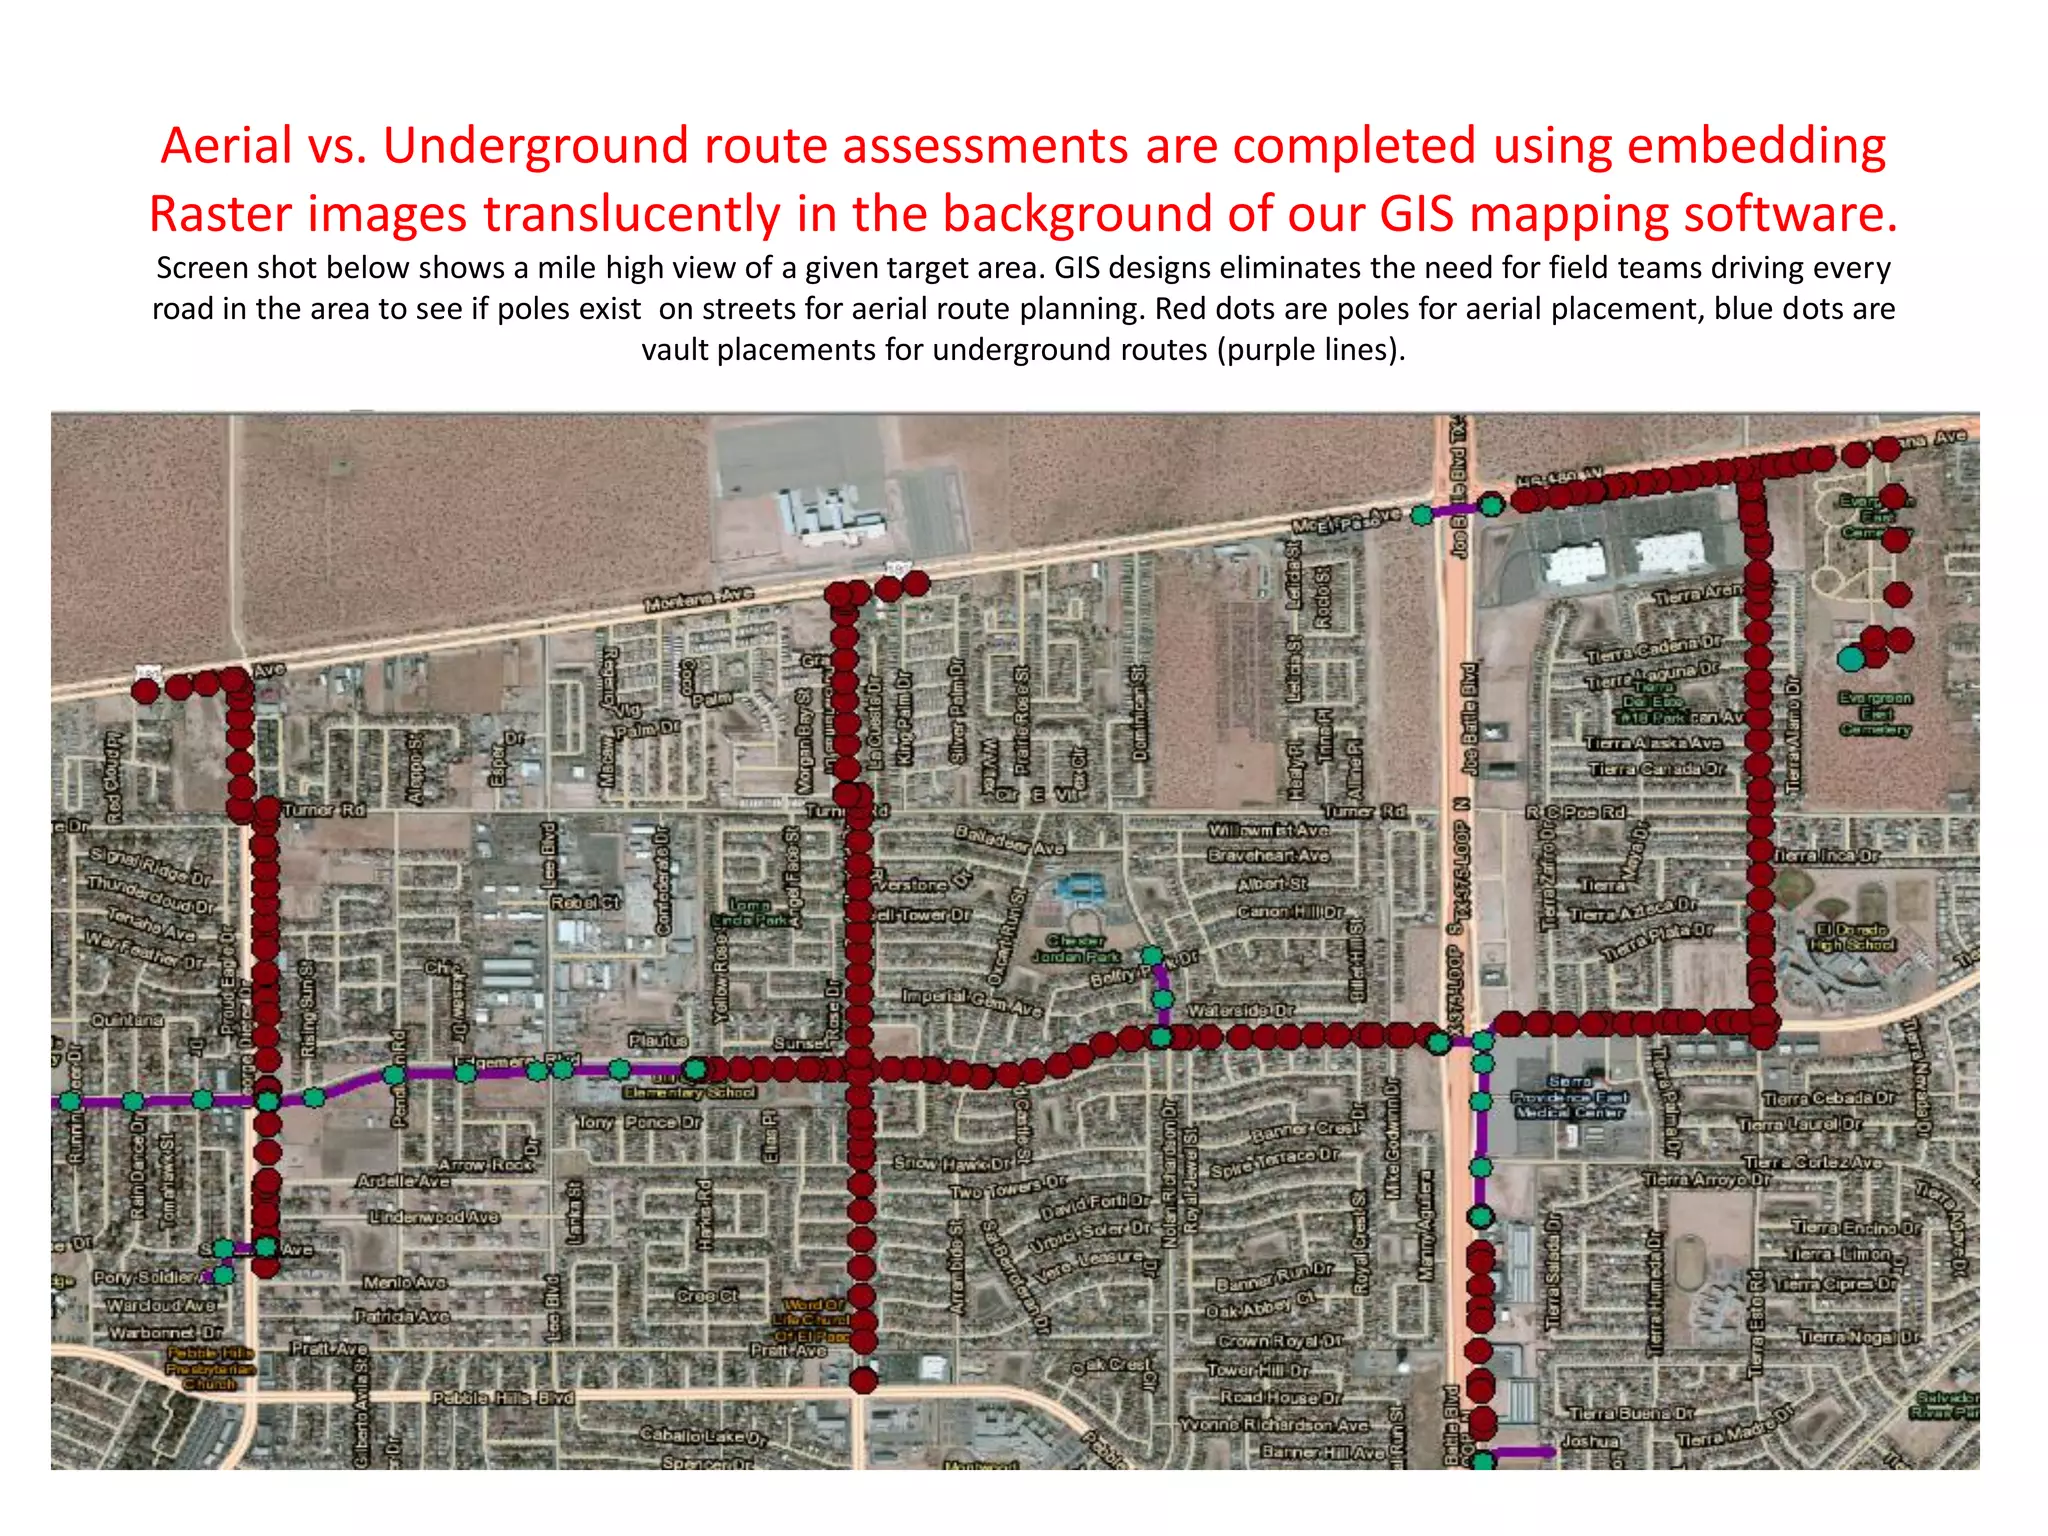
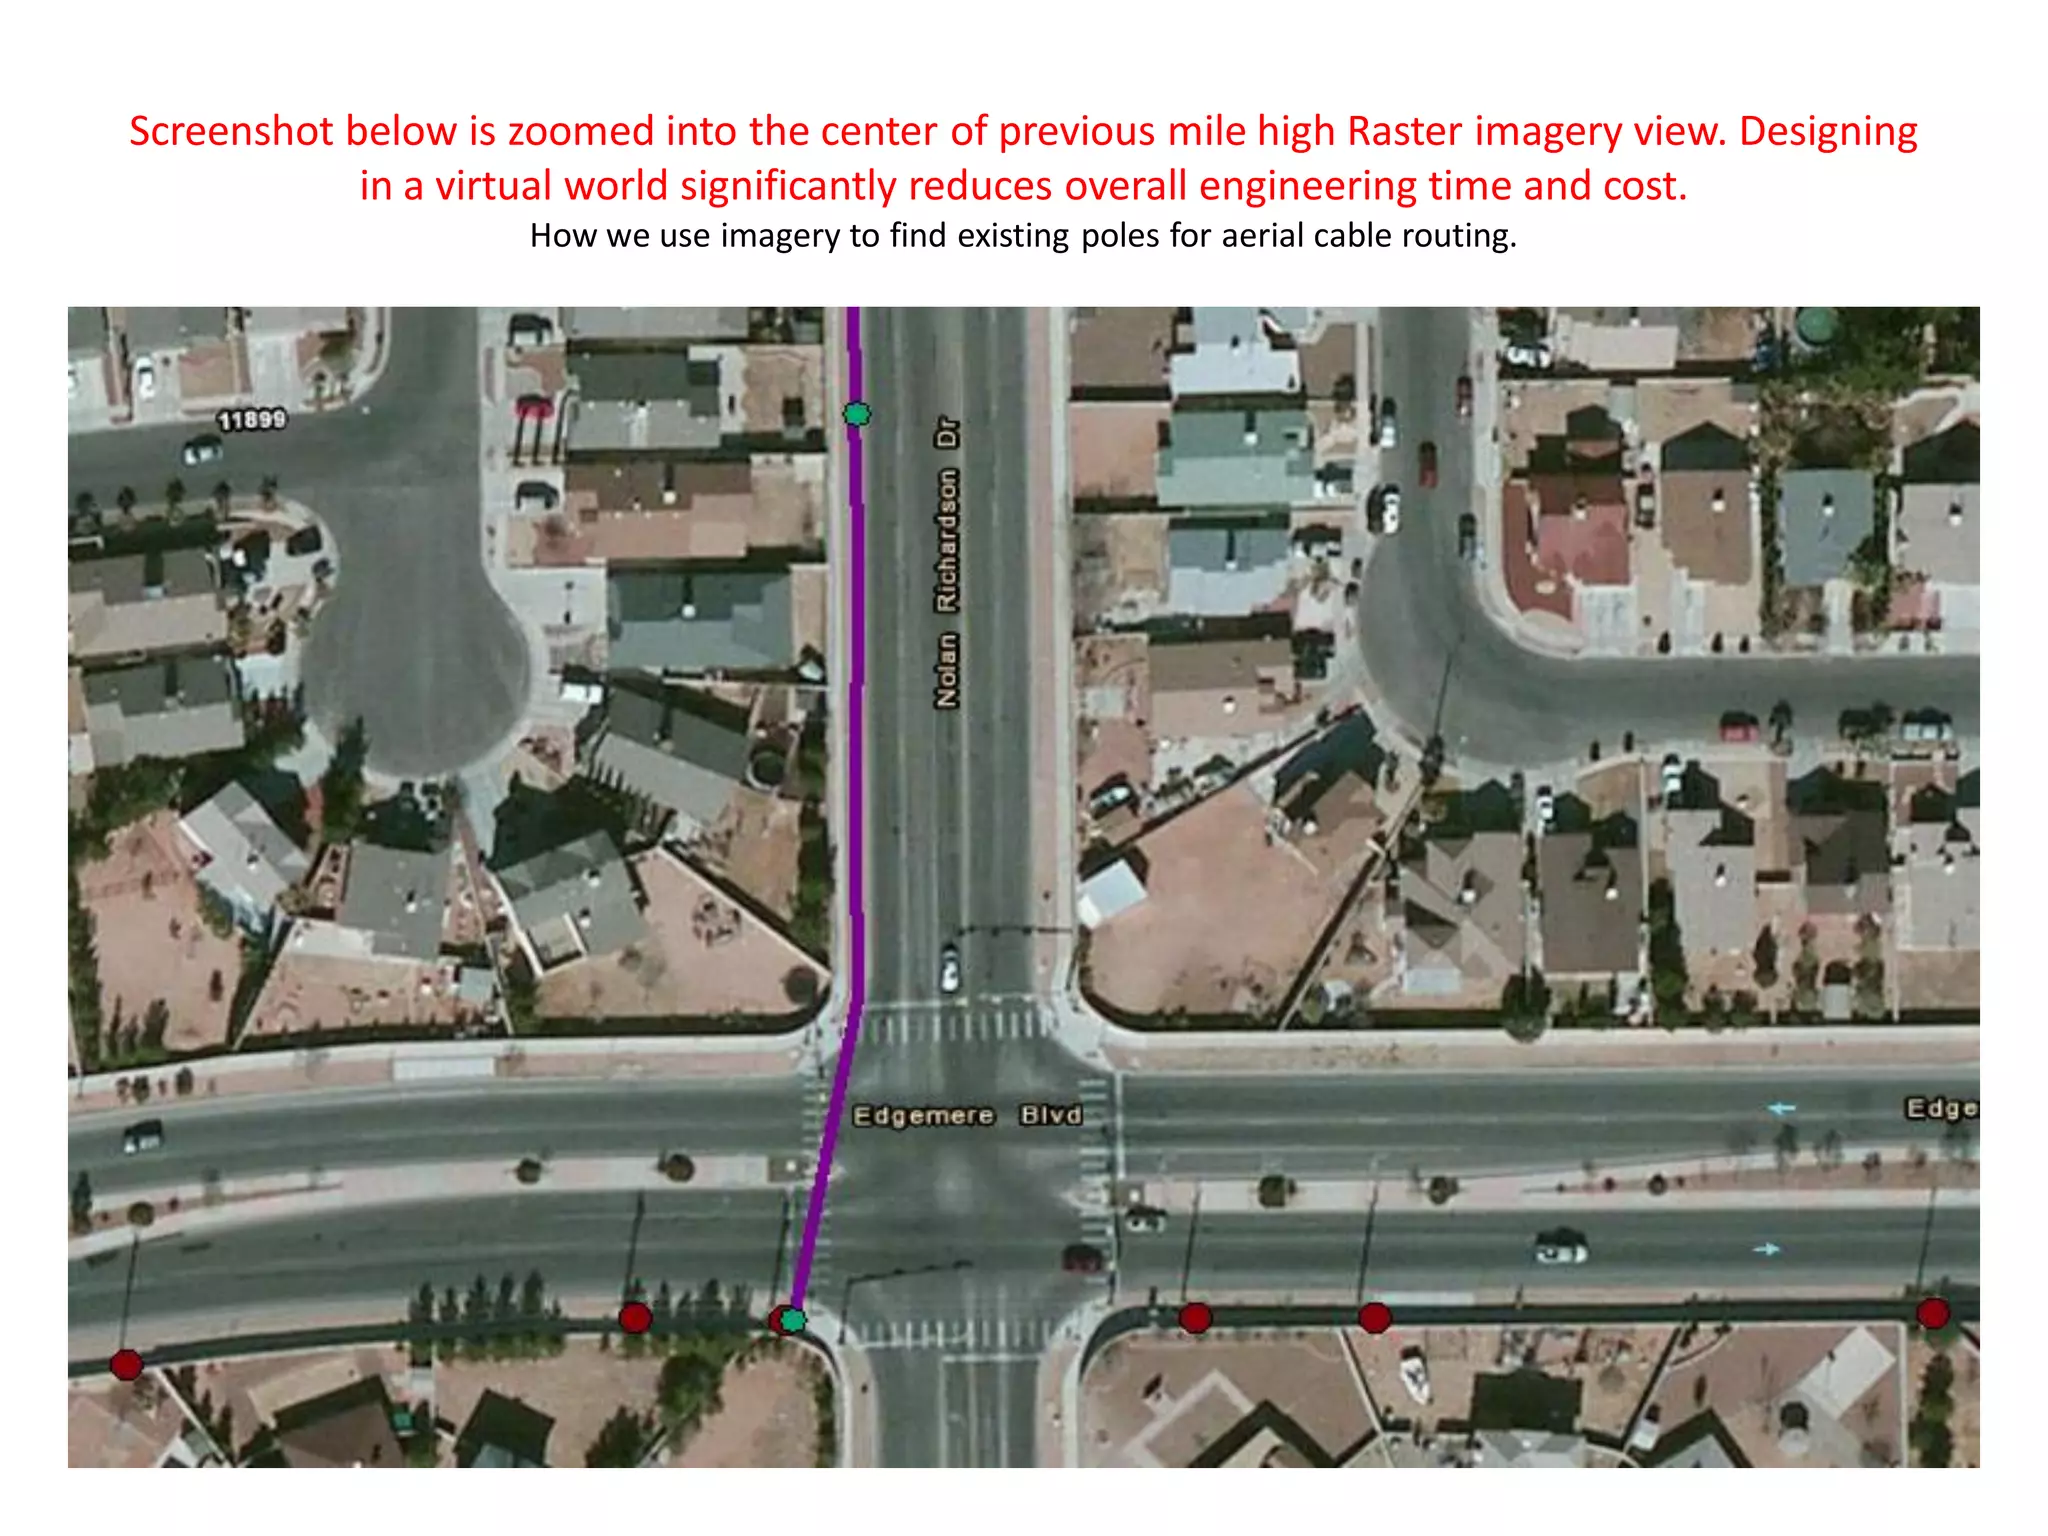
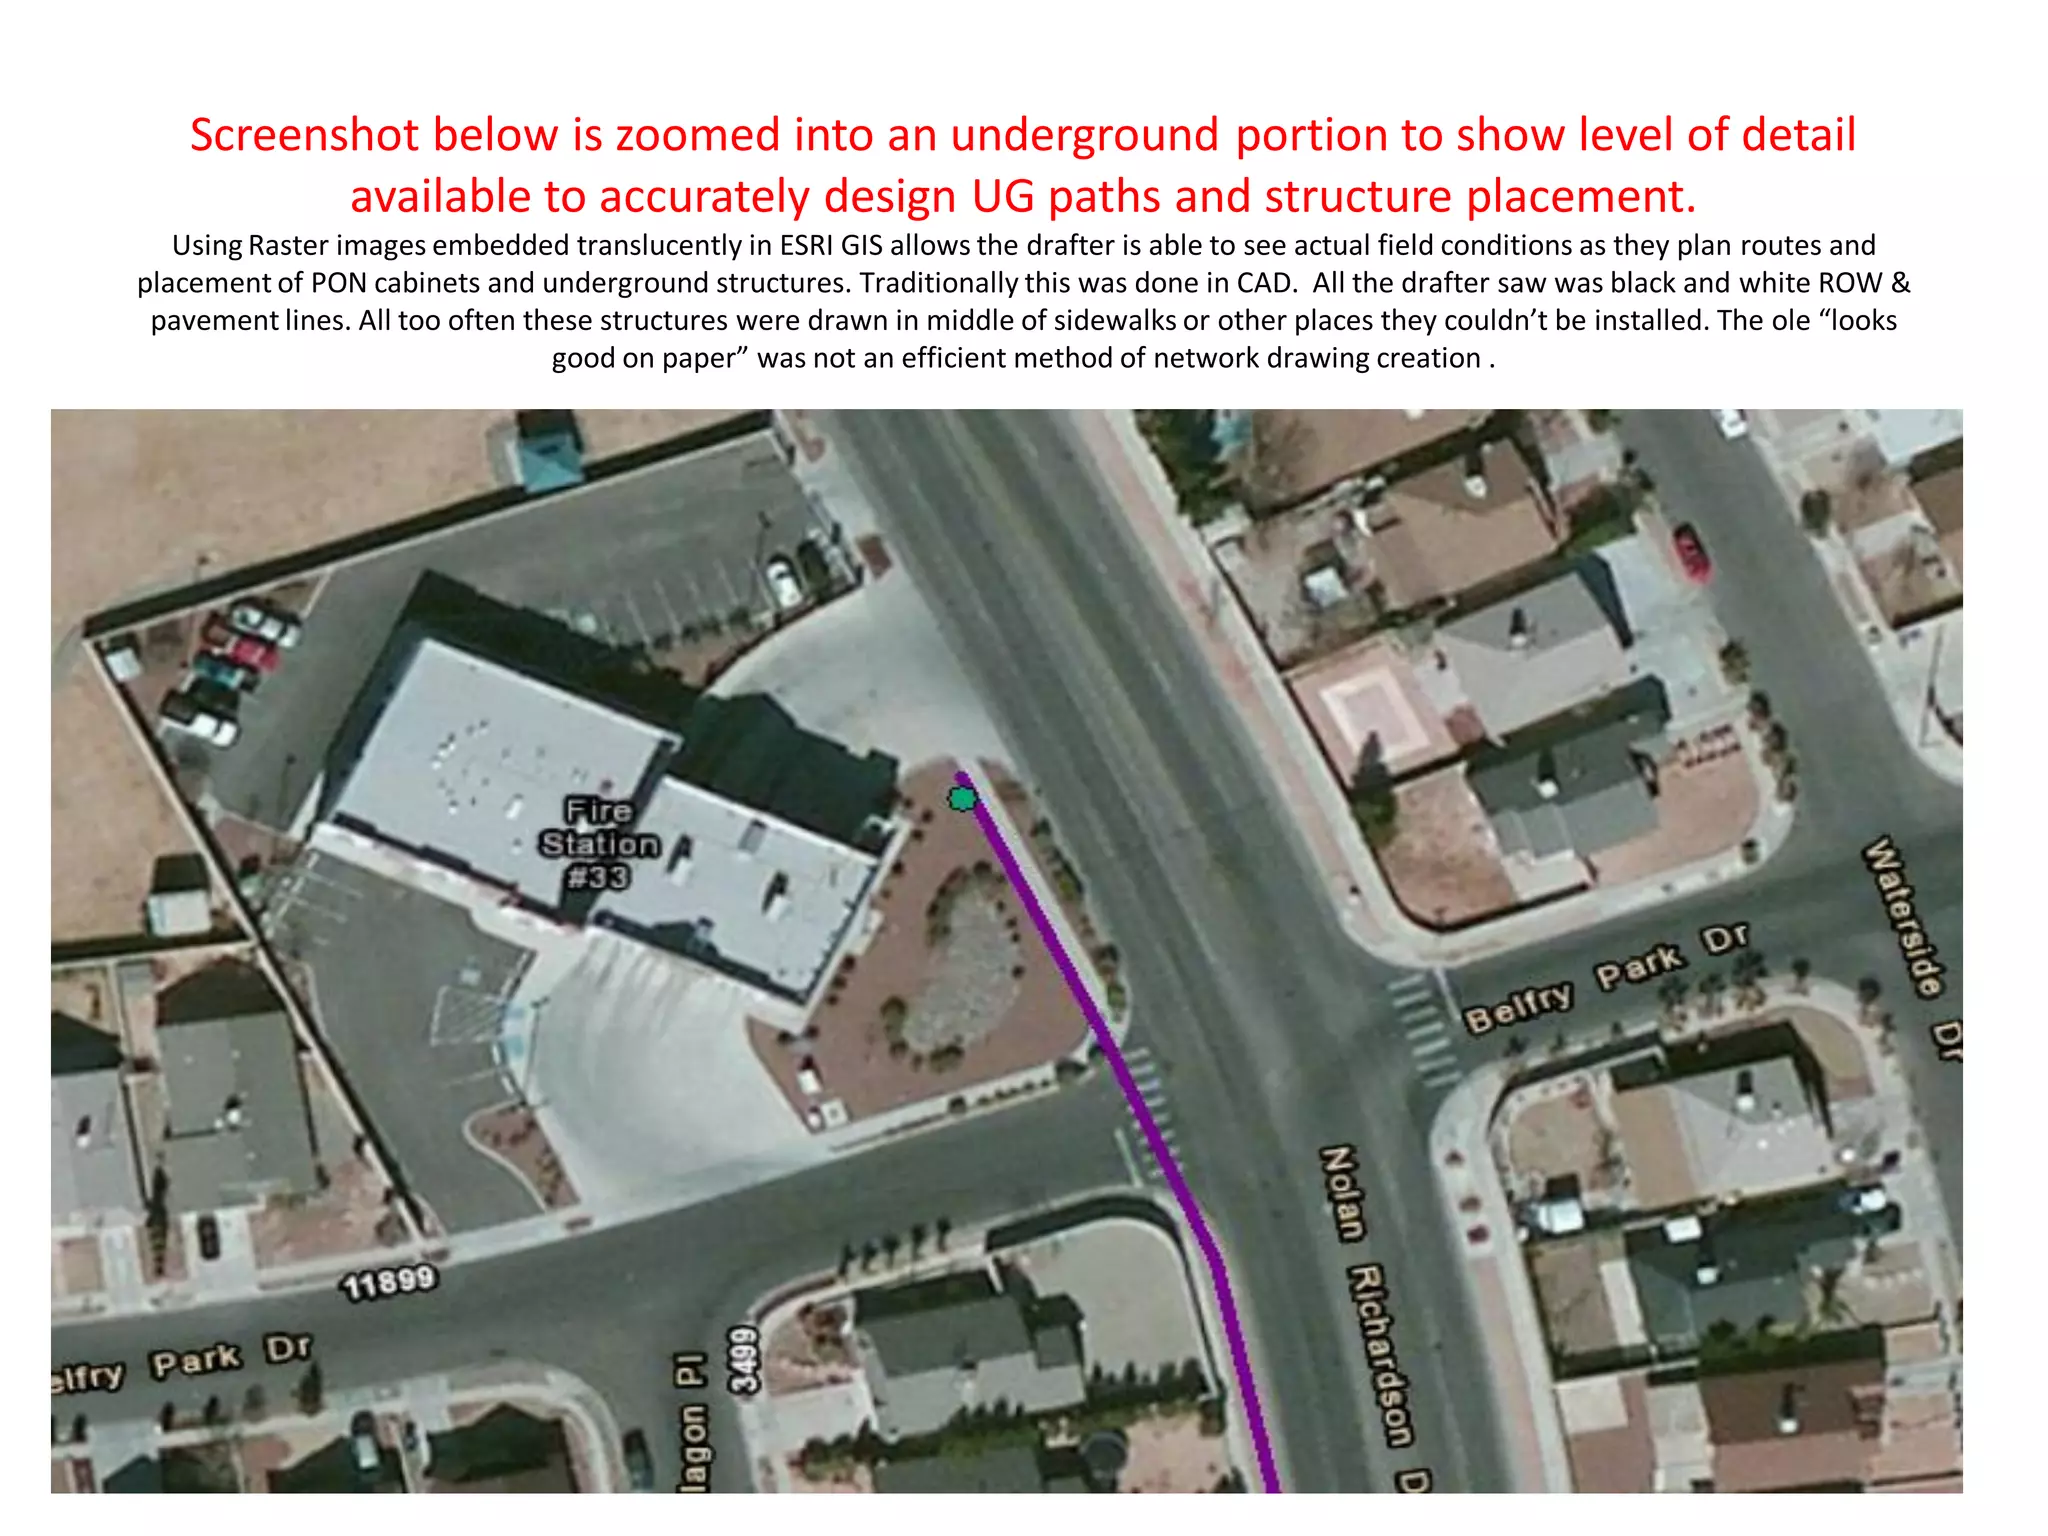
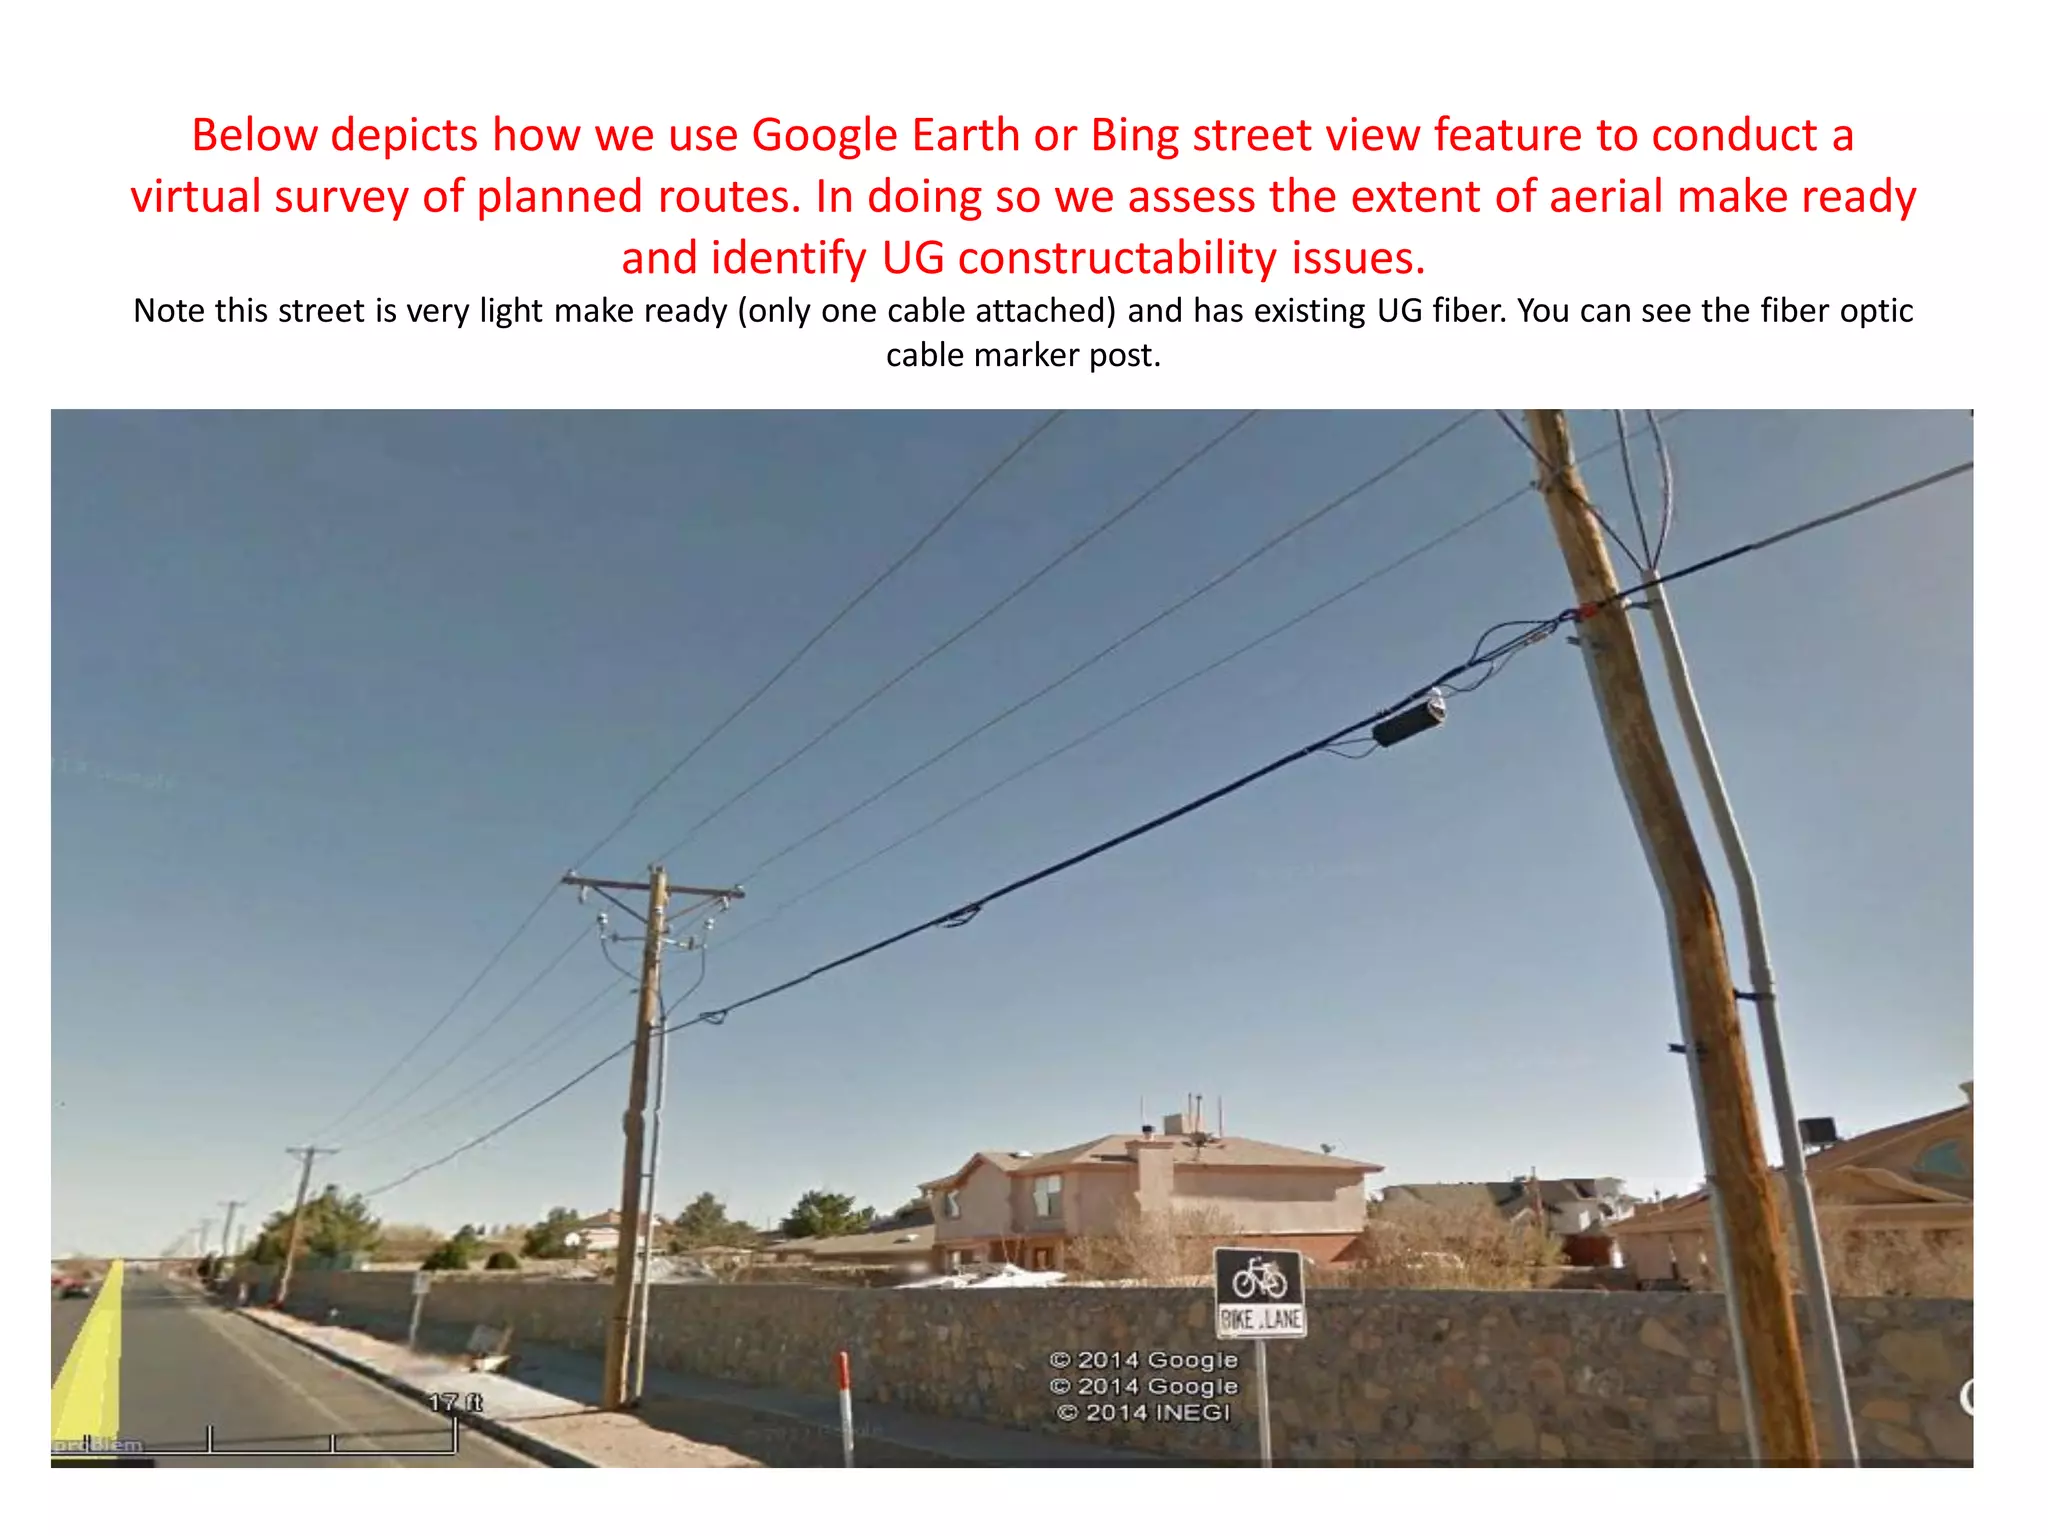
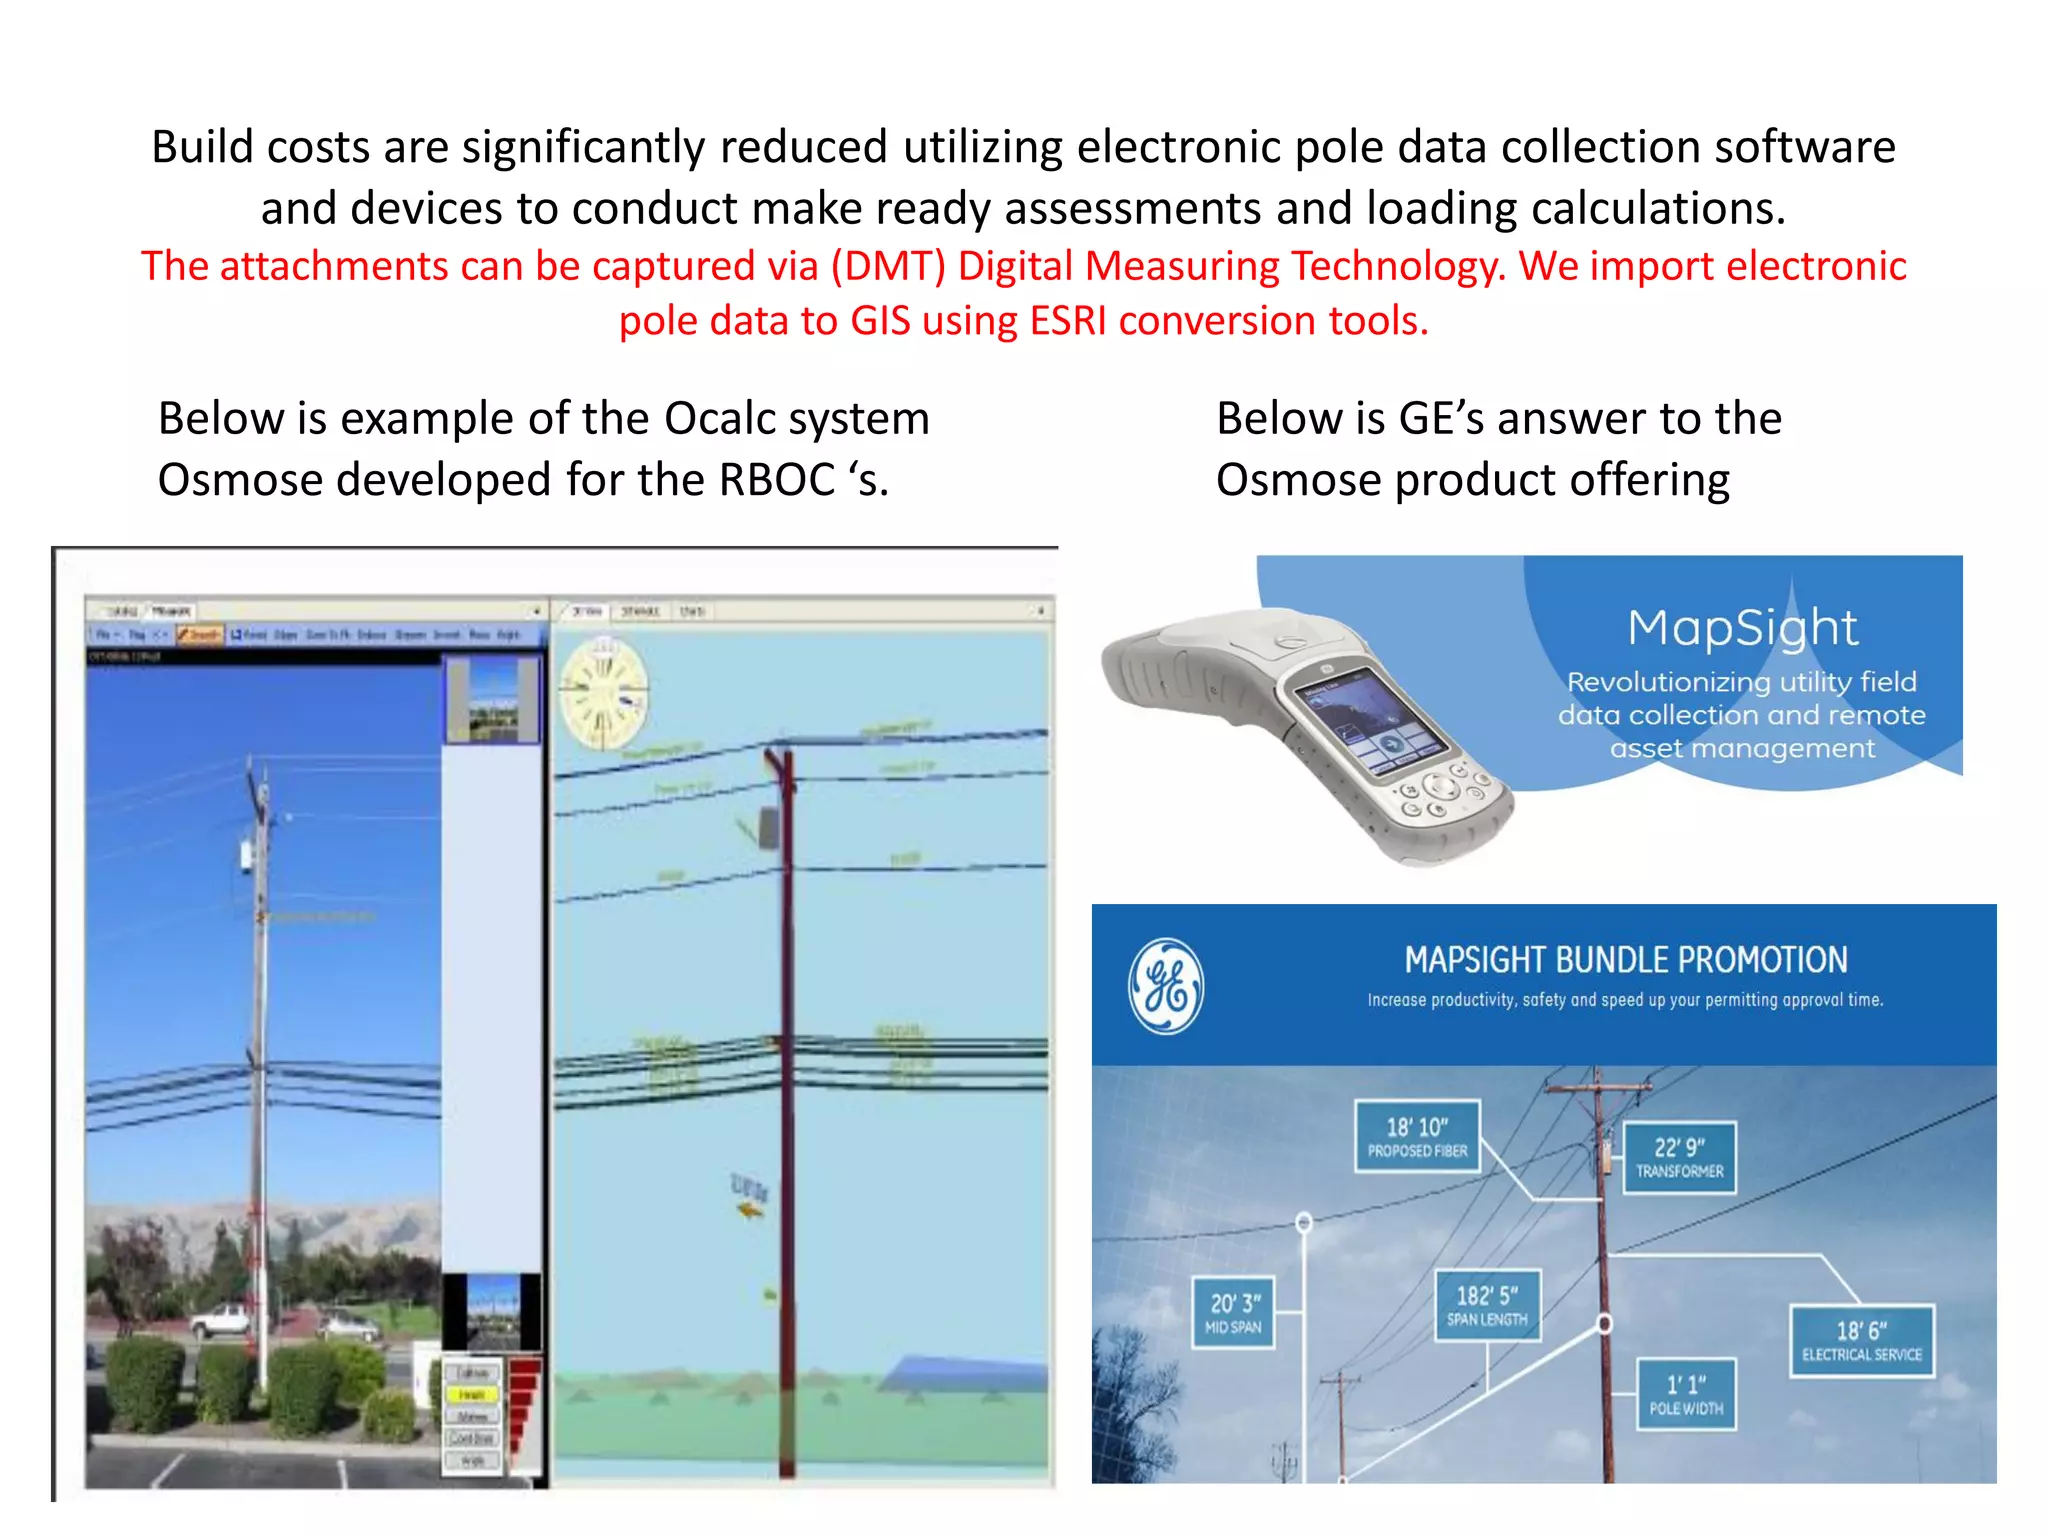
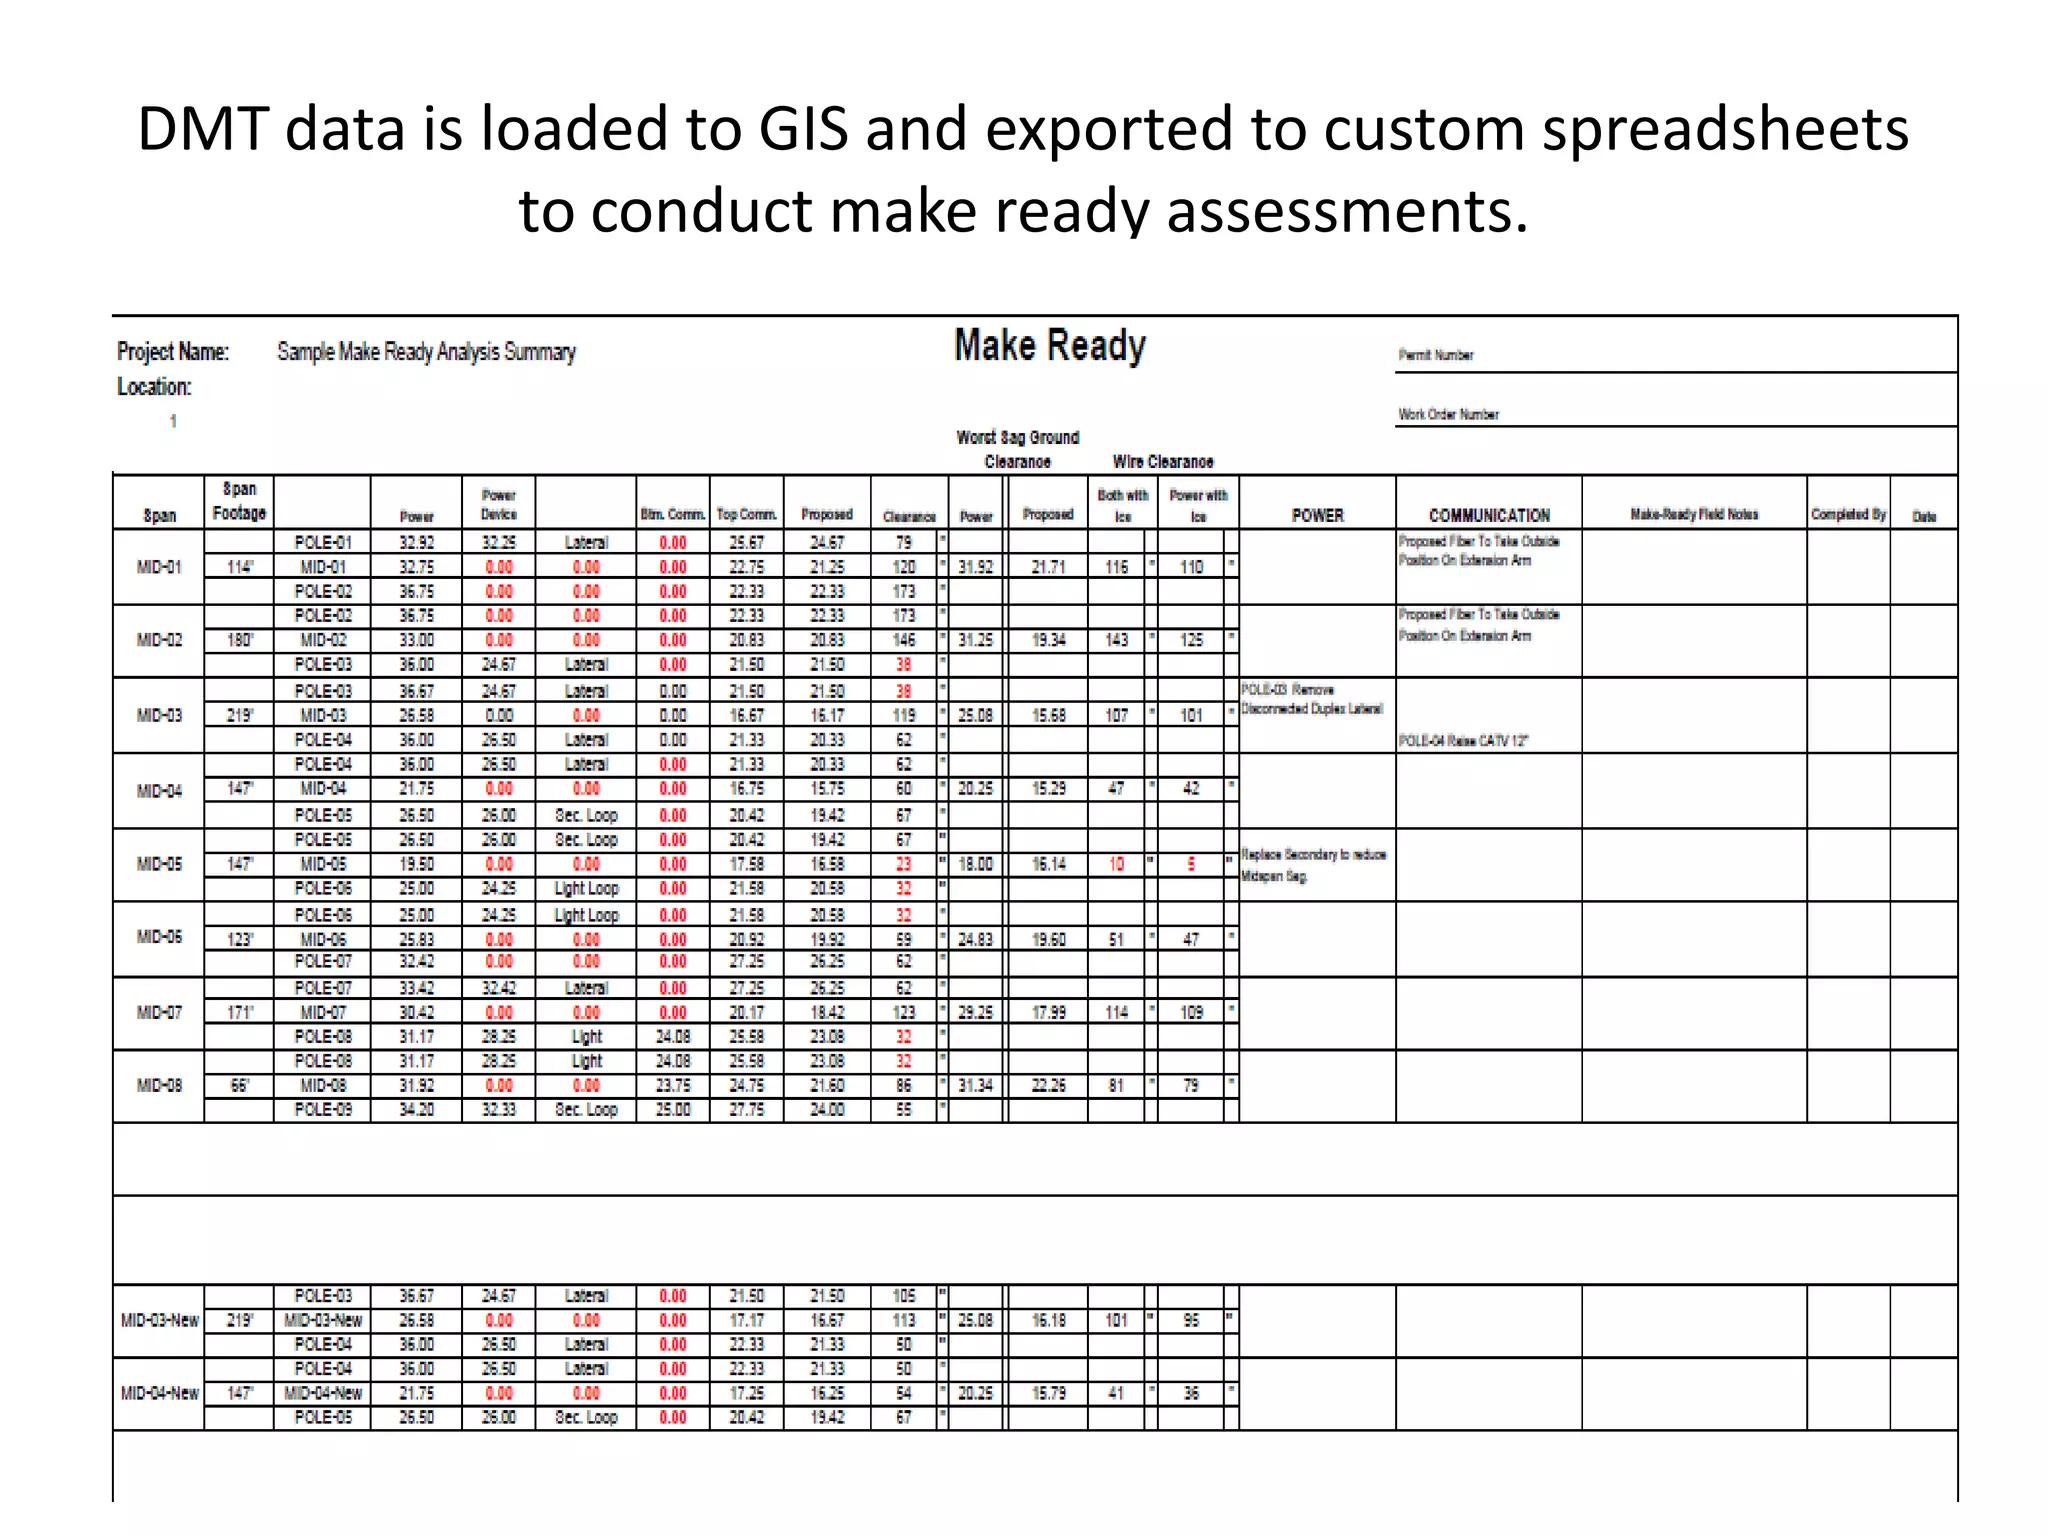
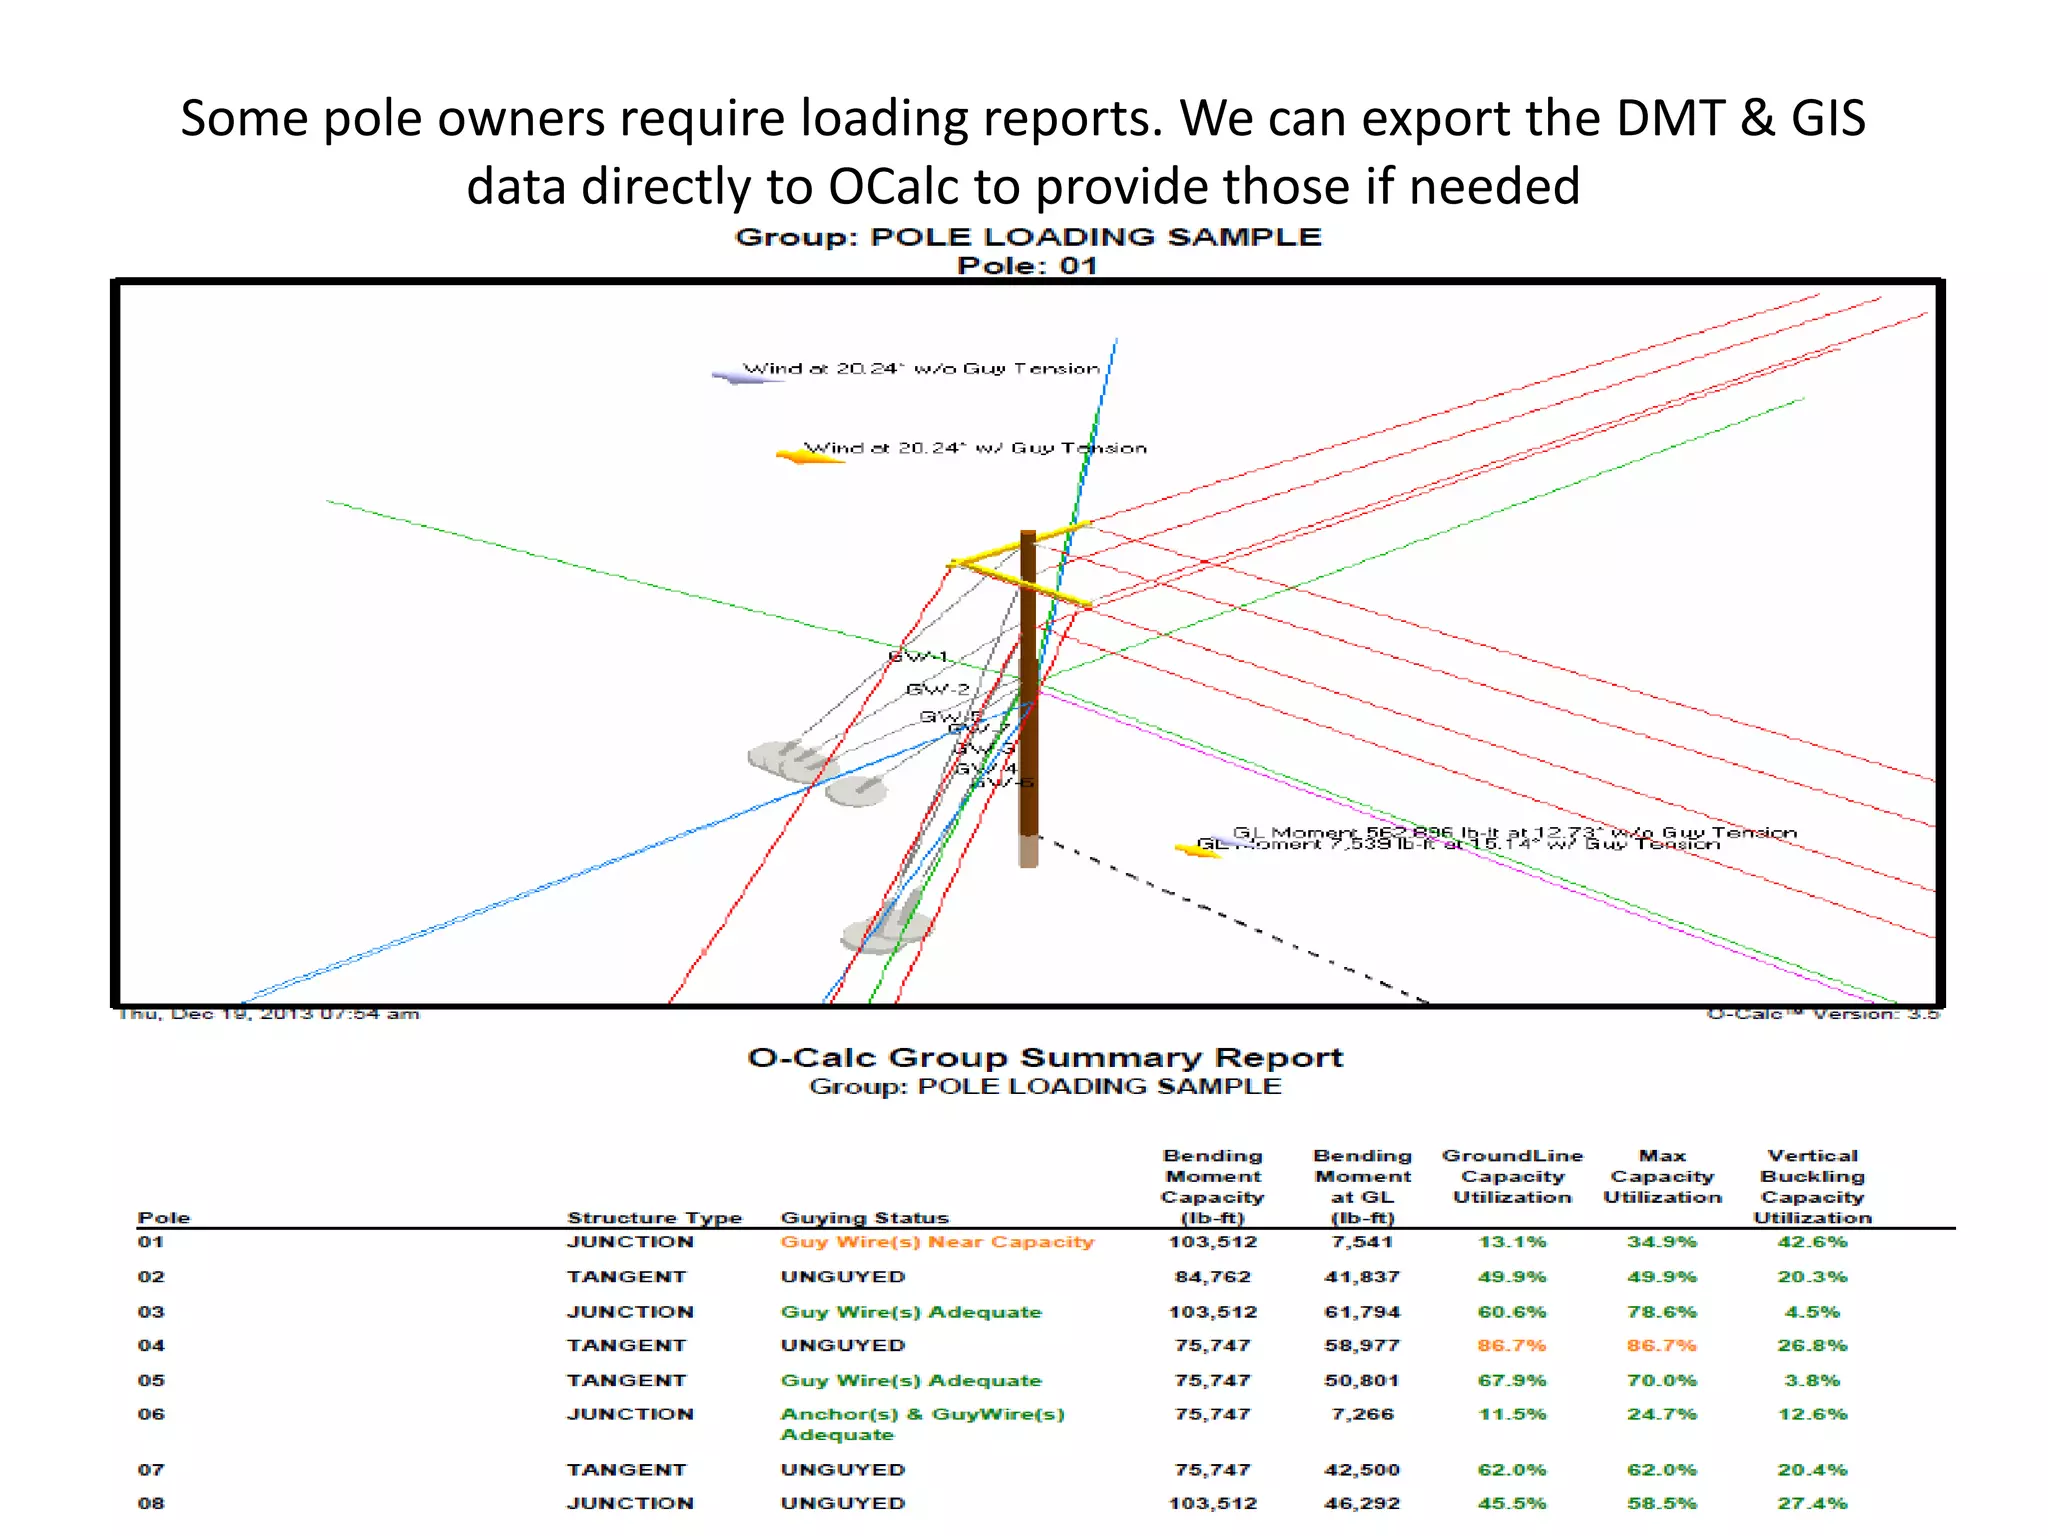
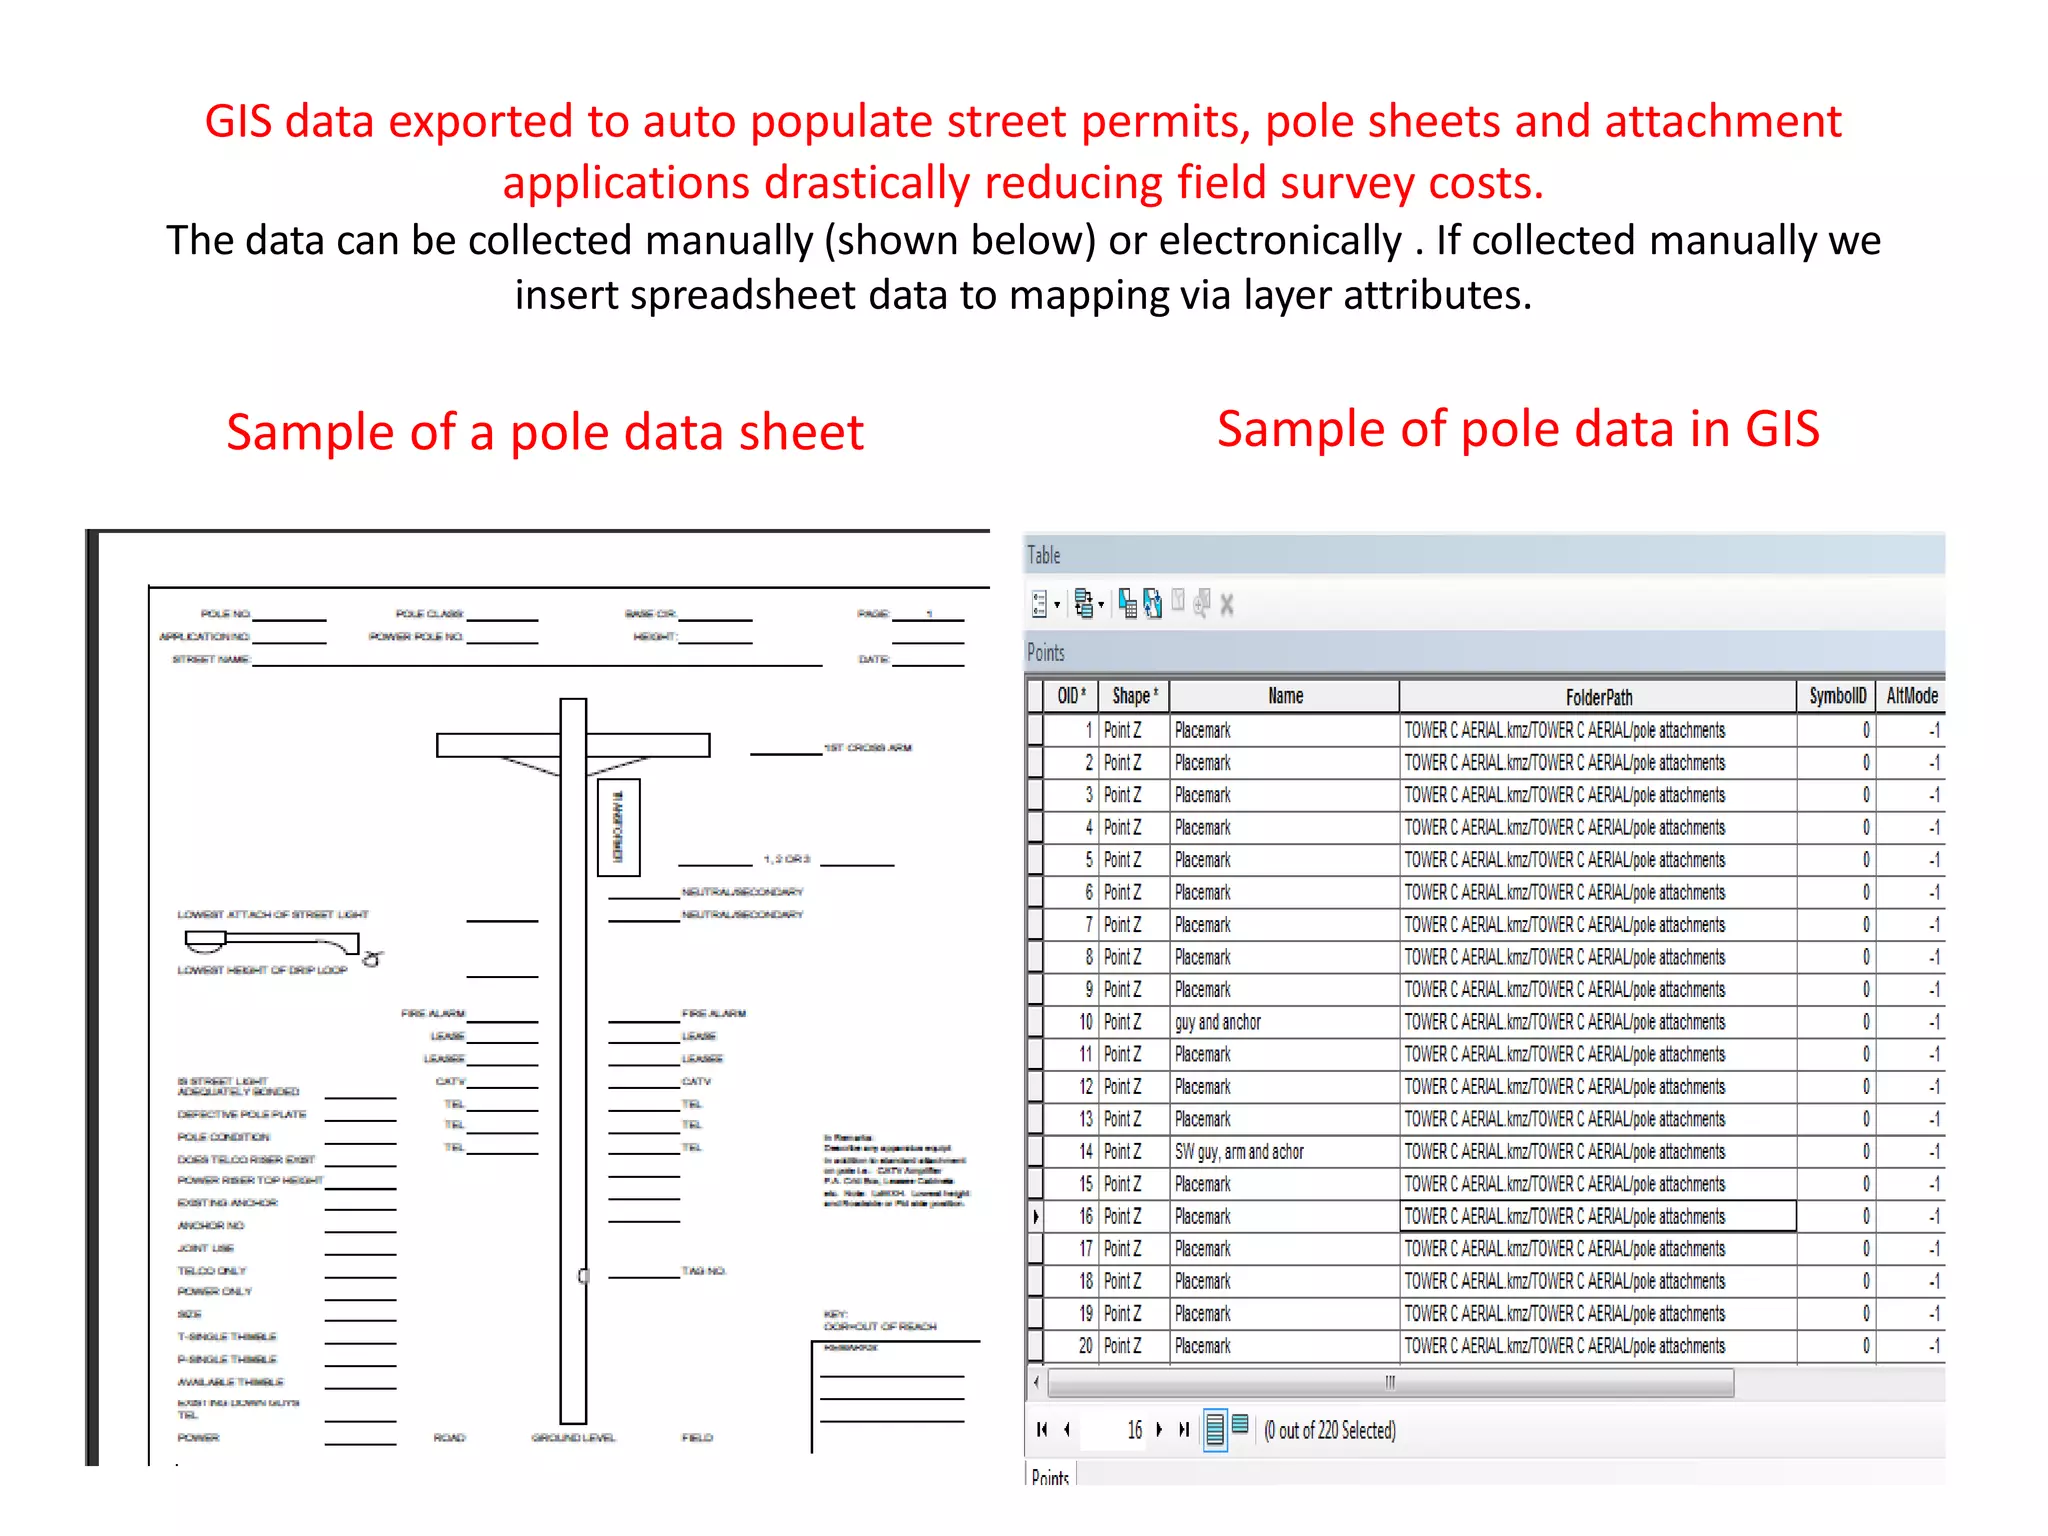
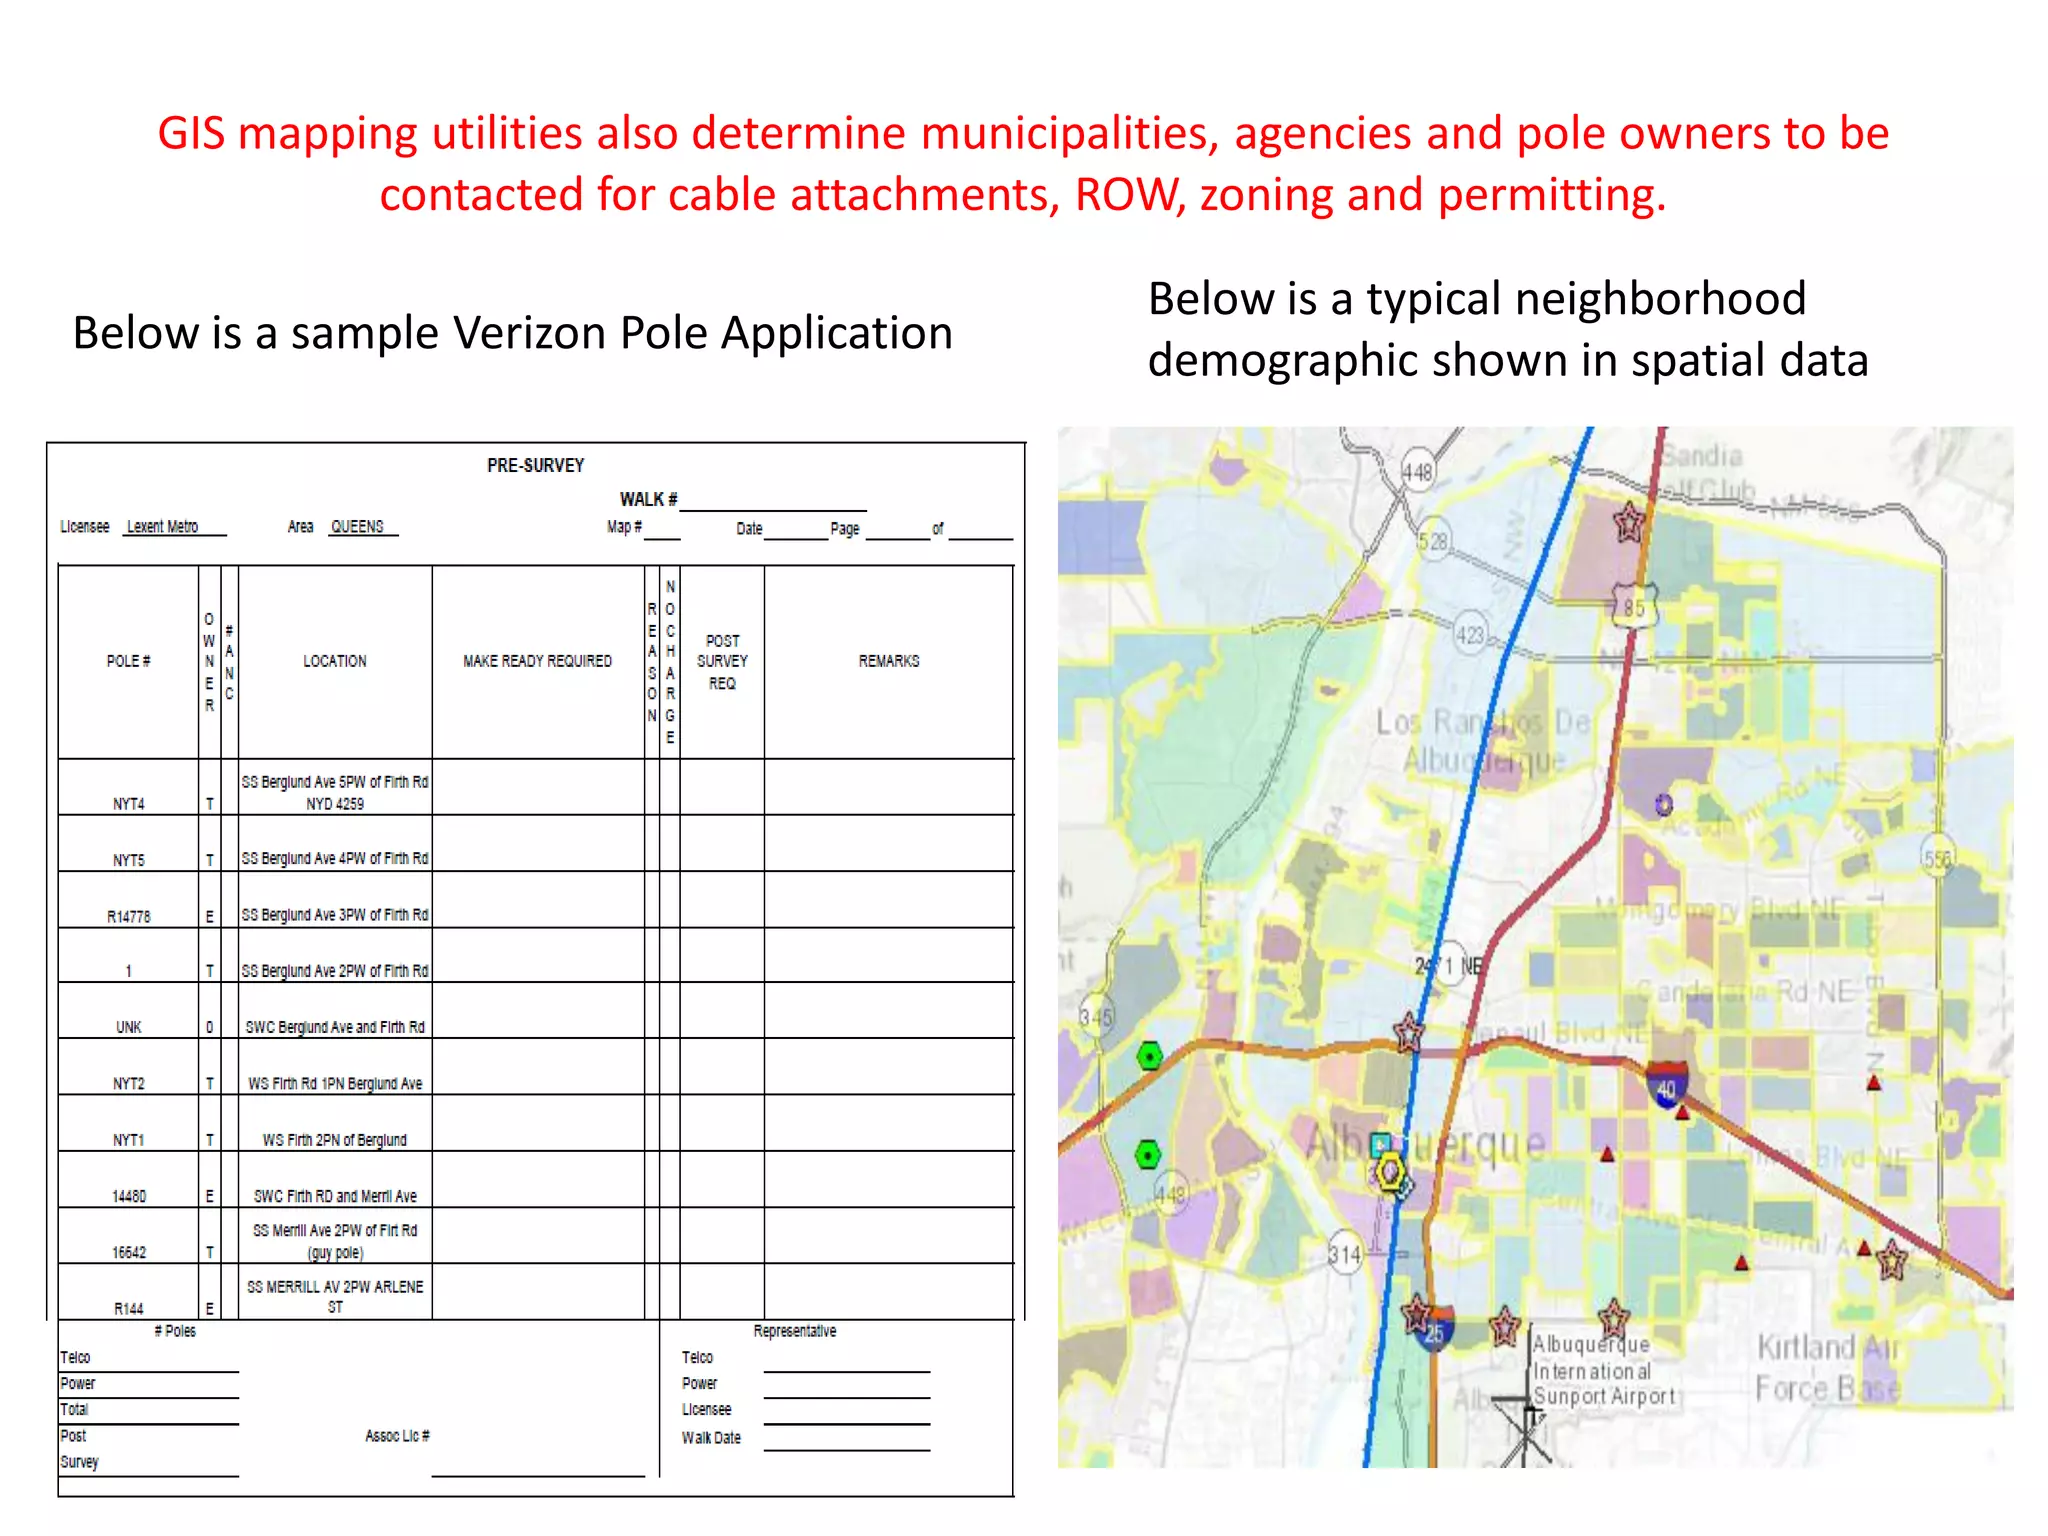
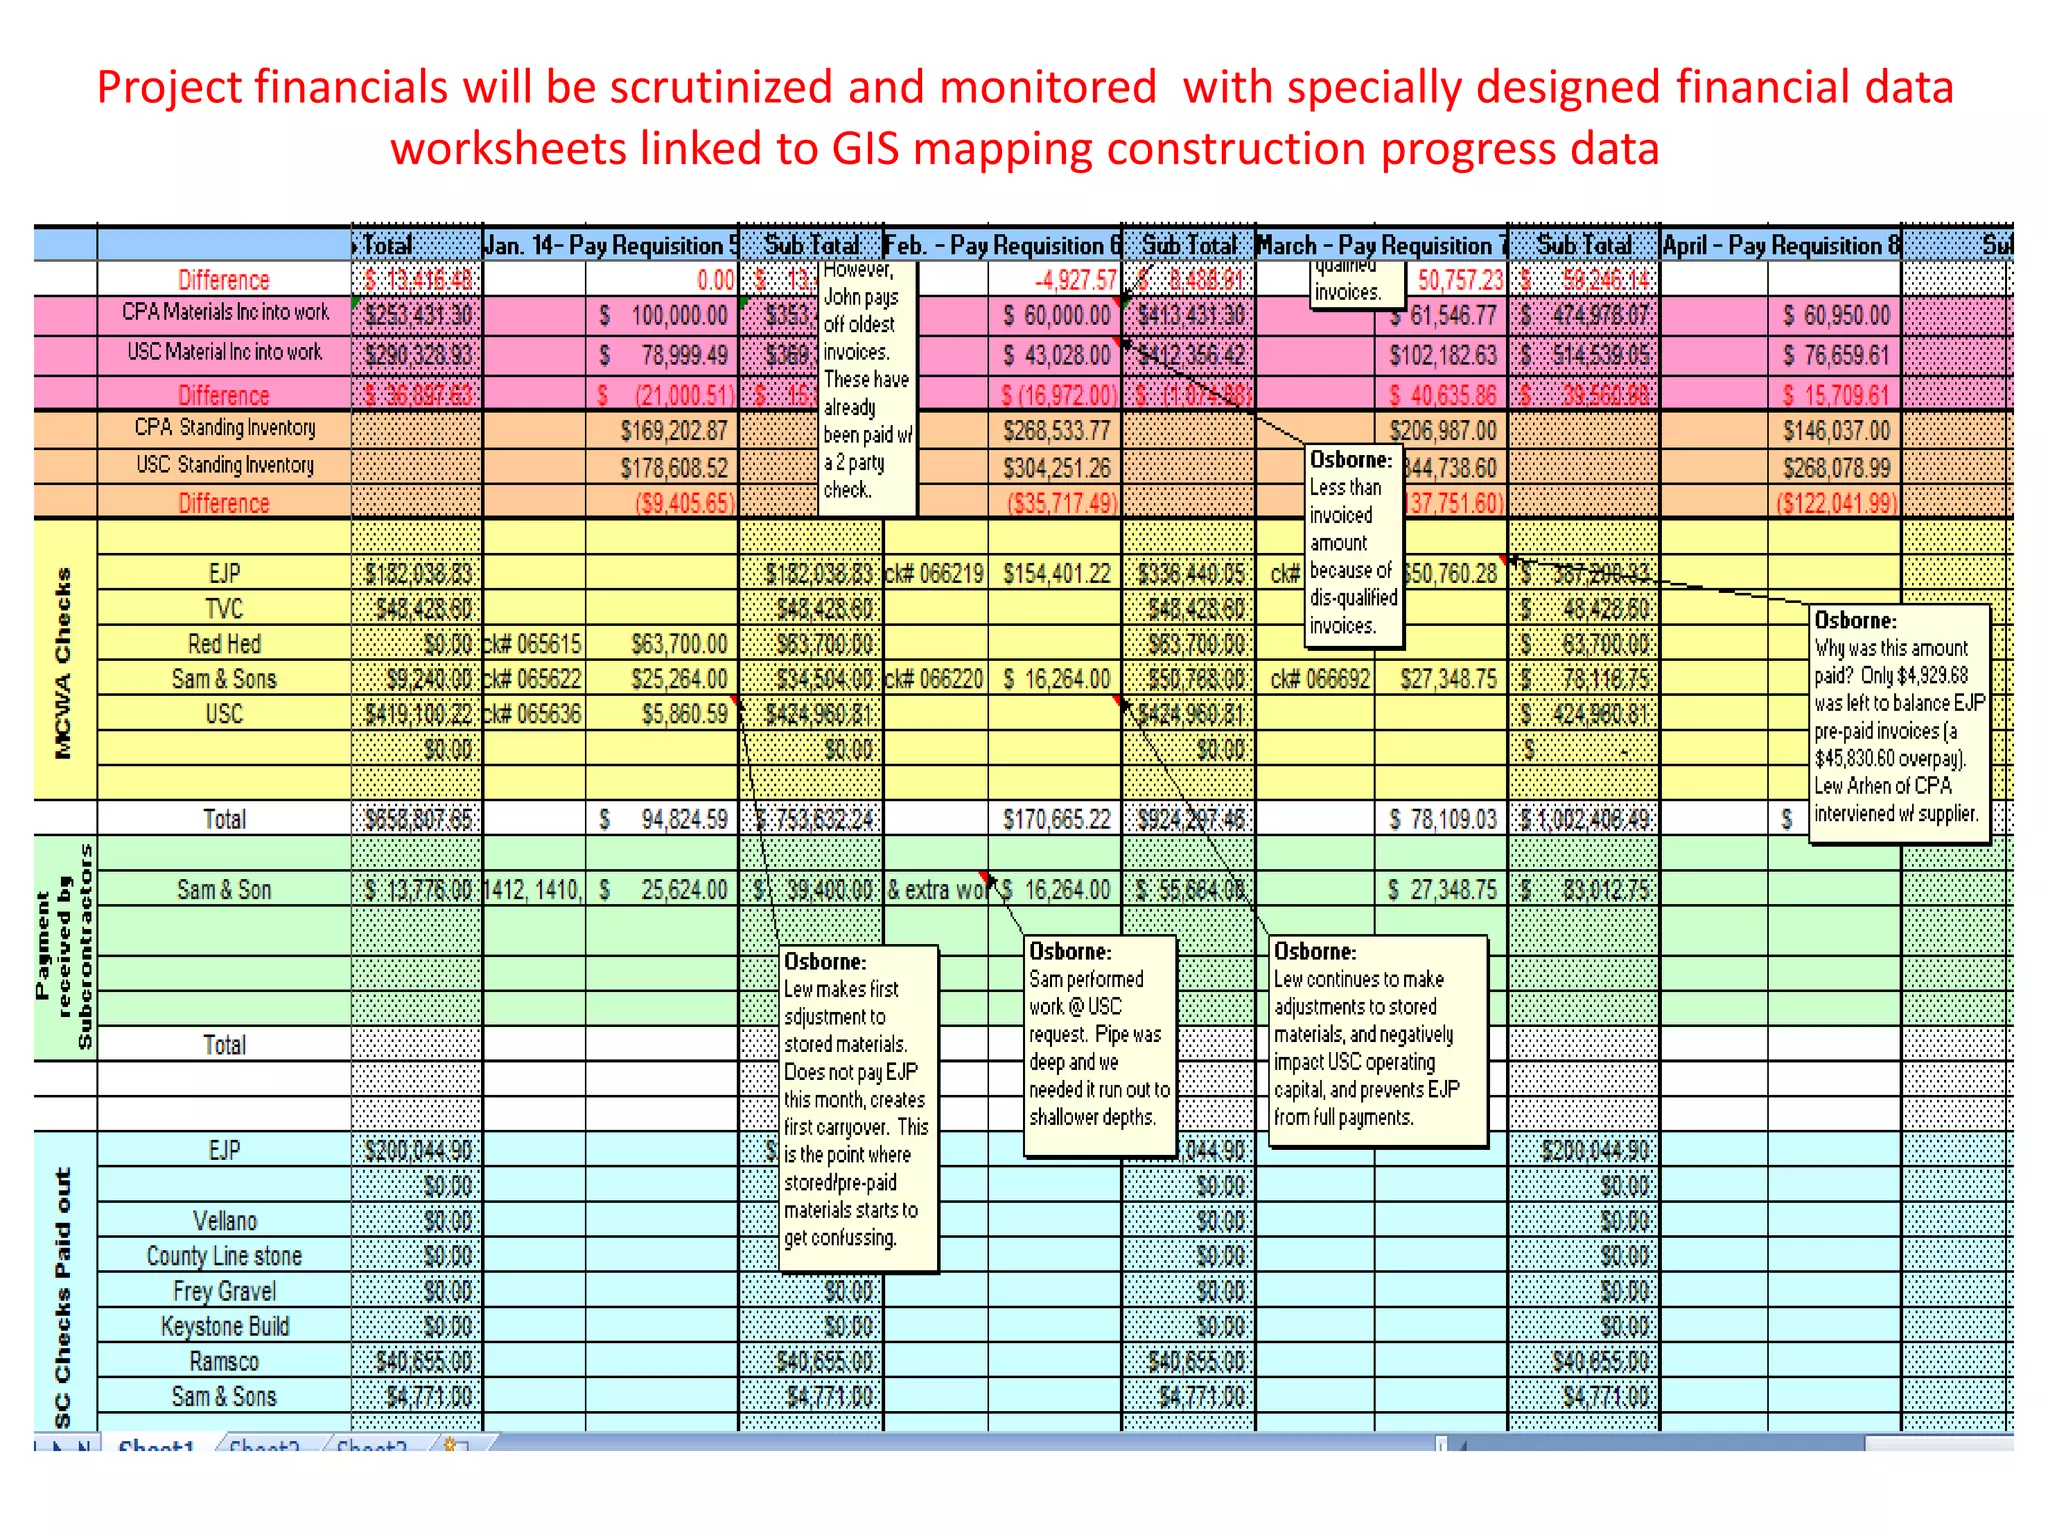
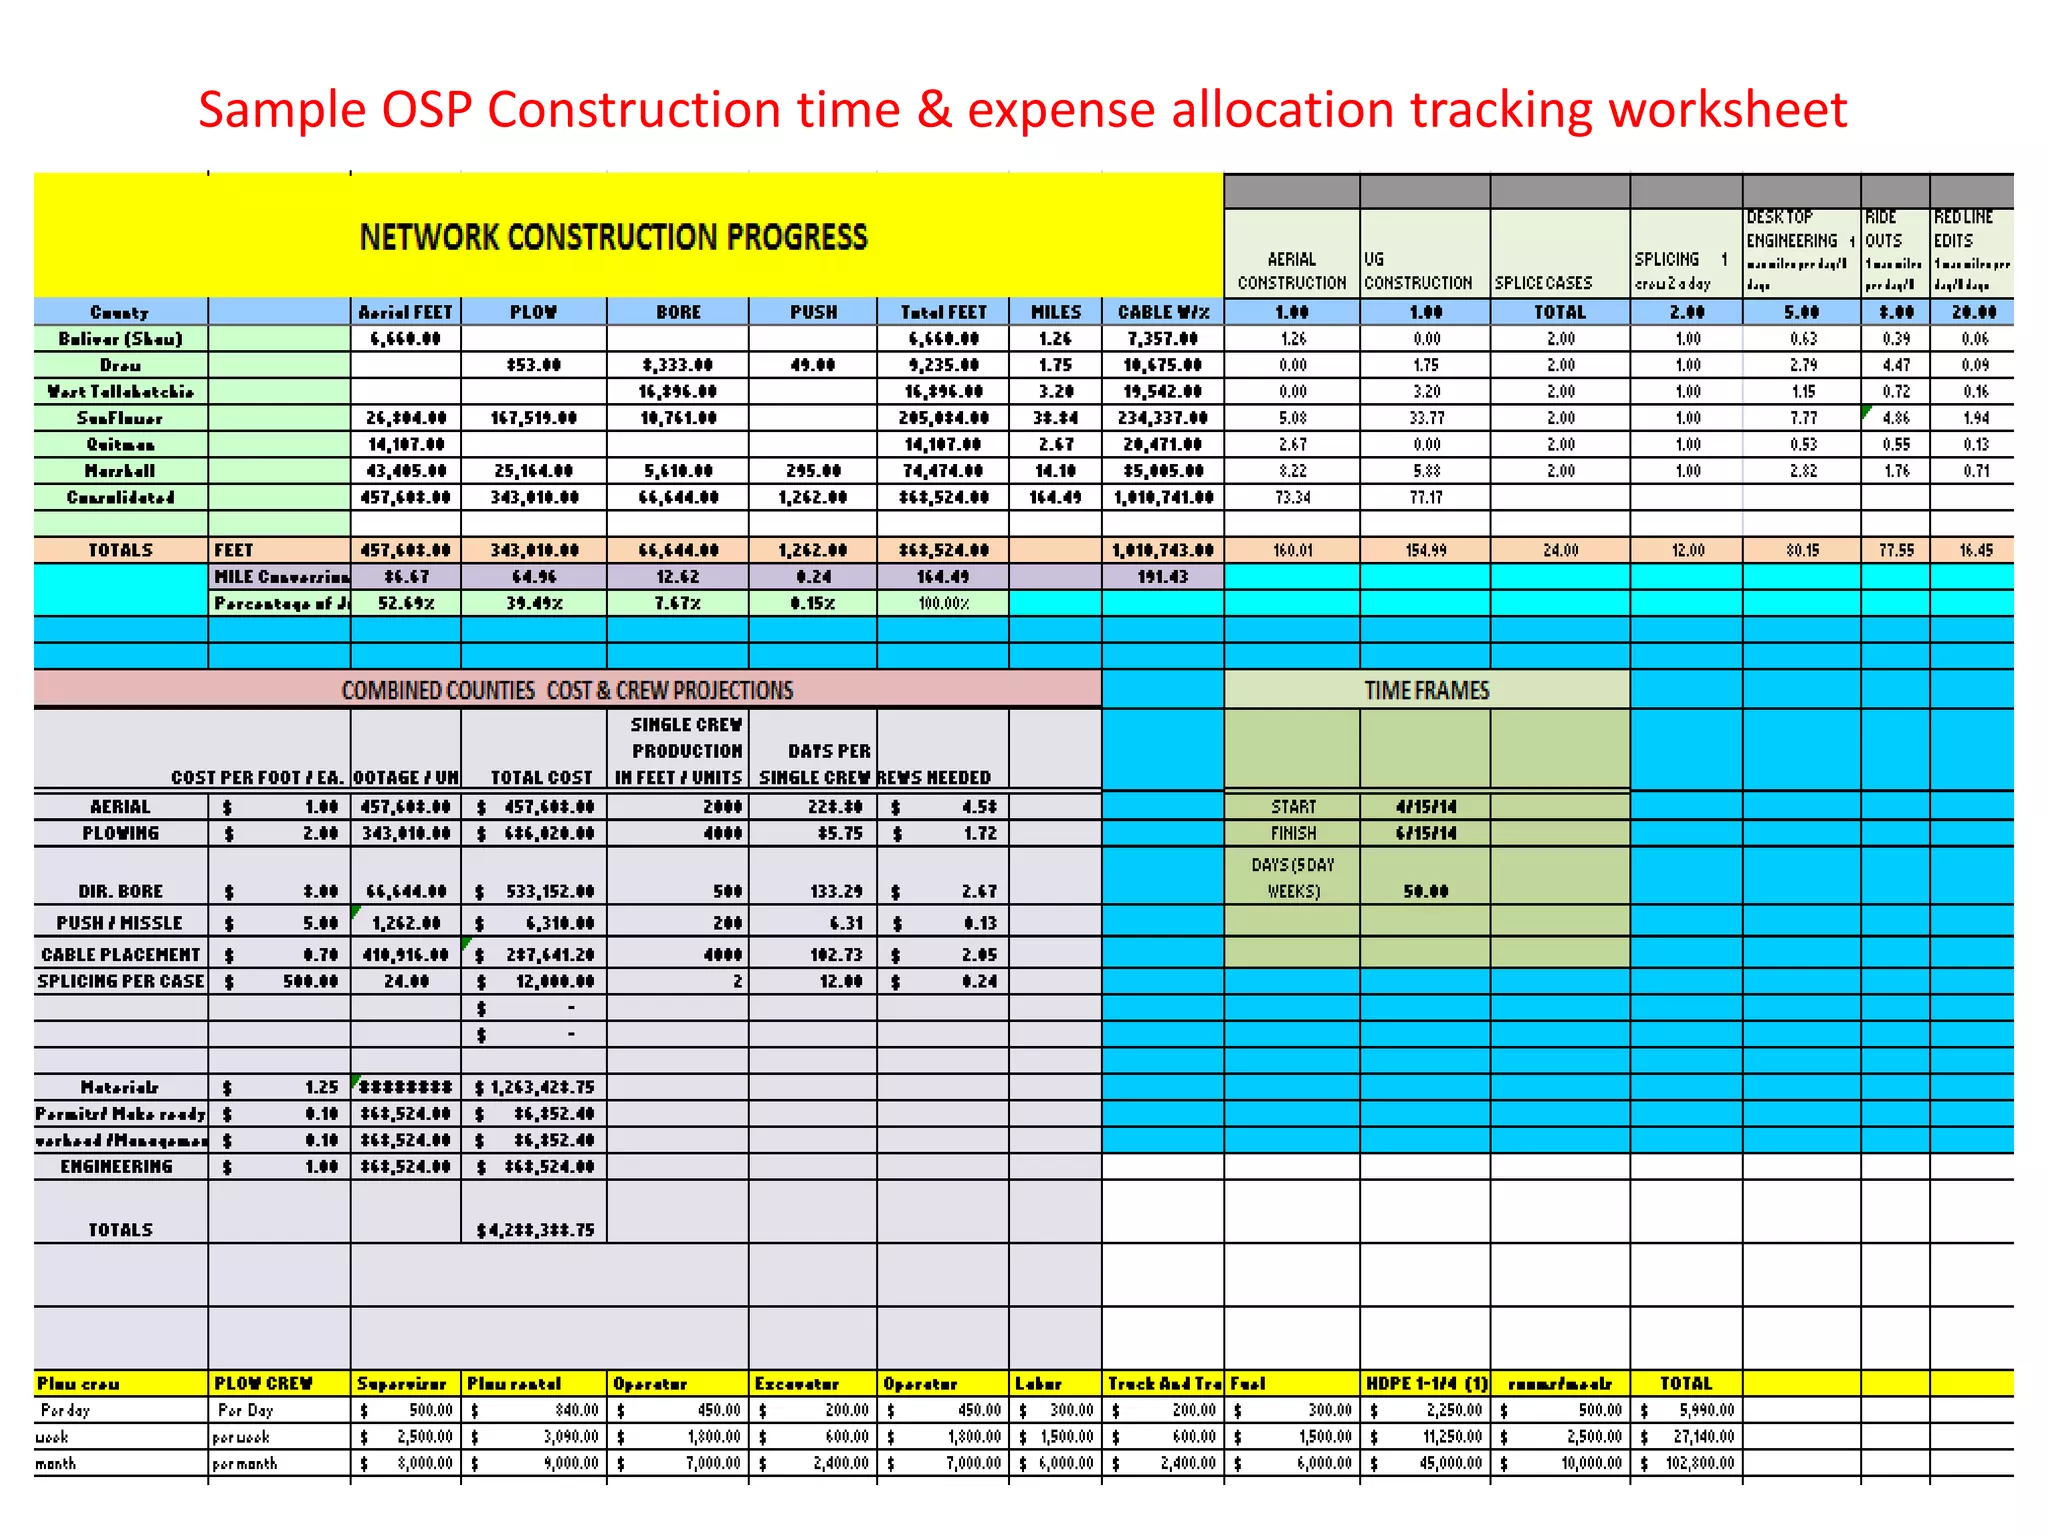
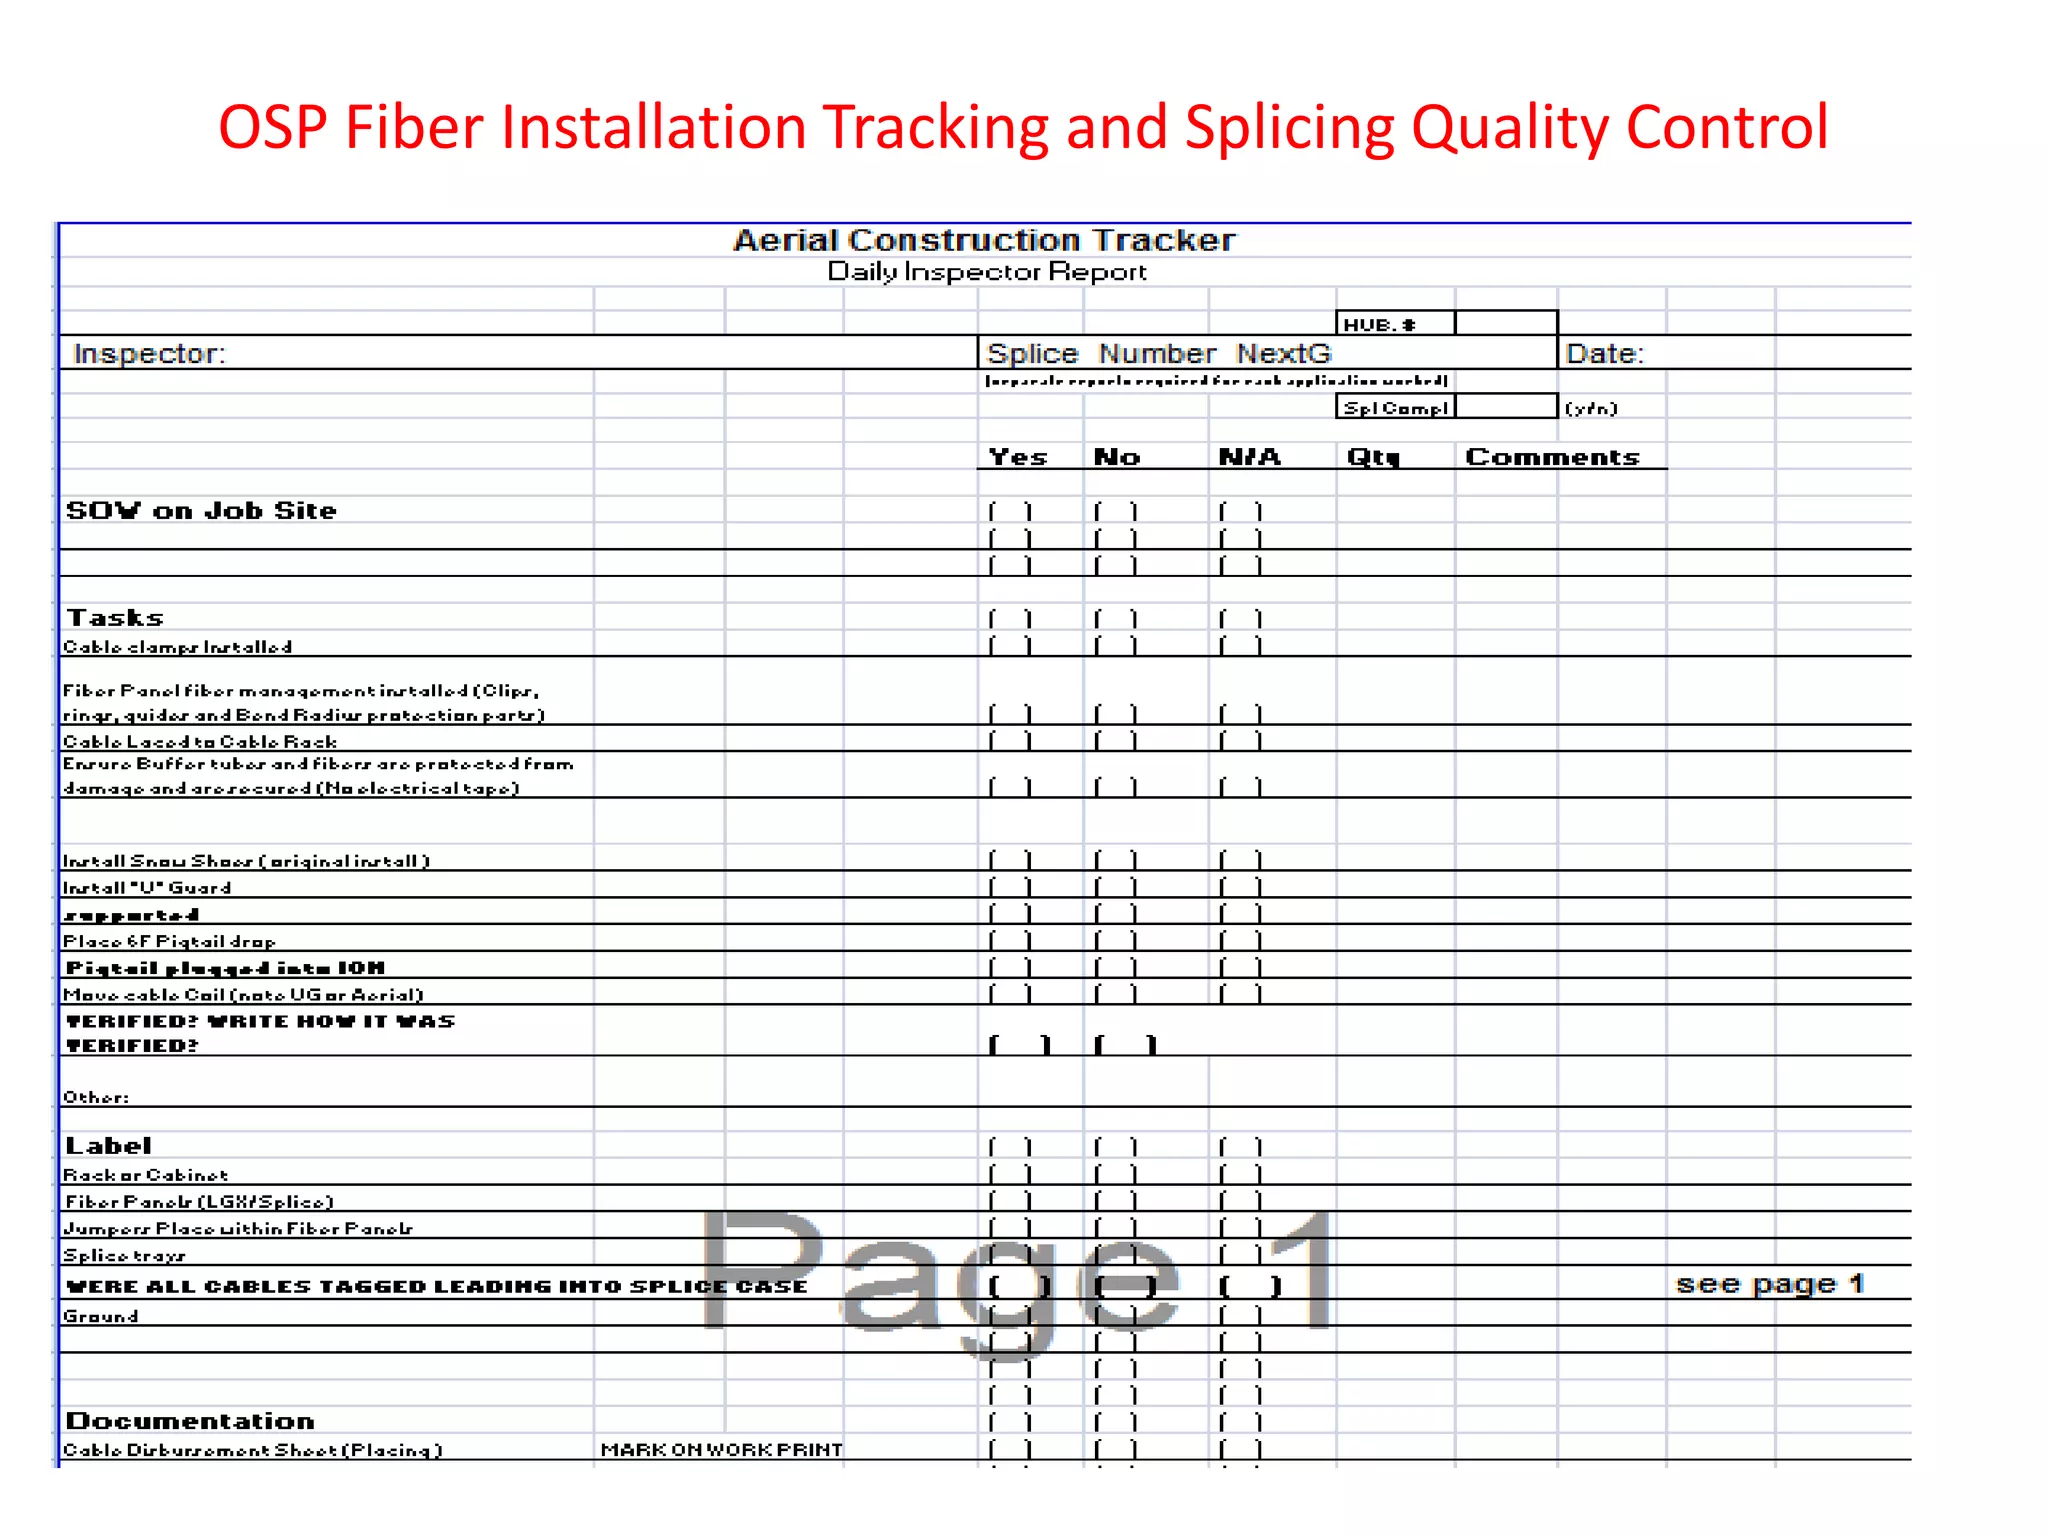
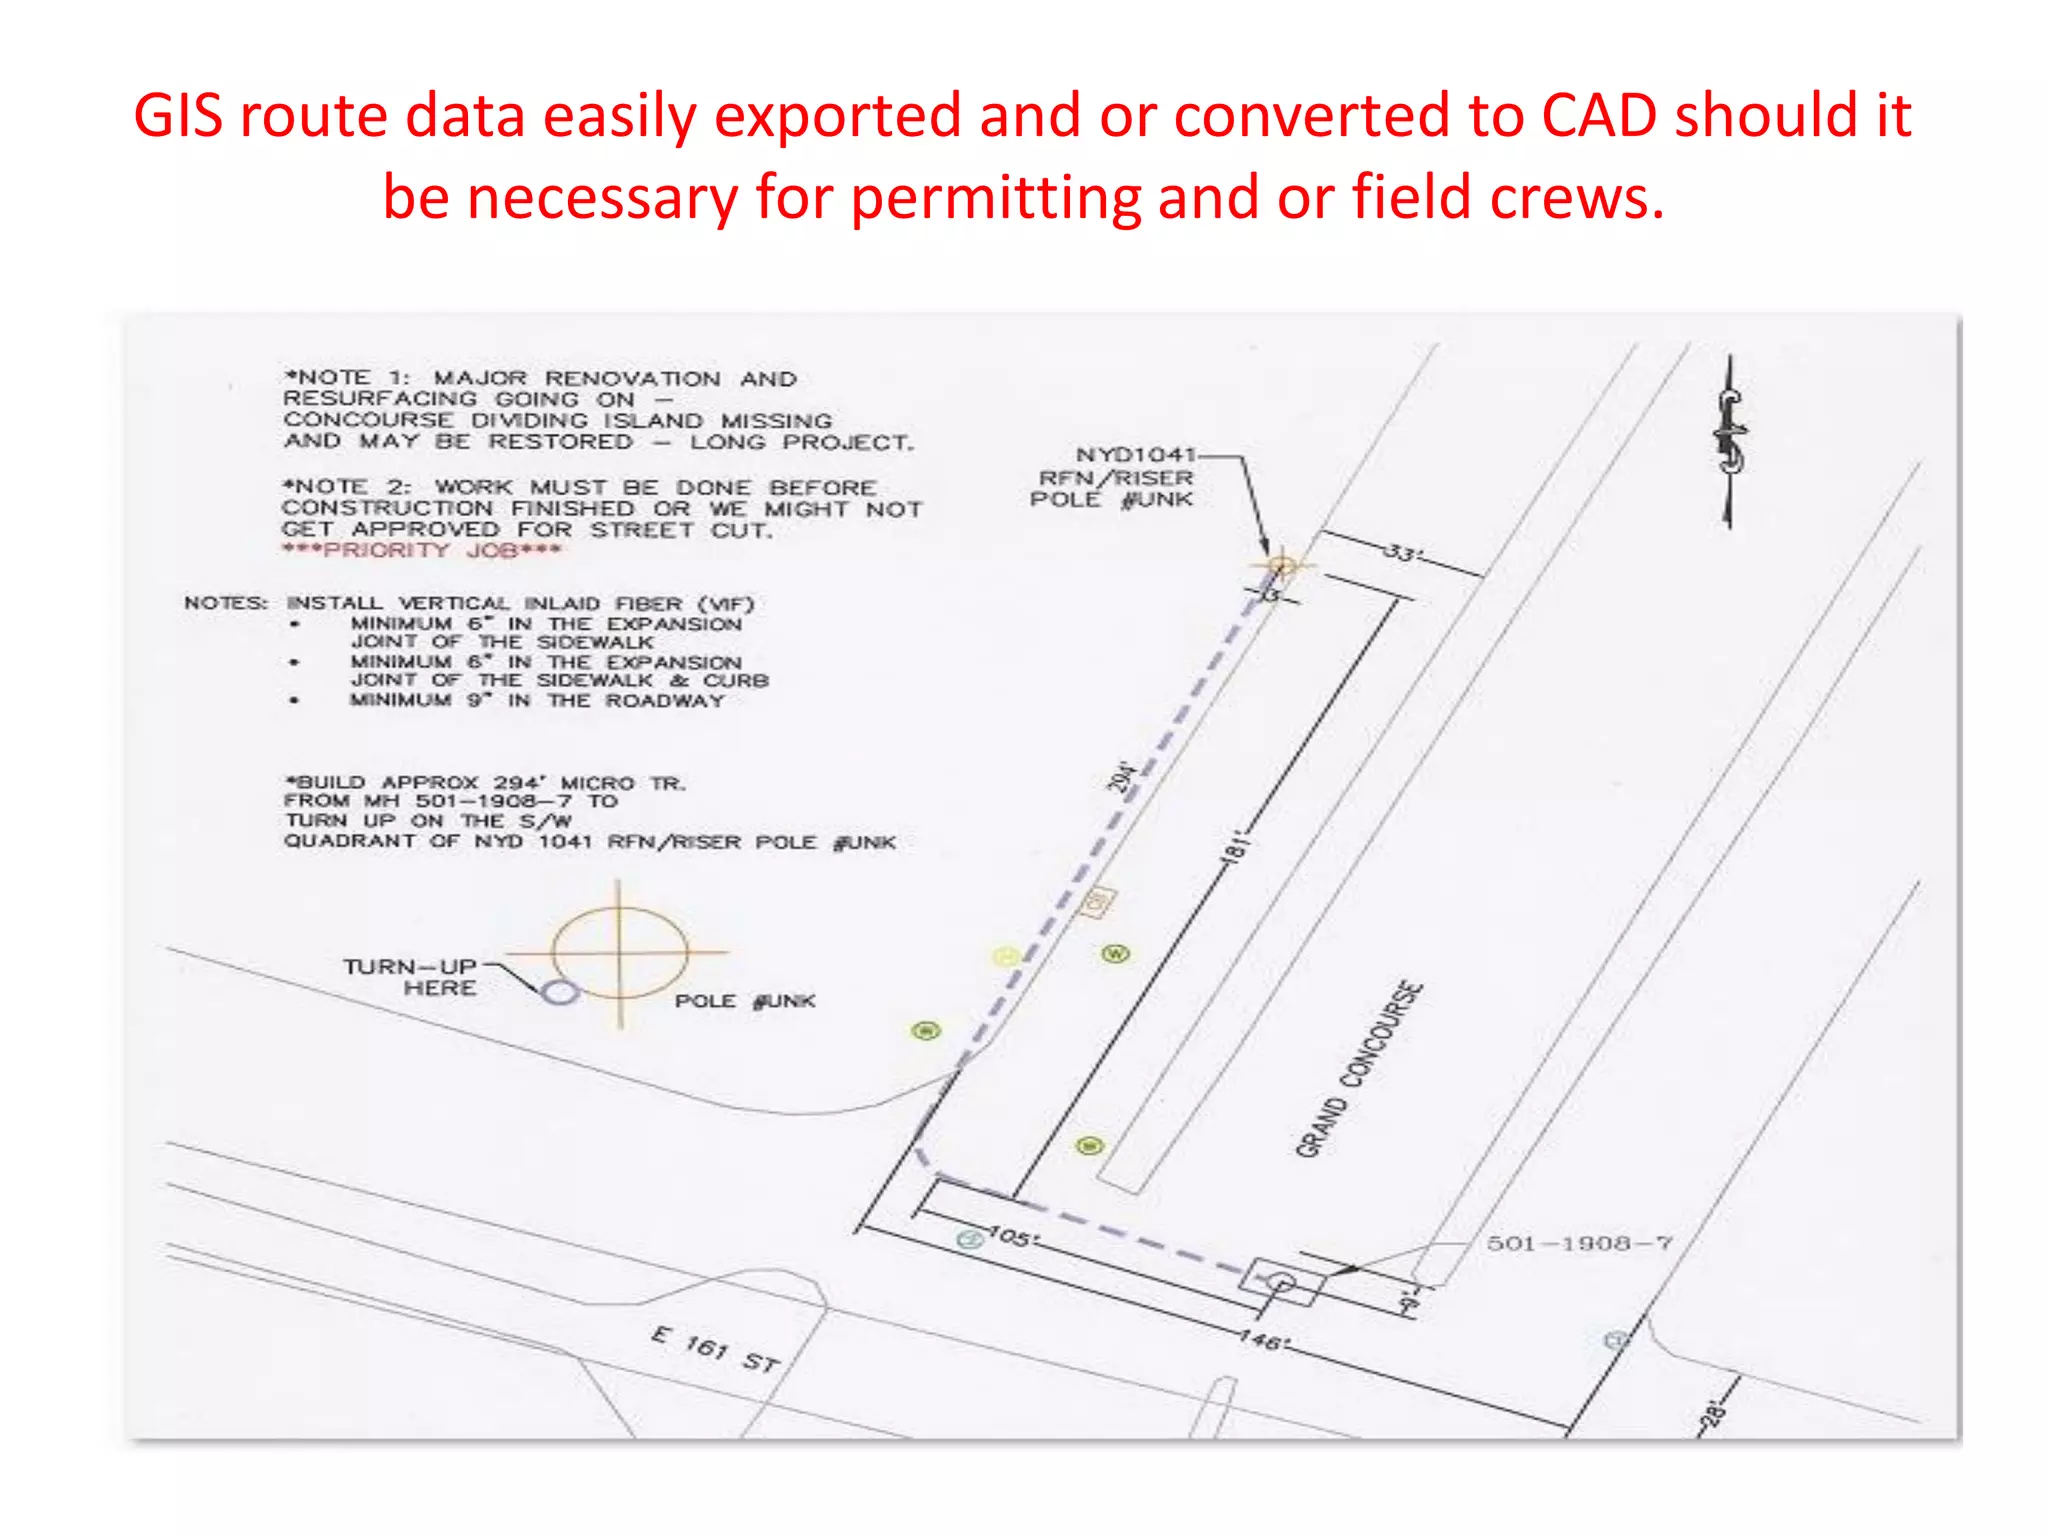
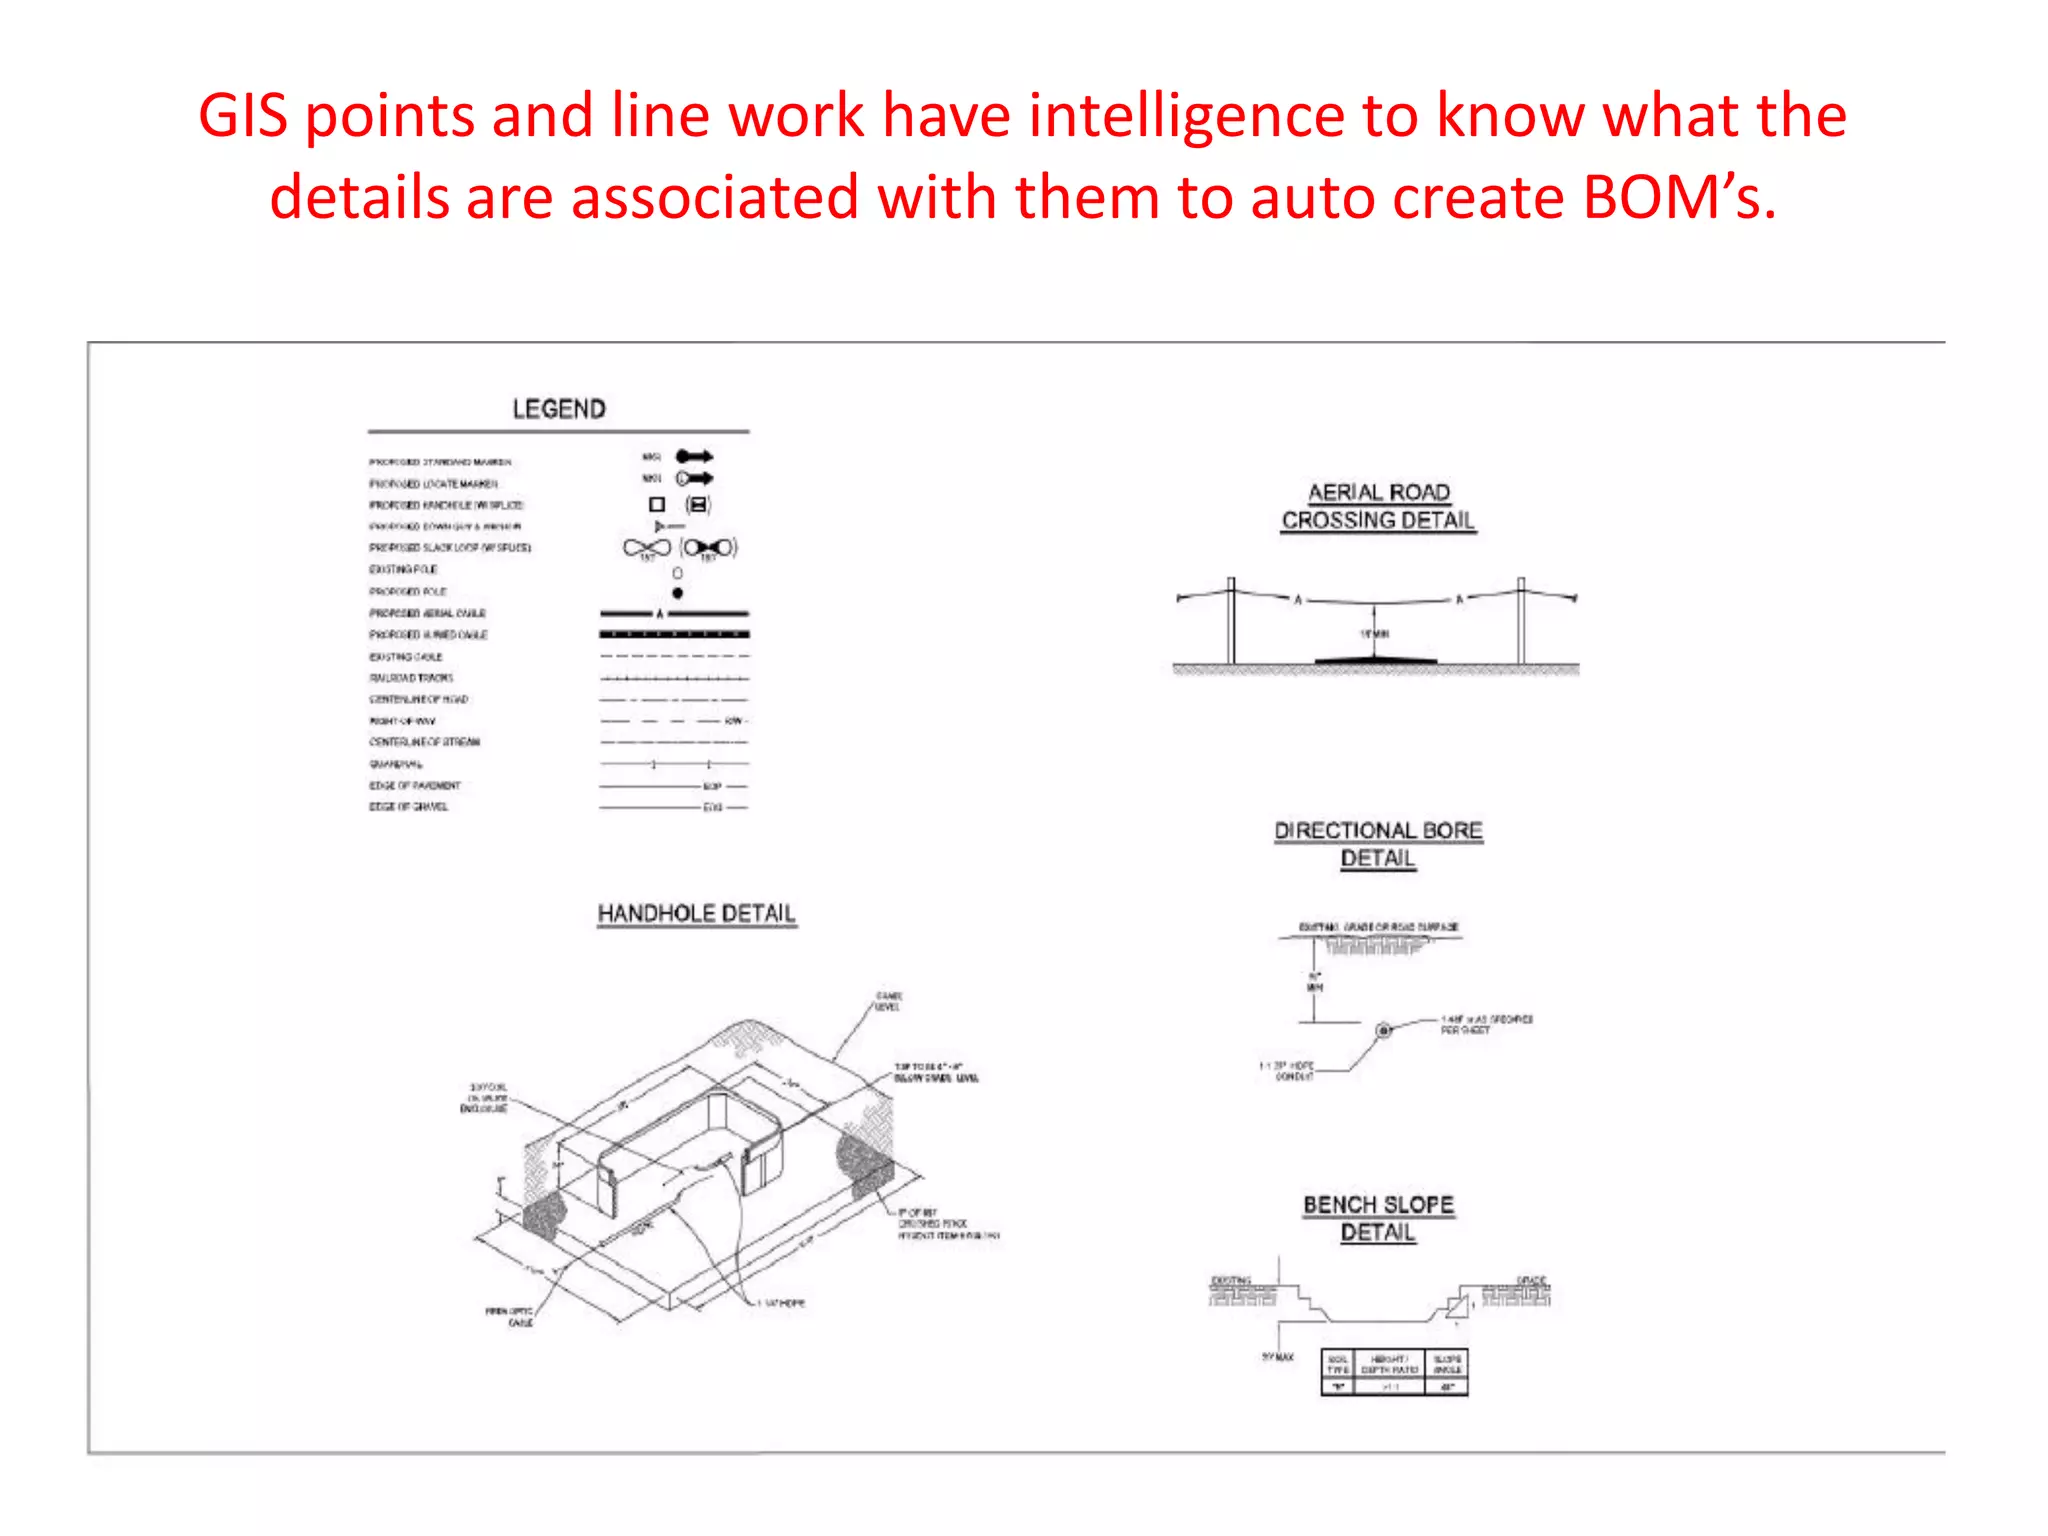
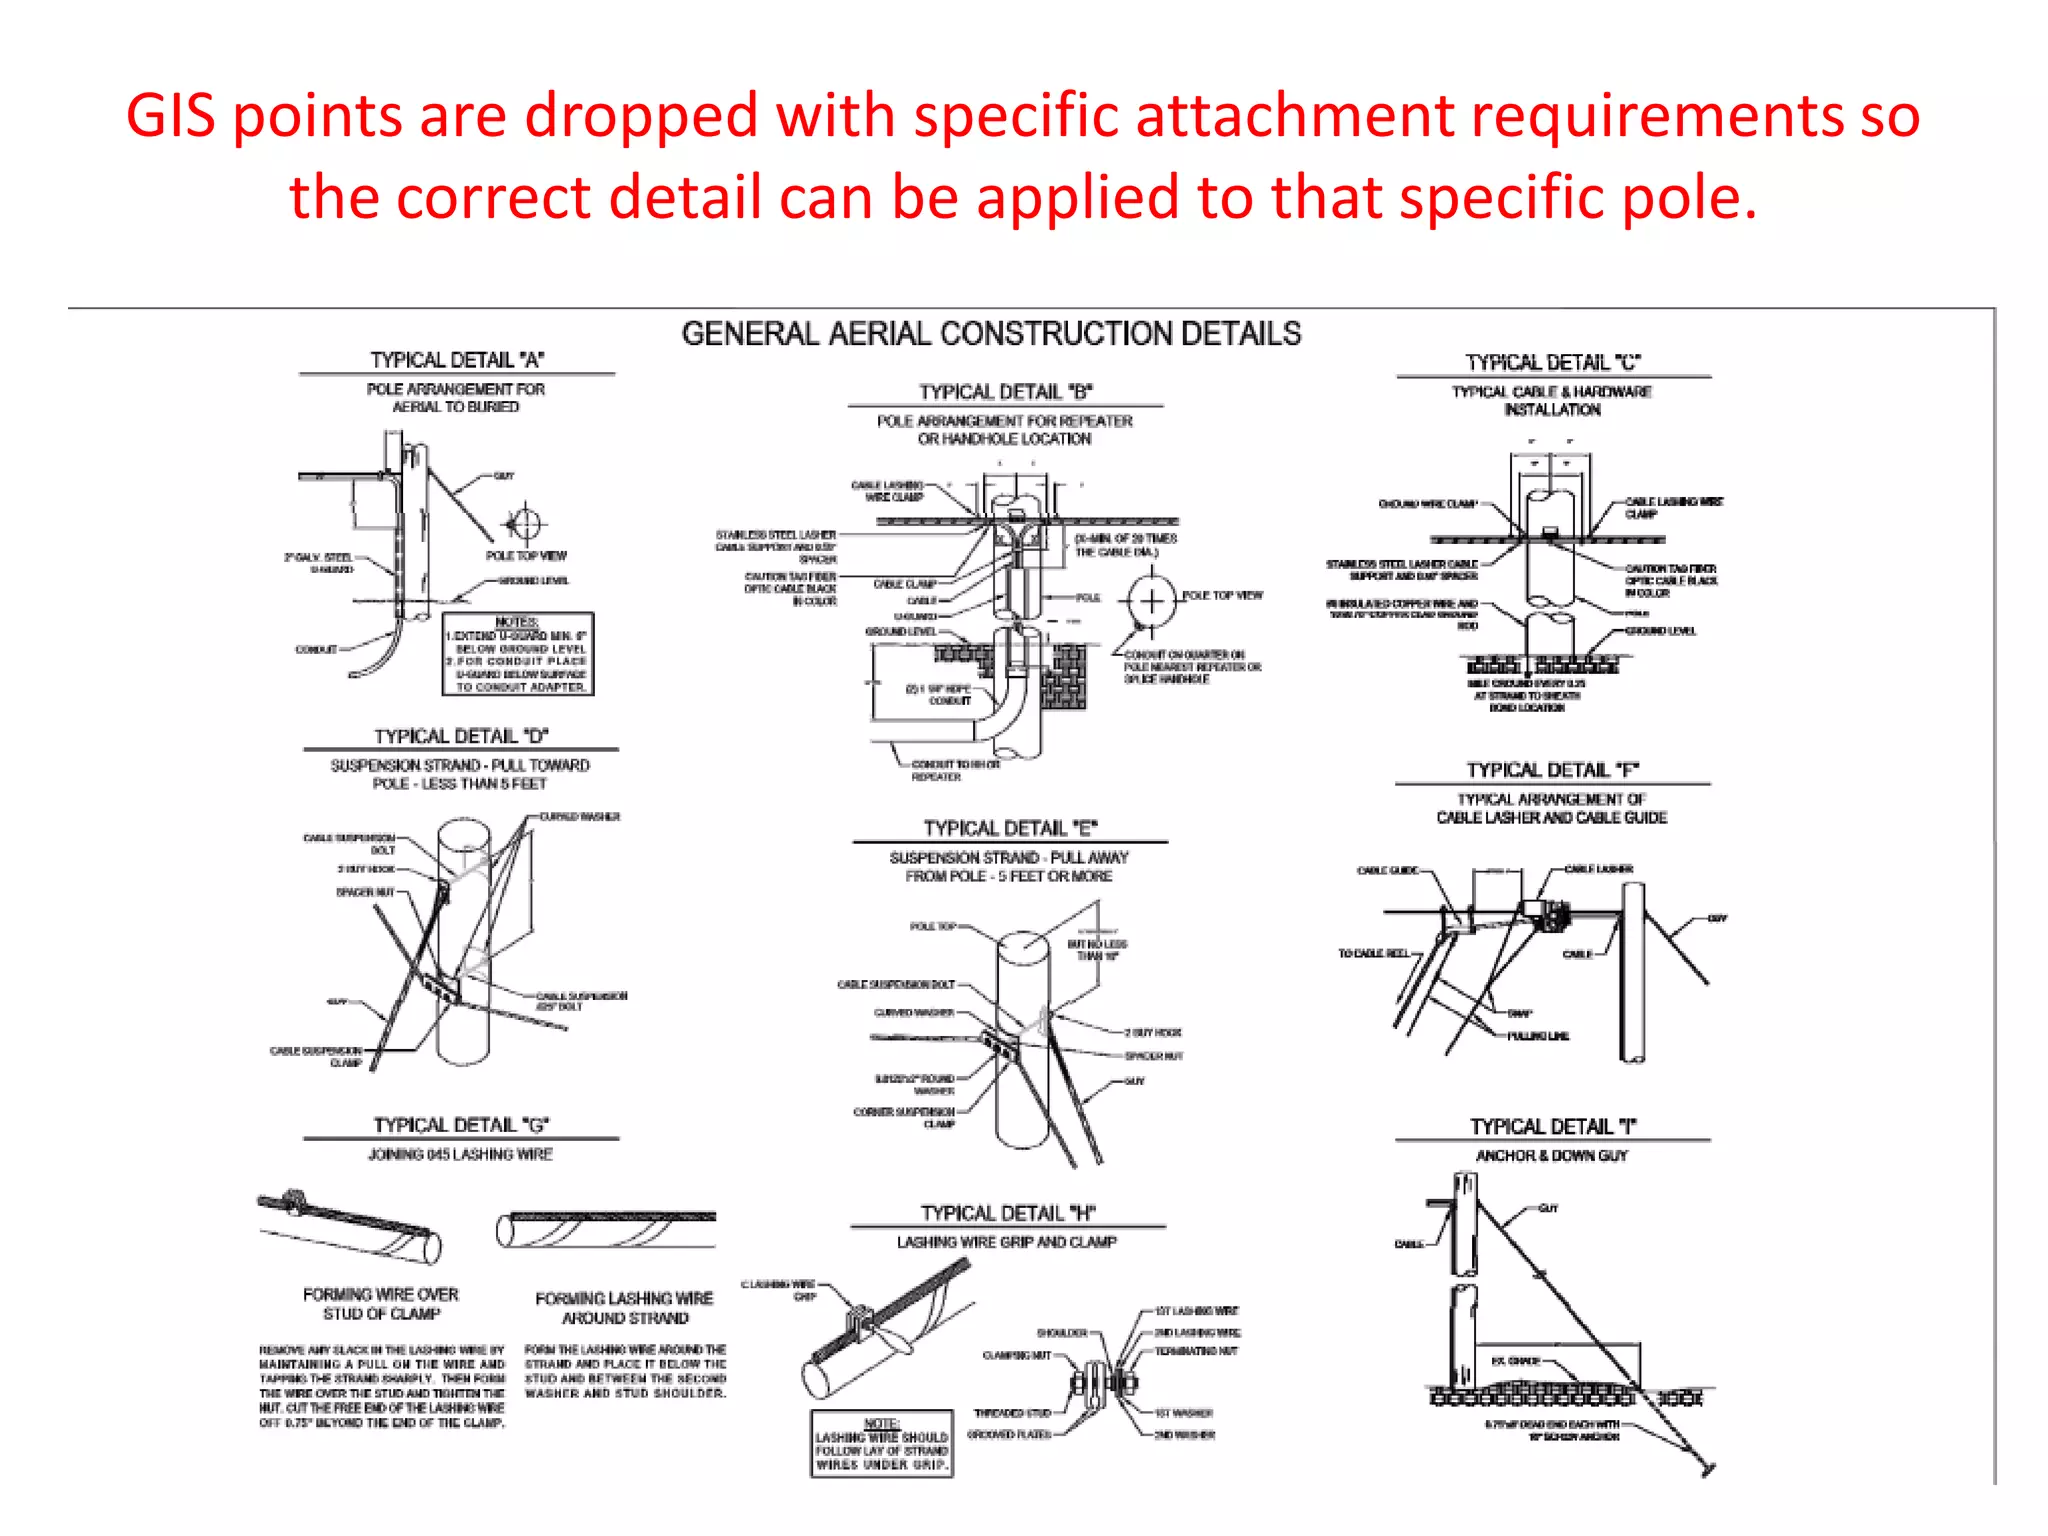

Using GIS mapping software to design fiber optic networks provides significant efficiencies over traditional design methods. GIS allows teams to: 1. Assess routes for aerial vs. underground construction using embedded raster images instead of driving routes. 2. Create preliminary route drawings and field sheets in a few clicks instead of weeks of CAD work. 3. Collect pole data and construction details electronically in the field using GIS instead of paper, speeding data collection and design updates. 4. Auto-generate permits, applications, and construction drawings from collected field data for faster project completion.


![Number_Guessing_Game_Dsbsbssbzboc[1].pptx](https://cdn.slidesharecdn.com/ss_thumbnails/numberguessinggamedoc1-251206215042-a076fc05-thumbnail.jpg?width=640&height=640&fit=bounds)


