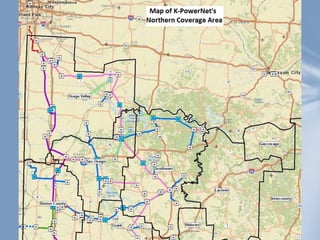
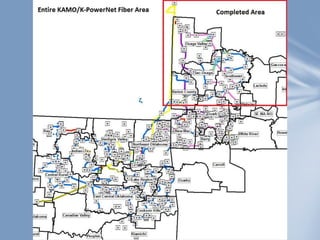
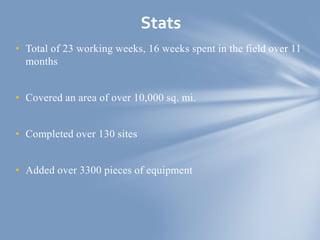
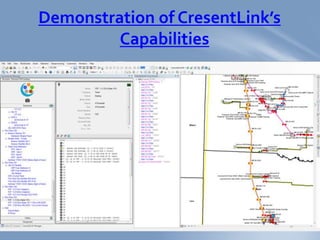
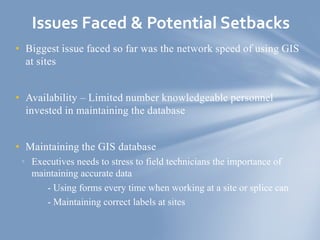
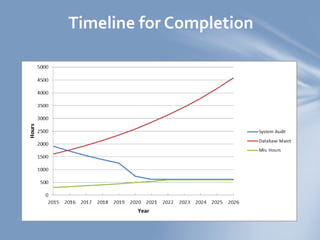
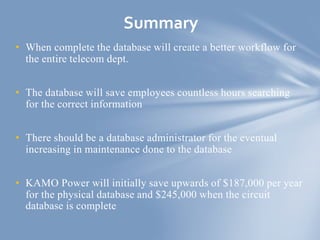
El Dorado Springs Area
Audit of K-PowerNet’s
Fiber Optic Network
By Scott Kusselson
Project Manager
6/9/2015
• Introduction
• Coverage Area Maps
• Stats
• Demonstration of CresentLink’s Capabilities
• A look at Peculiar POP
• Benefits of a GIS Database
• Issues Faced
• Cost Analysis
• Timeline for Completion
• Summary
Outline ofTopics
• Total of 23 working weeks, 16 weeks spent in the field over 11
months
• Covered an area of over 10,000 sq. mi.
• Completed over 130 sites
• Added over 3300 pieces of equipment
Stats
Demonstration of CresentLink’s
Capabilities
• Better recordkeeping because of a centralized location of
information
• Operational and strategic benefits for the entire
telecommunications department
• Greater efficiency in time spent researching information
• Managing information geographically
Benefits of a GIS Database
• Biggest issue faced so far was the network speed of using GIS
at sites
• Availability – Limited number knowledgeable personnel
invested in maintaining the database
• Maintaining the GIS database
• Executives needs to stress to field technicians the importance of
maintaining accurate data
- Using forms every time when working at a site or splice can
- Maintaining correct labels at sites
Issues Faced & Potential Setbacks
Transport Engineering -
• 32 hr./Mo. researching where hardware is located
• 8 hr./Mo. saved by not having to update installation drawings.
This will also minimize duplicate info.
• 9 hr./Mo. in time researching equipment cost estimates
Transport Engineers Savings –
49 hr./Mo. * $150/hr. = $7,350/Mo.
Cost Analysis
Transport Network (When circuit database is built) -
• 32 hr./Mo. working on NOFA’s
Transport Network Savings –
32 hr./Mo. * $150/hr. = $4,800/Mo.
Cost Analysis
Technician -
• 16 hr./Mo. accurately investigate fiber assignments plus
36 hr./Mo. for drive time for Transport Engineering
• 3 hr./Mo. having to research outdated handwritten splice
diagrams
Technician Savings –
55 hr./Mo. * $150/hr. = $8,250/Mo.
GIS and CresentLink programs are a better tool for planning
because I can check the results when done – Joe Warren
Cost Analysis
Transport Engineering Savings - $7,350/Mo.
Transport Network Savings - $4,800/Mo. (When circuit database
becomes available)
Technician Savings - $8,250/Mo.
$7,350/Mo. + $8,250/Mo. = $15,600/Mo. or $187,200/Yr.
When circuit database becomes available -
$7,350/Mo.+$4,800/Mo.+$8,250/Mo. = $20,400/Mo. or $244,800/Yr.
Total Cost Savings
• At least another year to complete the physical components of
Missouri
• At least 2 years to complete the physical components of
Oklahoma
• Add an additional 1 year to the numbers above for continuous
changes/ updates to keep the database current
• Variables include schedules and number of personnel working
to complete this project
Timeline for Completion
• When complete the database will create a better workflow for
the entire telecom dept.
• The database will save employees countless hours searching
for the correct information
• There should be a database administrator for the eventual
increasing in maintenance done to the database
• KAMO Power will initially save upwards of $187,000 per year
for the physical database and $245,000 when the circuit
database is complete
Summary

Mapping K-PowerNet’s Fiber Optic Network

  • 1.
    El Dorado SpringsArea Audit of K-PowerNet’s Fiber Optic Network By Scott Kusselson Project Manager 6/9/2015
  • 2.
    • Introduction • CoverageArea Maps • Stats • Demonstration of CresentLink’s Capabilities • A look at Peculiar POP • Benefits of a GIS Database • Issues Faced • Cost Analysis • Timeline for Completion • Summary Outline ofTopics
  • 5.
    • Total of23 working weeks, 16 weeks spent in the field over 11 months • Covered an area of over 10,000 sq. mi. • Completed over 130 sites • Added over 3300 pieces of equipment Stats
  • 6.
  • 7.
    • Better recordkeepingbecause of a centralized location of information • Operational and strategic benefits for the entire telecommunications department • Greater efficiency in time spent researching information • Managing information geographically Benefits of a GIS Database
  • 8.
    • Biggest issuefaced so far was the network speed of using GIS at sites • Availability – Limited number knowledgeable personnel invested in maintaining the database • Maintaining the GIS database • Executives needs to stress to field technicians the importance of maintaining accurate data - Using forms every time when working at a site or splice can - Maintaining correct labels at sites Issues Faced & Potential Setbacks
  • 9.
    Transport Engineering - •32 hr./Mo. researching where hardware is located • 8 hr./Mo. saved by not having to update installation drawings. This will also minimize duplicate info. • 9 hr./Mo. in time researching equipment cost estimates Transport Engineers Savings – 49 hr./Mo. * $150/hr. = $7,350/Mo. Cost Analysis
  • 10.
    Transport Network (Whencircuit database is built) - • 32 hr./Mo. working on NOFA’s Transport Network Savings – 32 hr./Mo. * $150/hr. = $4,800/Mo. Cost Analysis
  • 11.
    Technician - • 16hr./Mo. accurately investigate fiber assignments plus 36 hr./Mo. for drive time for Transport Engineering • 3 hr./Mo. having to research outdated handwritten splice diagrams Technician Savings – 55 hr./Mo. * $150/hr. = $8,250/Mo. GIS and CresentLink programs are a better tool for planning because I can check the results when done – Joe Warren Cost Analysis
  • 12.
    Transport Engineering Savings- $7,350/Mo. Transport Network Savings - $4,800/Mo. (When circuit database becomes available) Technician Savings - $8,250/Mo. $7,350/Mo. + $8,250/Mo. = $15,600/Mo. or $187,200/Yr. When circuit database becomes available - $7,350/Mo.+$4,800/Mo.+$8,250/Mo. = $20,400/Mo. or $244,800/Yr. Total Cost Savings
  • 13.
    • At leastanother year to complete the physical components of Missouri • At least 2 years to complete the physical components of Oklahoma • Add an additional 1 year to the numbers above for continuous changes/ updates to keep the database current • Variables include schedules and number of personnel working to complete this project Timeline for Completion
  • 14.
  • 15.
    • When completethe database will create a better workflow for the entire telecom dept. • The database will save employees countless hours searching for the correct information • There should be a database administrator for the eventual increasing in maintenance done to the database • KAMO Power will initially save upwards of $187,000 per year for the physical database and $245,000 when the circuit database is complete Summary