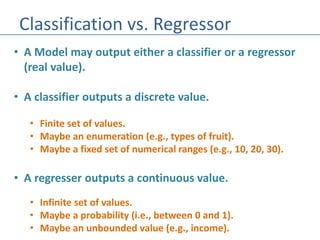
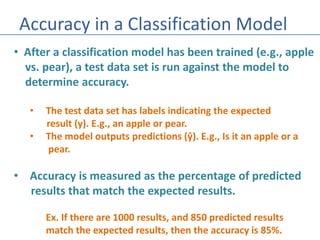
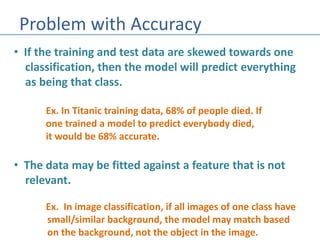
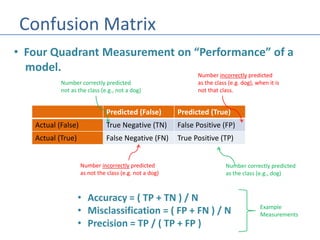
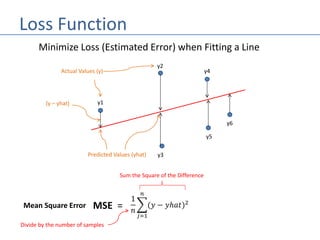
Abstract: This PDSG workshop introduces basic concepts on measuring accuracy of your trained model. Concepts covered are loss functions and confusion matrices.
Level: Fundamental
Requirements: No prior programming or statistics knowledge required.
This presentation educates you about Classification and
Regression trees (CART), CART decision tree methodology, Classification Trees, Regression Trees, Differences in CART, When to use CART?, Advantages of CART, Limitations of CART and What is a CART in Machine Learning?.
For more topics stay tuned with Learnbay.
A confusion matrix is a table that shows the performance of a classification model by listing the true positives, true negatives, false positives, and false negatives. It displays how often the model correctly or incorrectly classified observations into their actual classes. The document provides an example confusion matrix for a model classifying apples, oranges, and pears, showing the number of observations the model correctly and incorrectly classified into each class.
A confusion matrix is a tool used to evaluate the performance of a supervised machine learning model for classification problems. It allows visualization of correct and incorrect predictions compared to the actual classifications in a test dataset. The confusion matrix shows the true positives, false positives, true negatives, and false negatives. This helps determine the accuracy, precision, recall, F1 score and area under the curve (AUC) of the model, which are more comprehensive metrics for evaluation than accuracy alone.
Machine Learning Tutorial Part - 2 | Machine Learning Tutorial For Beginners ...Simplilearn
This presentation on Machine Learning will help you understand what is clustering, K-Means clustering, flowchart to understand K-Means clustering along with demo showing clustering of cars into brands, what is logistic regression, logistic regression curve, sigmoid function and a demo on how to classify a tumor as malignant or benign based on its features. Machine Learning algorithms can help computers play chess, perform surgeries, and get smarter and more personal. K-Means & logistic regression are two widely used Machine learning algorithms which we are going to discuss in this video. Logistic Regression is used to estimate discrete values (usually binary values like 0/1) from a set of independent variables. It helps to predict the probability of an event by fitting data to a logit function. It is also called logit regression. K-means clustering is an unsupervised learning algorithm. In this case, you don't have labeled data unlike in supervised learning. You have a set of data that you want to group into and you want to put them into clusters, which means objects that are similar in nature and similar in characteristics need to be put together. This is what k-means clustering is all about. Now, let us get started and understand K-Means clustering & logistic regression in detail.
Below topics are explained in this Machine Learning tutorial part -2 :
1. Clustering
- What is clustering?
- K-Means clustering
- Flowchart to understand K-Means clustering
- Demo - Clustering of cars based on brands
2. Logistic regression
- What is logistic regression?
- Logistic regression curve & Sigmoid function
- Demo - Classify a tumor as malignant or benign based on features
About Simplilearn Machine Learning course:
A form of artificial intelligence, Machine Learning is revolutionizing the world of computing as well as all people’s digital interactions. Machine Learning powers such innovative automated technologies as recommendation engines, facial recognition, fraud protection and even self-driving cars.This Machine Learning course prepares engineers, data scientists and other professionals with knowledge and hands-on skills required for certification and job competency in Machine Learning.
We recommend this Machine Learning training course for the following professionals in particular:
1. Developers aspiring to be a data scientist or Machine Learning engineer
2. Information architects who want to gain expertise in Machine Learning algorithms
3. Analytics professionals who want to work in Machine Learning or artificial intelligence
4. Graduates looking to build a career in data science and Machine Learning
Learn more at: https://www.simplilearn.com/
This course is all about the data mining that how we get the optimized results. it included with all types and how we use these techniques.This course is all about the data mining that how we get the optimized results. it included with all types and how we use these techniques.This course is all about the data mining that how we get the optimized results. it included with all types and how we use these techniques.This course is all about the data mining that how we get the optimized results. it included with all types and how we use these techniques.This course is all about the data mining that how we get the optimized results. it included with all types and how we use these techniques
This document discusses data cubes, which are multidimensional data structures used in online analytical processing (OLAP) to enable fast retrieval of data organized by dimensions and measures. Data cubes can have 2-3 dimensions or more and contain measures like costs or units. Key concepts are slicing to select a 2D page, dicing to define a subcube, and rotating to change dimensional orientation. Data cubes represent categories through dimensions and levels, and store facts as measures in cells. They can be pre-computed fully, not at all, or partially to balance query speed and memory usage. Totals can also be stored to improve performance of aggregate queries.
Ensemble methods combine multiple machine learning models to obtain better predictive performance than from any individual model. There are two main types of ensemble methods: sequential (e.g AdaBoost) where models are generated one after the other, and parallel (e.g Random Forest) where models are generated independently. Popular ensemble methods include bagging, boosting, and stacking. Bagging averages predictions from models trained on random samples of the data, while boosting focuses on correcting previous models' errors. Stacking trains a meta-model on predictions from other models to produce a final prediction.
Introduction to linear regression and the maths behind it like line of best fit, regression matrics. Other concepts include cost function, gradient descent, overfitting and underfitting, r squared.
Supervised and Unsupervised Learning In Machine Learning | Machine Learning T...Simplilearn
This document provides an overview of machine learning, including:
- Machine learning allows computers to learn from data without being explicitly programmed, through processes like analyzing data, training models on past data, and making predictions.
- The main types of machine learning are supervised learning, which uses labeled training data to predict outputs, and unsupervised learning, which finds patterns in unlabeled data.
- Common supervised learning tasks include classification (like spam filtering) and regression (like weather prediction). Unsupervised learning includes clustering, like customer segmentation, and association, like market basket analysis.
- Supervised and unsupervised learning are used in many areas like risk assessment, image classification, fraud detection, customer analytics, and more
Classification of common clustering algorithm and techniques, e.g., hierarchical clustering, distance measures, K-means, Squared error, SOFM, Clustering large databases.
How to validate a model?
What is a best model ?
Types of data
Types of errors
The problem of over fitting
The problem of under fitting
Bias Variance Tradeoff
Cross validation
K-Fold Cross validation
Boot strap Cross validation
Data Analytics For Beginners | Introduction To Data Analytics | Data Analytic...Edureka!
Data Analytics for R Course: https://www.edureka.co/r-for-analytics
This Edureka Tutorial on Data Analytics for Beginners will help you learn the various parameters you need to consider while performing data analysis.
The following are the topics covered in this session:
Introduction To Data Analytics
Statistics
Data Cleaning and Manipulation
Data Visualization
Machine Learning
Roles, Responsibilities and Salary of Data Analyst
Need of R
Hands-On
Statistics for Data Science: https://youtu.be/oT87O0VQRi8
Follow us to never miss an update in the future.
Instagram: https://www.instagram.com/edureka_learning/
Facebook: https://www.facebook.com/edurekaIN/
Twitter: https://twitter.com/edurekain
LinkedIn: https://www.linkedin.com/company/edureka
The document discusses exploratory data analysis and provides examples of how it can be used. It summarizes two case studies: one where an energy utility detected billing fraud by analyzing meter reading patterns, and another where month of birth was found to correlate with exam scores for students in Tamil Nadu. The document then outlines the exploratory data analysis process and provides a high-level overview of U.S. and Indian birth date patterns identified through analysis of large datasets.
Data preprocessing techniques
See my Paris applied psychology conference paper here
https://www.slideshare.net/jasonrodrigues/paris-conference-on-applied-psychology
or
https://prezi.com/view/KBP8JnekVH9LkLOiKY3w/
This document discusses machine learning concepts like supervised and unsupervised learning. It explains that supervised learning uses known inputs and outputs to learn rules while unsupervised learning deals with unknown inputs and outputs. Classification and regression are described as types of supervised learning problems. Classification involves categorizing data into classes while regression predicts continuous, real-valued outputs. Examples of classification and regression problems are provided. Classification models like heuristic, separation, regression and probabilistic models are also mentioned. The document encourages learning more about classification algorithms in upcoming videos.
The document provides an overview of data mining concepts and techniques. It introduces data mining, describing it as the process of discovering interesting patterns or knowledge from large amounts of data. It discusses why data mining is necessary due to the explosive growth of data and how it relates to other fields like machine learning, statistics, and database technology. Additionally, it covers different types of data that can be mined, functionalities of data mining like classification and prediction, and classifications of data mining systems.
This document provides an overview of parametric and non-parametric supervised machine learning. Parametric learning uses a fixed number of parameters and makes strong assumptions about the data, while non-parametric learning uses a flexible number of parameters that grows with more data, making fewer assumptions. Common examples of parametric models include linear regression and logistic regression, while non-parametric examples include K-nearest neighbors, decision trees, and neural networks. The document also briefly discusses calculating parameters using ordinary least mean square for parametric models and the limitations when data does not follow predefined assumptions.
This document discusses Classification and Regression Trees (CART), a data mining technique for classification and regression. CART builds decision trees by recursively splitting data into purer child nodes based on a split criterion, with the goal of minimizing heterogeneity. It describes the 8 step CART generation process: 1) testing all possible splits of variables, 2) evaluating splits using reduction in impurity, 3) selecting the best split, 4) repeating for all variables, 5) selecting the split with most reduction in impurity, 6) assigning classes, 7) repeating on child nodes, and 8) pruning trees to avoid overfitting.
The document discusses cross-validation, which is used to estimate how well a machine learning model will generalize to unseen data. It defines cross-validation as splitting a dataset into training and test sets to train a model on the training set and evaluate it on the held-out test set. Common types of cross-validation discussed are k-fold cross-validation, which repeats the process by splitting the data into k folds, and repeated holdout validation, which randomly samples subsets for training and testing over multiple repetitions.
The document introduces data preprocessing techniques for data mining. It discusses why data preprocessing is important due to real-world data often being dirty, incomplete, noisy, inconsistent or duplicate. It then describes common data types and quality issues like missing values, noise, outliers and duplicates. The major tasks of data preprocessing are outlined as data cleaning, integration, transformation and reduction. Specific techniques for handling missing values, noise, outliers and duplicates are also summarized.
This document summarizes a machine learning workshop on feature selection. It discusses typical feature selection methods like single feature evaluation using metrics like mutual information and Gini indexing. It also covers subset selection techniques like sequential forward selection and sequential backward selection. Examples are provided showing how feature selection improves performance for logistic regression on large datasets with more features than samples. The document outlines the workshop agenda and provides details on when and why feature selection is important for machine learning models.
This document provides an overview of resampling methods, including jackknife, bootstrap, permutation, and cross-validation. It explains that resampling methods are used to approximate sampling distributions and estimate parameters' reliability when the true sampling distribution is difficult to derive. The document then describes each resampling method, their applications, and sampling procedures. It provides examples to illustrate permutation tests and how they are conducted through permutation resampling.
This document provides an overview of classification in machine learning. It discusses supervised learning and the classification process. It describes several common classification algorithms including k-nearest neighbors, Naive Bayes, decision trees, and support vector machines. It also covers performance evaluation metrics like accuracy, precision and recall. The document uses examples to illustrate classification tasks and the training and testing process in supervised learning.
Lecture 10 - Model Testing and Evaluation, a lecture in subject module Statis...Maninda Edirisooriya
Model Testing and Evaluation is a lesson where you learn how to train different ML models with changes and evaluating them to select the best model out of them. This was one of the lectures of a full course I taught in University of Moratuwa, Sri Lanka on 2023 second half of the year.
Abstract: This PDSG workshop introduces basic concepts of splitting a dataset for training a model in machine learning. Concepts covered are training, test and validation data, serial and random splitting, data imbalance and k-fold cross validation.
Level: Fundamental
Requirements: No prior programming or statistics knowledge required.
WEKA:Credibility Evaluating Whats Been Learnedweka Content
- Training and test sets are used to measure classification success rates, with the test set being independent of the training set. The error rate on the training set is optimistic. Cross validation techniques like 10-fold stratified cross validation are used when data is limited.
- True success rates are predicted using properties of statistics and normal distributions. Confidence levels determine the range within which the true rate is expected to lie.
- Techniques like paired t-tests are used to statistically compare the performance of different algorithms or data mining methods. They determine if performance differences are statistically significant.
This document discusses various techniques for evaluating machine learning models and comparing their performance, including:
- Measuring error rates on separate test and training sets to avoid overfitting
- Using techniques like cross-validation, bootstrapping, and holdout validation when data is limited
- Comparing algorithms using statistical tests like paired t-tests
- Accounting for costs of different prediction outcomes in evaluation and model training
- Visualizing performance using lift charts and ROC curves to compare models
- The Minimum Description Length principle for selecting the model that best compresses the data
This document discusses machine learning and natural language processing (NLP) techniques for text classification. It provides an overview of supervised vs. unsupervised learning and classification vs. regression problems. It then walks through the steps to perform binary text classification using logistic regression and Naive Bayes models on an SMS spam collection dataset. The steps include preparing and splitting the data, numerically encoding text with Count Vectorization, fitting models on the training data, and evaluating model performance on the test set using metrics like accuracy, precision, recall and F1 score. Naive Bayes classification is also introduced as an alternative simpler technique to logistic regression for text classification tasks.
This document discusses techniques for evaluating and improving classifiers. It begins by explaining how to evaluate a classifier's accuracy using metrics like accuracy, precision, recall, and F-measure. It introduces the confusion matrix and shows how different parts of the matrix relate to these metrics. The document then discusses issues like overfitting, underfitting, bias and variance that can impact a classifier's performance. It explains that the goal is to balance bias and variance to minimize total error and achieve optimal classification.
The document discusses machine learning and various machine learning concepts. It defines learning as improving performance through experience. Machine learning involves using data to acquire models and learn hidden concepts. The main areas covered are supervised learning (data with labels), unsupervised learning (data without labels), semi-supervised learning (some labels present), and reinforcement learning (agent takes actions and receives rewards/punishments). Decision trees are presented as a way to represent hypotheses learned through examples, with attributes used to recursively split data into partitions.
The document discusses metrics for evaluating classifiers, including true positives, true negatives, false positives, false negatives, and accuracy. It also discusses confusion matrices, sensitivity, specificity, precision, and recall. Additionally, it covers methods for evaluating classifiers like holdout validation, cross-validation, and Bayesian belief networks which allow representation of attribute dependencies.
The document discusses machine learning and various machine learning techniques. It defines machine learning as using data and experience to acquire models and modify decision mechanisms to improve performance. It describes supervised learning where data and labels are provided, unsupervised learning where only data is given, and reinforcement learning where an agent takes actions and receives rewards or punishments. Decision tree learning is discussed as a supervised learning method where trees are constructed by recursively splitting data based on attribute tests that optimize criteria like information gain. Overfitting and techniques like pruning are addressed to improve generalization.
This document discusses machine learning and various machine learning techniques. It begins by defining learning and different types of machine learning, including supervised learning, unsupervised learning, and reinforcement learning. It then focuses on supervised learning, discussing important concepts like training and test sets. Decision trees are presented as a popular supervised learning technique, including how they are constructed using a top-down recursive approach that chooses attributes to best split the data based on measures like information gain. Overfitting is also discussed as an issue to address with techniques like pruning.
This document discusses various methods for evaluating machine learning models, including:
- Using train, test, and validation sets to evaluate models on large datasets. Cross-validation is recommended for smaller datasets.
- Accuracy, error, precision, recall, and other metrics to quantify a model's performance using a confusion matrix.
- Lift charts and gains charts provide a visual comparison of a model's performance compared to no model. They are useful when costs are associated with different prediction outcomes.
The document discusses machine learning and various machine learning techniques. It defines machine learning as using data and experience to acquire models and modify decision mechanisms to improve performance. The document outlines different types of machine learning including supervised learning (using labeled data), unsupervised learning (using only unlabeled data), and reinforcement learning (where an agent takes actions and receives rewards or punishments). It provides examples of classification problems and discusses decision tree learning as a supervised learning method, including how decision trees are constructed and potential issues like overfitting.
http://imatge-upc.github.io/telecombcn-2016-dlcv/
Deep Learning for Computer Vision Barcelona
Summer seminar UPC TelecomBCN (July 4-8, 2016)
Deep learning technologies are at the core of the current revolution in artificial intelligence for multimedia data analysis. The convergence of big annotated data and affordable GPU hardware has allowed the training of neural networks for data analysis tasks which had been addressed until now with hand-crafted features. Architectures such as convolutional neural networks, recurrent neural networks and Q-nets for reinforcement learning have shaped a brand new scenario in signal processing. This course will cover the basic principles and applications of deep learning to computer vision problems, such as image classification, object detection or text captioning.
Assessing Model Performance - Beginner's GuideMegan Verbakel
A binary classifier predicts outcomes that are either 0 or 1. It is trained on historical data containing features and targets, and learns patterns to predict probabilities of each class for new data. Performance is evaluated using metrics like accuracy, precision, recall from a confusion matrix, and ROC AUC. The bias-variance tradeoff and over/under fitting are minimized by optimizing model complexity during training and testing.
A small informative presentation on machine learning.
It contains the following topics:
Introduction to ML
Types of Learning
Regression
Classification
Classification vs Regression
Clustering
Decision Tree Learning
Random Forest
True vs False
Positive vs Negative
Linear Regression
Logistic Regression
Application of Machine Learning
Future of Machine Learning
This document discusses various methods for evaluating machine learning models. It describes splitting data into training, validation, and test sets to evaluate models on large datasets. For small or unbalanced datasets, it recommends cross-validation techniques like k-fold cross-validation and stratified sampling. The document also covers evaluating classifier performance using metrics like accuracy, confidence intervals, and lift charts, as well as addressing issues that can impact evaluation like overfitting and class imbalance.
This document discusses four types of learning agents in artificial intelligence: simple reflex agents, model-based agents, goal-based agents, and utility-based agents. A learning agent improves upon these by dynamically learning a policy to model its environment and build action-state rules based on rewards from interacting with its environment.
Abstract: This workshop teaches the application of statistics to the software quality assurance process. The course covers smoke testing, acceptance testing, Pareto principle, defect distributions, automated vs. manual testing, predicting effort, and experimental thoughts using Bellman equation approach and machine learning.
Level: Intermediate
Requirements: Some basic statistics knowledge is preferred and experience or exposure to the software quality assurance process.
Abstract: This workshop teaches basic algorithms in whiteboarding interviews. All the code examples are in Python and the course has dual purpose teaching basic Python programming.
Abstract: This PDSG workshop covers the basics of OOP programming in Python. Concepts covered are class, object, scope, method overloading and inheritance.
Level: Fundamental
Requirements: One should have some knowledge of programming.
Abstract: This PDSG workshop covers the basics of OOP programming in Python. Concepts covered are class, object, scope, method overloading and inheritance.
Level: Fundamental
Requirements: One should have some knowledge of programming.
Python - Installing and Using Python and Jupyter NotepadAndrew Ferlitsch
Abstract: This PDSG workshop covers installing Python and Juypter Notebook, and how to create a notebook.
Level: Fundamental
Requirements: One should have some knowledge of programming.
Natural Language Processing - Groupings (Associations) GenerationAndrew Ferlitsch
Abstract: This PDSG workshop covers methods to automatically generate word groupings as associations, which can be used to teach associations between objects to pre-school and early school children. Ex. What item does not belong? Cat, Dog, Fire Truck, Bird
In this presentation, I will cover how to build categorical and association dictionaries to automatically generate associations of the form, what item does not belong.
Level: Intermediate
Requirements: One should have some programming knowledge.
Natural Language Provessing - Handling Narrarive Fields in Datasets for Class...Andrew Ferlitsch
Abstract: It is common for government and public datasets to include narrative fields, such as inspection reports, incident reporting, surveys, 911 calls, fire response, etc. In addition to categorical fields, such as datetime, location, demographics, these datasets tend to include a narrative description (e.g., what happened). It is typically in the narrative field that the most interesting data resides for the purpose of classifying. The problem, is that since the narrative is human interpreted and entered, each entry may be unique and if we use the whole entry as a single value, one will end up with an overfitted model that works only on the training data.
In this presentation, I will cover how natural language processing techniques are used to convert narrative fields into categorical data.
Level: Intermediate
Requirements: One should know basics of linear regression models. No prior programming knowledge is required.
Machine Learning - Introduction to Recurrent Neural NetworksAndrew Ferlitsch
Abstract: This PDSG workshop introduces basic concepts of recurrent neural networks. Concepts covered are feed forward vs. recurrent, time progression, memory cells, short term memory predictions and long term memory predictions.
Level: Fundamental
Requirements: No prior programming or statistics knowledge required.
Machine Learning - Introduction to Convolutional Neural NetworksAndrew Ferlitsch
Abstract: This PDSG workshop introduces basic concepts of convolutional neural networks. Concepts covered are image pixels, image preprocessing, feature detectors, feature maps, convolution, ReLU, pooling and flattening.
Level: Fundamental
Requirements: No prior programming or statistics knowledge required. Some knowledge of neural networks is recommended.
Machine Learning - Introduction to Neural NetworksAndrew Ferlitsch
Abstract: This PDSG workshop introduces basic concepts of neural networks. Concepts covered are Neurons, Binary vs. Categorical vs. Real Value output, activation functions, fully connected networks, deep neural networks, specialized learners, cost function and feed forward.
Level: Fundamental
Requirements: No prior programming or statistics knowledge required.
Abstract: This PDSG workshop introduces the basics of Python libraries used in machine learning. Libraries covered are Numpy, Pandas and MathlibPlot.
Level: Fundamental
Requirements: One should have some knowledge of programming and some statistics.
Abstract: This PDSG workshop introduces basic concepts of ensemble methods in machine learning. Concepts covered are Condercet Jury Theorem, Weak Learners, Decision Stumps, Bagging and Majority Voting.
Level: Fundamental
Requirements: No prior programming or statistics knowledge required.
Abstract: This PDSG workshop introduces basic concepts of multiple linear regression in machine learning. Concepts covered are Feature Elimination and Backward Elimination, with examples in Python.
Level: Fundamental
Requirements: Should have some experience with Python programming.
Abstract: This PDSG workshop introduces basic concepts of simple linear regression in machine learning. Concepts covered are Slope of a Line, Loss Function, and Solving Simple Linear Regression Equation, with examples.
Level: Fundamental
Requirements: No prior programming or statistics knowledge required.
Abstract: This PDSG workshop introduces basic concepts of categorical variables in training data. Concepts covered are dummy variable conversion, and dummy variable trap.
Level: Fundamental
Requirements: No prior programming or statistics knowledge required.
Dataset Preparation
Abstract: This PDSG workshop introduces basic concepts on preparing a dataset for training a model. Concepts covered are data wrangling, replacing missing values, categorical variable conversion, and feature scaling.
Level: Fundamental
Requirements: No prior programming or statistics knowledge required.
Abstract: This PDSG workshop introduces basic concepts on TensorFlow. The course covers fundamentals. Concepts covered are Vectors/Matrices/Vectors, Design&Run, Constants, Operations, Placeholders, Bindings, Operators, Loss Function and Training.
Level: Fundamental
Requirements: Some basic programming knowledge is preferred. No prior statistics background is required.
Abstract: This PDSG workshop introduces basic concepts on machine learning. The course covers fundamentals of Supervised and Unsupervised Learning, Decision Trees, Pruning, Ensemble Trees, Linear Regressions, Loss Functions, K-means, and dataset preparation.
Level: Fundamental
Requirements: No prior programming or statistics knowledge required.
Abstract: This PDSG workshop introduces basic concepts on dynamic programming. The course compares dynamic programming to traditional programming and walks attendees through examples to demonstrate both the difference and the concept.
Level: Fundamental
Requirements: Requires some prior programming knowledge and understanding of breadth first search (BFS) algorithm, which is used in the examples.
Climate Impact of Software Testing at Nordic Testing DaysKari Kakkonen
My slides at Nordic Testing Days 6.6.2024
Climate impact / sustainability of software testing discussed on the talk. ICT and testing must carry their part of global responsibility to help with the climat warming. We can minimize the carbon footprint but we can also have a carbon handprint, a positive impact on the climate. Quality characteristics can be added with sustainability, and then measured continuously. Test environments can be used less, and in smaller scale and on demand. Test techniques can be used in optimizing or minimizing number of tests. Test automation can be used to speed up testing.
Unlocking Productivity: Leveraging the Potential of Copilot in Microsoft 365, a presentation by Christoforos Vlachos, Senior Solutions Manager – Modern Workplace, Uni Systems
Maruthi Prithivirajan, Head of ASEAN & IN Solution Architecture, Neo4j
Get an inside look at the latest Neo4j innovations that enable relationship-driven intelligence at scale. Learn more about the newest cloud integrations and product enhancements that make Neo4j an essential choice for developers building apps with interconnected data and generative AI.
How to Get CNIC Information System with Paksim Ga.pptxdanishmna97
Pakdata Cf is a groundbreaking system designed to streamline and facilitate access to CNIC information. This innovative platform leverages advanced technology to provide users with efficient and secure access to their CNIC details.
GDG Cloud Southlake #33: Boule & Rebala: Effective AppSec in SDLC using Deplo...James Anderson
Effective Application Security in Software Delivery lifecycle using Deployment Firewall and DBOM
The modern software delivery process (or the CI/CD process) includes many tools, distributed teams, open-source code, and cloud platforms. Constant focus on speed to release software to market, along with the traditional slow and manual security checks has caused gaps in continuous security as an important piece in the software supply chain. Today organizations feel more susceptible to external and internal cyber threats due to the vast attack surface in their applications supply chain and the lack of end-to-end governance and risk management.
The software team must secure its software delivery process to avoid vulnerability and security breaches. This needs to be achieved with existing tool chains and without extensive rework of the delivery processes. This talk will present strategies and techniques for providing visibility into the true risk of the existing vulnerabilities, preventing the introduction of security issues in the software, resolving vulnerabilities in production environments quickly, and capturing the deployment bill of materials (DBOM).
Speakers:
Bob Boule
Robert Boule is a technology enthusiast with PASSION for technology and making things work along with a knack for helping others understand how things work. He comes with around 20 years of solution engineering experience in application security, software continuous delivery, and SaaS platforms. He is known for his dynamic presentations in CI/CD and application security integrated in software delivery lifecycle.
Gopinath Rebala
Gopinath Rebala is the CTO of OpsMx, where he has overall responsibility for the machine learning and data processing architectures for Secure Software Delivery. Gopi also has a strong connection with our customers, leading design and architecture for strategic implementations. Gopi is a frequent speaker and well-known leader in continuous delivery and integrating security into software delivery.
Unlock the Future of Search with MongoDB Atlas_ Vector Search Unleashed.pdfMalak Abu Hammad
Discover how MongoDB Atlas and vector search technology can revolutionize your application's search capabilities. This comprehensive presentation covers:
* What is Vector Search?
* Importance and benefits of vector search
* Practical use cases across various industries
* Step-by-step implementation guide
* Live demos with code snippets
* Enhancing LLM capabilities with vector search
* Best practices and optimization strategies
Perfect for developers, AI enthusiasts, and tech leaders. Learn how to leverage MongoDB Atlas to deliver highly relevant, context-aware search results, transforming your data retrieval process. Stay ahead in tech innovation and maximize the potential of your applications.
#MongoDB #VectorSearch #AI #SemanticSearch #TechInnovation #DataScience #LLM #MachineLearning #SearchTechnology
Dr. Sean Tan, Head of Data Science, Changi Airport Group
Discover how Changi Airport Group (CAG) leverages graph technologies and generative AI to revolutionize their search capabilities. This session delves into the unique search needs of CAG’s diverse passengers and customers, showcasing how graph data structures enhance the accuracy and relevance of AI-generated search results, mitigating the risk of “hallucinations” and improving the overall customer journey.
GridMate - End to end testing is a critical piece to ensure quality and avoid...ThomasParaiso2
End to end testing is a critical piece to ensure quality and avoid regressions. In this session, we share our journey building an E2E testing pipeline for GridMate components (LWC and Aura) using Cypress, JSForce, FakerJS…
DevOps and Testing slides at DASA ConnectKari Kakkonen
My and Rik Marselis slides at 30.5.2024 DASA Connect conference. We discuss about what is testing, then what is agile testing and finally what is Testing in DevOps. Finally we had lovely workshop with the participants trying to find out different ways to think about quality and testing in different parts of the DevOps infinity loop.
Essentials of Automations: The Art of Triggers and Actions in FMESafe Software
In this second installment of our Essentials of Automations webinar series, we’ll explore the landscape of triggers and actions, guiding you through the nuances of authoring and adapting workspaces for seamless automations. Gain an understanding of the full spectrum of triggers and actions available in FME, empowering you to enhance your workspaces for efficient automation.
We’ll kick things off by showcasing the most commonly used event-based triggers, introducing you to various automation workflows like manual triggers, schedules, directory watchers, and more. Plus, see how these elements play out in real scenarios.
Whether you’re tweaking your current setup or building from the ground up, this session will arm you with the tools and insights needed to transform your FME usage into a powerhouse of productivity. Join us to discover effective strategies that simplify complex processes, enhancing your productivity and transforming your data management practices with FME. Let’s turn complexity into clarity and make your workspaces work wonders!
Pushing the limits of ePRTC: 100ns holdover for 100 daysAdtran
At WSTS 2024, Alon Stern explored the topic of parametric holdover and explained how recent research findings can be implemented in real-world PNT networks to achieve 100 nanoseconds of accuracy for up to 100 days.
In the rapidly evolving landscape of technologies, XML continues to play a vital role in structuring, storing, and transporting data across diverse systems. The recent advancements in artificial intelligence (AI) present new methodologies for enhancing XML development workflows, introducing efficiency, automation, and intelligent capabilities. This presentation will outline the scope and perspective of utilizing AI in XML development. The potential benefits and the possible pitfalls will be highlighted, providing a balanced view of the subject.
We will explore the capabilities of AI in understanding XML markup languages and autonomously creating structured XML content. Additionally, we will examine the capacity of AI to enrich plain text with appropriate XML markup. Practical examples and methodological guidelines will be provided to elucidate how AI can be effectively prompted to interpret and generate accurate XML markup.
Further emphasis will be placed on the role of AI in developing XSLT, or schemas such as XSD and Schematron. We will address the techniques and strategies adopted to create prompts for generating code, explaining code, or refactoring the code, and the results achieved.
The discussion will extend to how AI can be used to transform XML content. In particular, the focus will be on the use of AI XPath extension functions in XSLT, Schematron, Schematron Quick Fixes, or for XML content refactoring.
The presentation aims to deliver a comprehensive overview of AI usage in XML development, providing attendees with the necessary knowledge to make informed decisions. Whether you’re at the early stages of adopting AI or considering integrating it in advanced XML development, this presentation will cover all levels of expertise.
By highlighting the potential advantages and challenges of integrating AI with XML development tools and languages, the presentation seeks to inspire thoughtful conversation around the future of XML development. We’ll not only delve into the technical aspects of AI-powered XML development but also discuss practical implications and possible future directions.
In his public lecture, Christian Timmerer provides insights into the fascinating history of video streaming, starting from its humble beginnings before YouTube to the groundbreaking technologies that now dominate platforms like Netflix and ORF ON. Timmerer also presents provocative contributions of his own that have significantly influenced the industry. He concludes by looking at future challenges and invites the audience to join in a discussion.
zkStudyClub - Reef: Fast Succinct Non-Interactive Zero-Knowledge Regex ProofsAlex Pruden
This paper presents Reef, a system for generating publicly verifiable succinct non-interactive zero-knowledge proofs that a committed document matches or does not match a regular expression. We describe applications such as proving the strength of passwords, the provenance of email despite redactions, the validity of oblivious DNS queries, and the existence of mutations in DNA. Reef supports the Perl Compatible Regular Expression syntax, including wildcards, alternation, ranges, capture groups, Kleene star, negations, and lookarounds. Reef introduces a new type of automata, Skipping Alternating Finite Automata (SAFA), that skips irrelevant parts of a document when producing proofs without undermining soundness, and instantiates SAFA with a lookup argument. Our experimental evaluation confirms that Reef can generate proofs for documents with 32M characters; the proofs are small and cheap to verify (under a second).
Paper: https://eprint.iacr.org/2023/1886
Encryption in Microsoft 365 - ExpertsLive Netherlands 2024Albert Hoitingh
In this session I delve into the encryption technology used in Microsoft 365 and Microsoft Purview. Including the concepts of Customer Key and Double Key Encryption.
Encryption in Microsoft 365 - ExpertsLive Netherlands 2024
Machine Learning - Accuracy and Confusion Matrix
1. Machine Learning
Accuracy and Confusion Matrix
Portland Data Science Group
Created by Andrew Ferlitsch
Community Outreach Officer
July, 2017
2. Classification vs. Regressor
• A Model may output either a classifier or a regressor
(real value).
• A classifier outputs a discrete value.
• Finite set of values.
• Maybe an enumeration (e.g., types of fruit).
• Maybe a fixed set of numerical ranges (e.g., 10, 20, 30).
• A regresser outputs a continuous value.
• Infinite set of values.
• Maybe a probability (i.e., between 0 and 1).
• Maybe an unbounded value (e.g., income).
3. Accuracy in a Classification Model
• After a classification model has been trained (e.g., apple
vs. pear), a test data set is run against the model to
determine accuracy.
• The test data set has labels indicating the expected
result (y). E.g., an apple or pear.
• The model outputs predictions (ŷ). E.g., Is it an apple or a
pear.
• Accuracy is measured as the percentage of predicted
results that match the expected results.
Ex. If there are 1000 results, and 850 predicted results
match the expected results, then the accuracy is 85%.
4. Problem with Accuracy
• If the training and test data are skewed towards one
classification, then the model will predict everything
as being that class.
Ex. In Titanic training data, 68% of people died. If
one trained a model to predict everybody died,
it would be 68% accurate.
• The data may be fitted against a feature that is not
relevant.
Ex. In image classification, if all images of one class have
small/similar background, the model may match based
on the background, not the object in the image.
5. Confusion Matrix
• Four Quadrant Measurement on “Performance” of a
model.
Predicted (False) Predicted (True)
Actual (False) True Negative (TN) False Positive (FP)
Actual (True) False Negative (FN) True Positive (TP)
Number correctly predicted
as the class (e.g., dog)
Number correctly predicted
not as the class (e.g., not a dog)
Number incorrectly predicted
as the class (e.g. dog), when it is
not that class.
Number incorrectly predicted
as not the class (e.g. not a dog)
• Accuracy = ( TP + TN ) / N
• Misclassification = ( FP + FN ) / N
• Precision = TP / ( TP + FP )
Example
Measurements
6. Accuracy in a Regression Model
• After a regression model has been trained, a test data
set is run against the model to determine accuracy.
• The test data set has labels indicating the expected
result (y). E.g., expected spending level.
• The model outputs predictions (ŷ). E.g., Amount of spending.
• Accuracy is measured as a cost (or loss) function
between the expected result and predicted result.
• Ex. Mean Square Error
7. Loss Function
Minimize Loss (Estimated Error) when Fitting a Line
y1
Actual Values (y)
Predicted Values (yhat)
y2
y3
y4
y5
y6
1
𝑛
𝑗=1
𝑛
(𝑦 − 𝑦ℎ𝑎𝑡)2
MSE =
(y – yhat)
Mean Square Error
Sum the Square of the Difference
Divide by the number of samples