Download to read offline

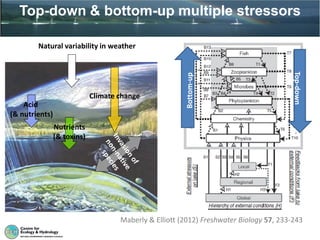

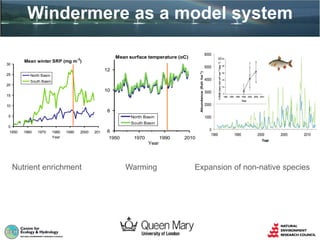
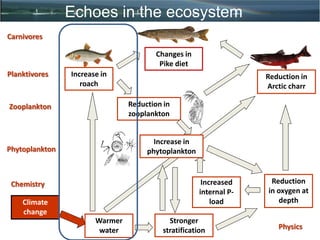
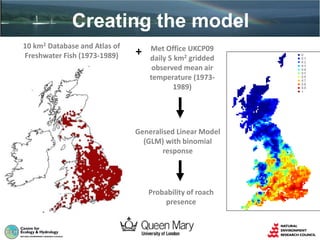
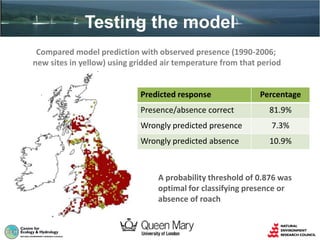
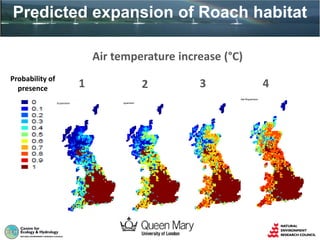
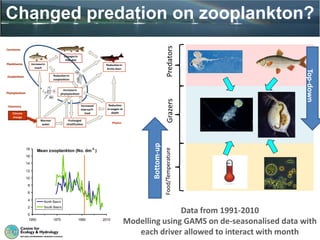
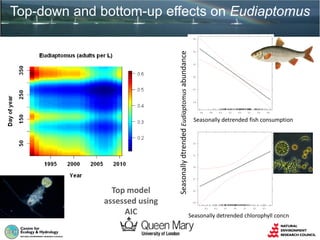
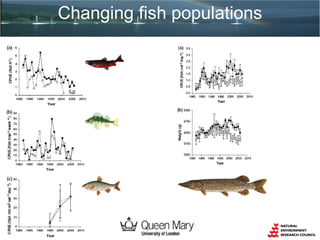
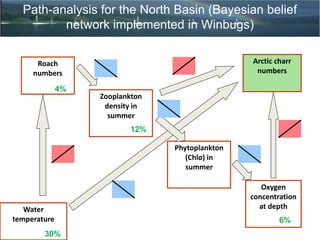
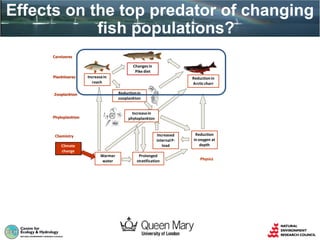
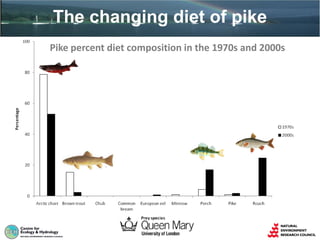

Climate change is altering the ecosystem of Windermere lake in the following ways: Warming water temperatures have reduced zooplankton populations and increased the numbers and range of roach fish. This has led to bottom-up effects of increased phytoplankton and top-down impacts such as reduced Arctic charr fish and lower oxygen levels at depth. Path analysis indicates the changes have rippled through the food web, impacting top predators like pike fish, whose diets have shifted over time. Climate change represents a global stressor that cannot be managed locally, and further surprises are expected as species ranges shift in the lake's complex interacting system.


