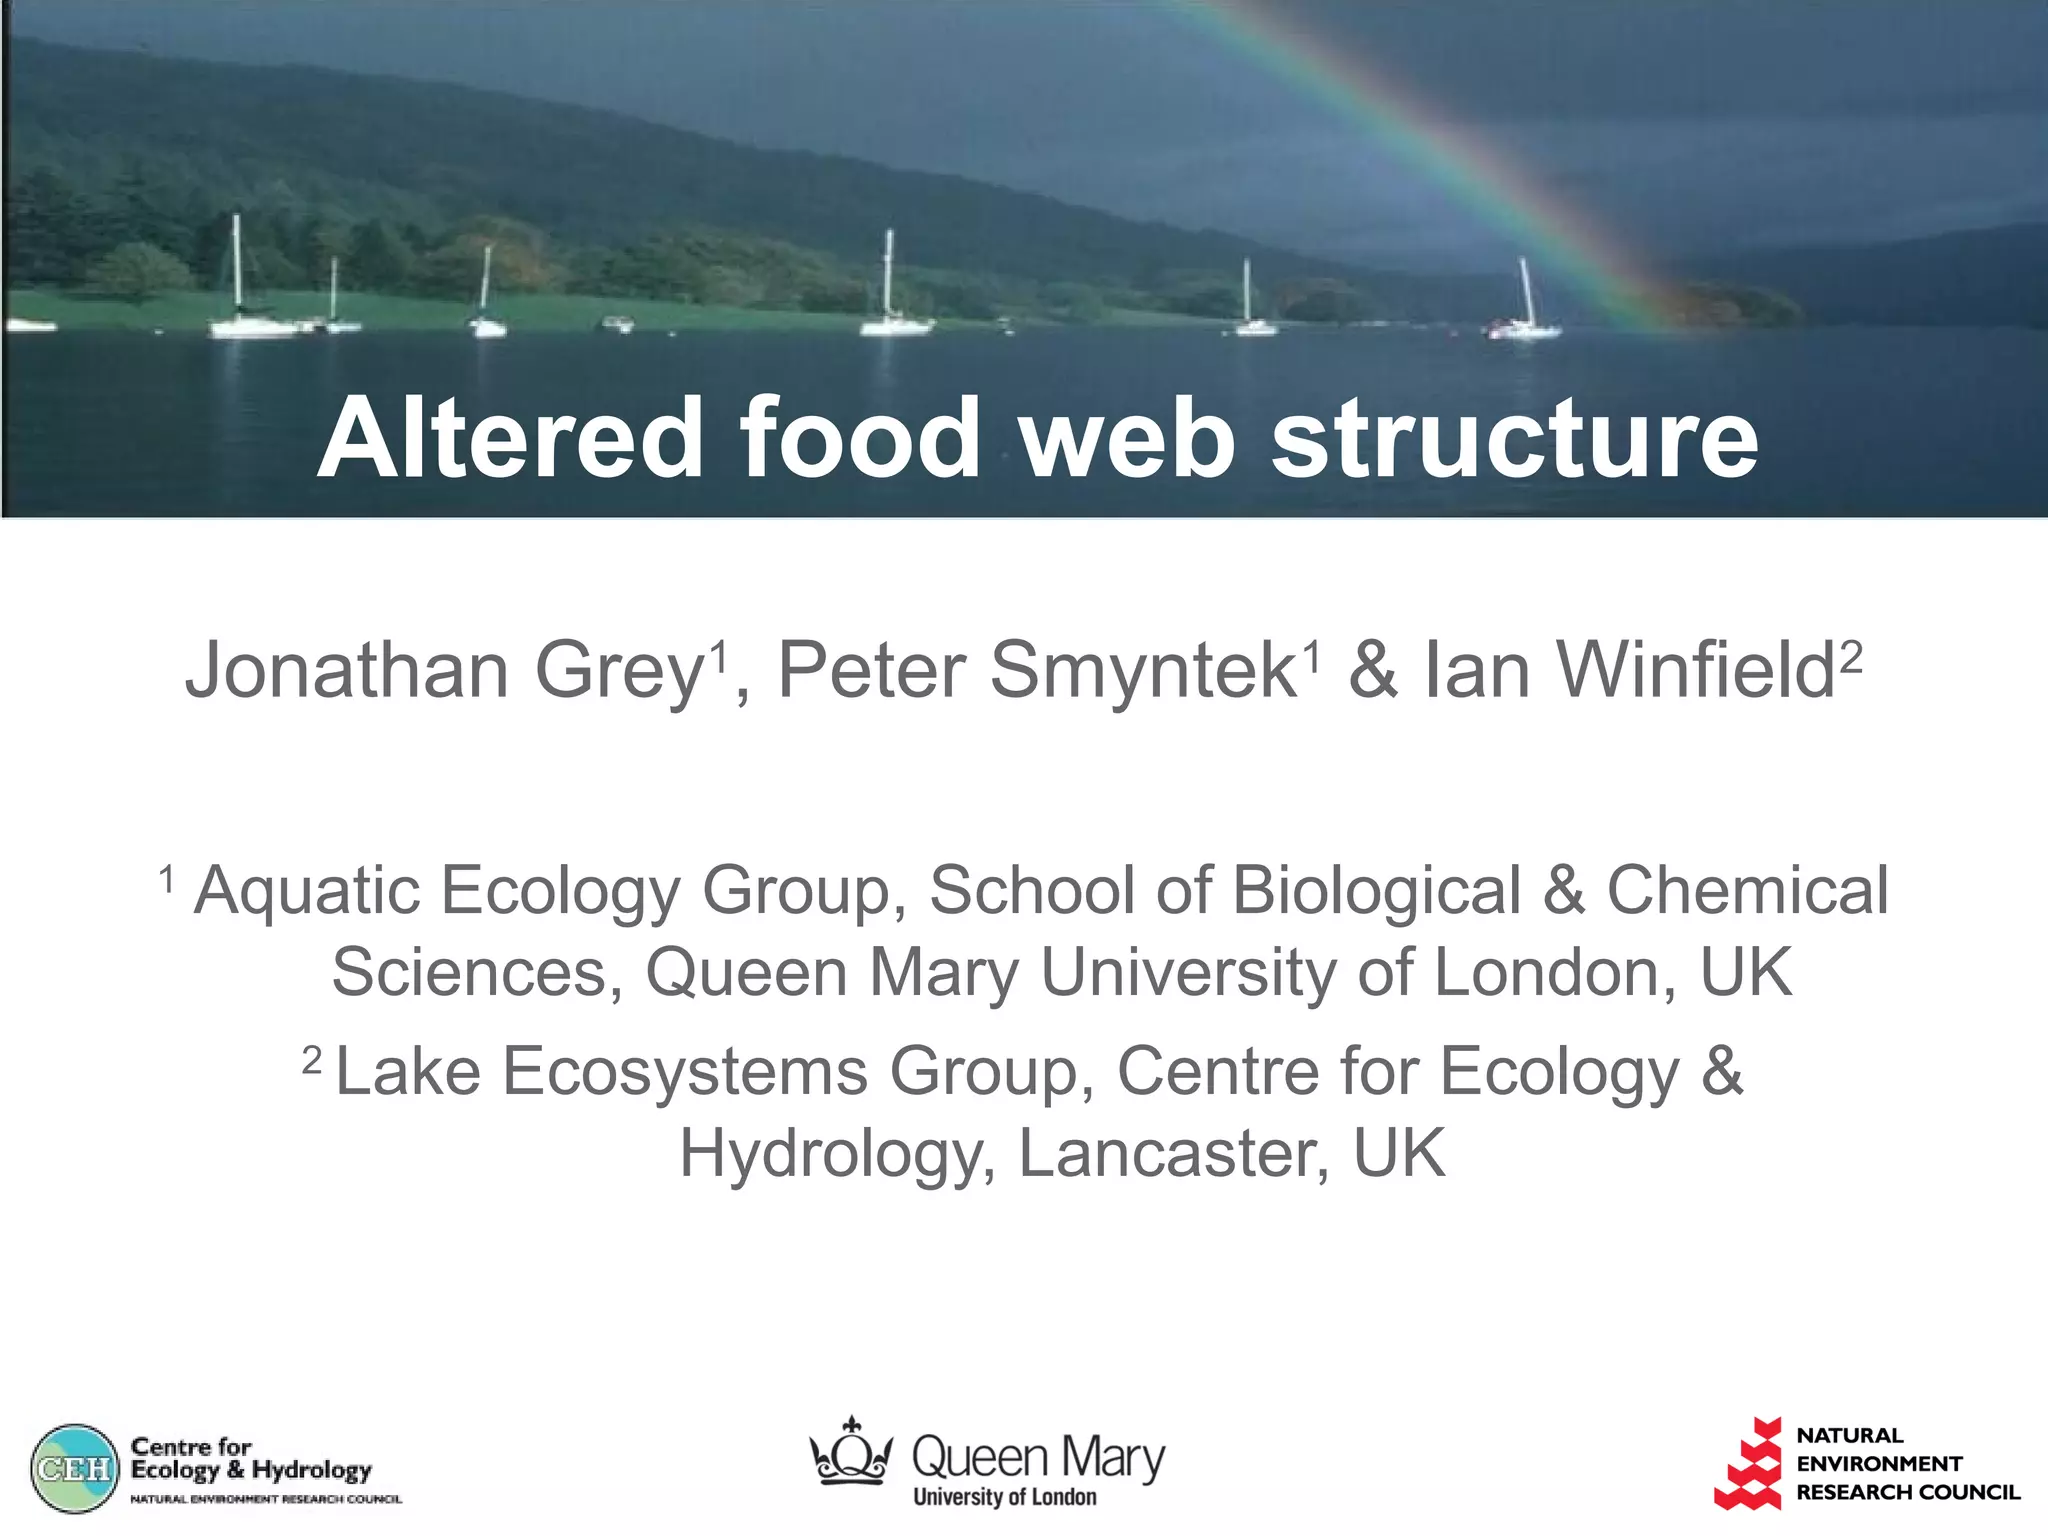
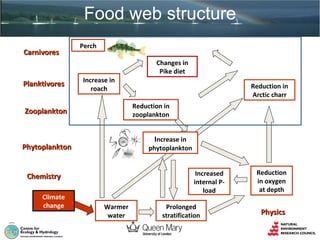
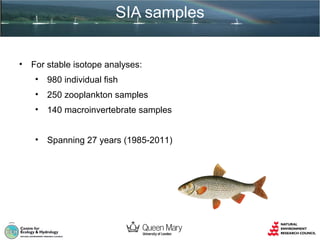
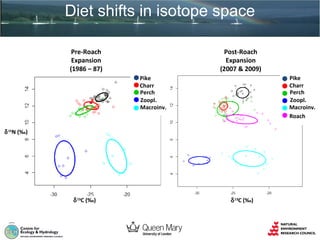
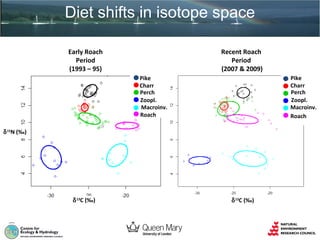
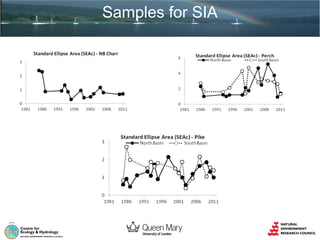
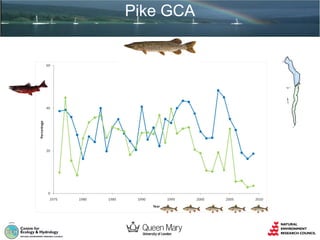
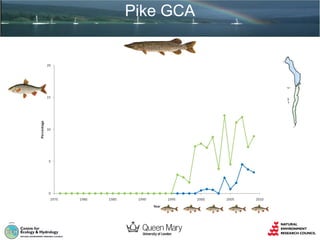
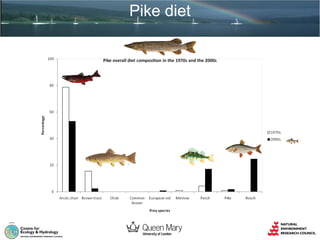
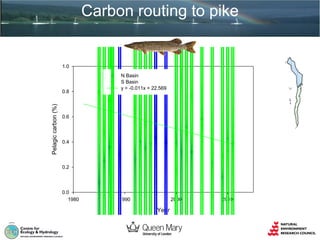
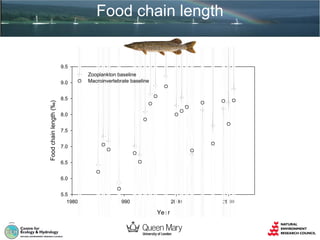
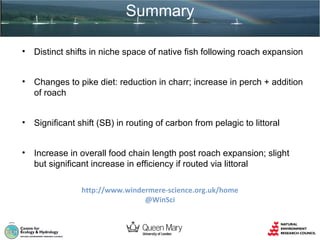
Altered food web structure
Jonathan Grey1, Peter Smyntek1 & Ian Winfield2
1

Aquatic Ecology Group, School of Biological & Chemical
Sciences, Queen Mary University of London, UK
2
Lake Ecosystems Group, Centre for Ecology &
Hydrology, Lancaster, UK
Food web structure
Carnivores

Perch
Changes in
Pike diet

Planktivores

Increase in
roach
Reduction in
zooplankton

Zooplankton

Increase in

Phytoplankton

phytoplankton
Increased
internal Pload

Chemistry
Climate
change

Reduction in
Arctic charr

Warmer
water

Prolonged
stratification

Reduction
in oxygen
at depth

Physics
SIA samples
•

For stable isotope analyses:
•

980 individual fish

•

250 zooplankton samples

•

140 macroinvertebrate samples

•

Spanning 27 years (1985-2011)
Archives & isotopes
-12

A

-14

Acidified scale δ13C (‰)

-16
-18
-20
-22
-24
-26

y = 0.99x + 0.64; r2 = 0.92; P<0.0001

-28
-30
-30

-28

-26

-24

-22

-20

-18

-16

-14

-12

Defatted muscle δ13C (‰)

eg Grey et al 2009
Hypotheses
•

Increase in roach caused: a change in pike diet through provision of
extra / alternative prey; and a shift in niche space for native
equivalents

•

Shift in routing of carbon through food web to top predator (pike)
from predominantly pelagic to littoral

•

Increased efficiency of food web via reduced trophic linkage
Recap from IJW

•

Diet changes alongside roach increase:
•
•

Arctic charr decreases in macroinvertebrates and Daphnia,
increase in zooplanktivores

•

•

Perch decreases in macroinvertebrates and Daphnia, increase
in zooplanktivores

Roach remarkably stable and dominated by macroinvertebrates
and predatory zooplankton

Roach impact upon perch and Arctic charr, forcing greater food
niche overlap between these native species
SI mixing models
11
10
9

δ15N (‰)

8
7
6
5
4
3
-32

-30

-28

-26
13

δ C (‰)

-24

-22

1.0

Predatory zooplankton

Macroinverts

Daphnia

Chironomids

0.8
0.6
0.4
0.2
0.0
1982

1987

Predatory zooplankton

1.0
0.8

1992

1997

Macroinverts

2002

Daphnia

2007

2012

Chironomids
SI-derived metrics

Layman et al 2007 a & b
SI-derived metrics

Grey & Jackson 2012
Diet shifts in isotope space
Pre-Roach
Expansion
(1986 – 87)

Post-Roach
Expansion
(2007 & 2009)
Pike
Charr
Perch
Zoopl.
Macroinv.
Roach

Pike
Charr
Perch
Zoopl.
Macroinv.

δ 15N (‰)

δ 13C (‰)

δ 13C (‰)
Diet shifts in isotope space
Early Roach
Period
(1993 – 95)

Recent Roach
Period
(2007 & 2009)
Pike
Charr
Perch
Zoopl.
Macroinv.
Roach

Pike
Charr
Perch
Zoopl.
Macroinv.
Roach
δ 15N (‰)

δ 13C (‰)

δ 13C (‰)
Samples for SIA
Pike GCA
Pike GCA
Pike diet
Carbon routing to pike

1.0

Pelagic carbon (%)

0.8

N Basin
S Basin
y = -0.011x + 22.569

0.6

0.4

0.2

0.0
1980

1990

2000

Year

2010
Food chain length

9.5

Food chain length (‰)

9.0

Zooplankton baseline
Macroinvertebrate baseline

8.5
8.0
7.5
7.0
6.5
6.0
5.5
1980

1990

2000

Year

2010
Summary
•

Distinct shifts in niche space of native fish following roach expansion

•

Changes to pike diet: reduction in charr; increase in perch + addition
of roach

•

Significant shift (SB) in routing of carbon from pelagic to littoral

•

Increase in overall food chain length post roach expansion; slight
but significant increase in efficiency if routed via littoral
http://www.windermere-science.org.uk/home
@WinSci

Altered food web structure

  • 1.
    Altered food webstructure Jonathan Grey1, Peter Smyntek1 & Ian Winfield2 1 Aquatic Ecology Group, School of Biological & Chemical Sciences, Queen Mary University of London, UK 2 Lake Ecosystems Group, Centre for Ecology & Hydrology, Lancaster, UK
  • 2.
    Food web structure Carnivores Perch Changesin Pike diet Planktivores Increase in roach Reduction in zooplankton Zooplankton Increase in Phytoplankton phytoplankton Increased internal Pload Chemistry Climate change Reduction in Arctic charr Warmer water Prolonged stratification Reduction in oxygen at depth Physics
  • 3.
    SIA samples • For stableisotope analyses: • 980 individual fish • 250 zooplankton samples • 140 macroinvertebrate samples • Spanning 27 years (1985-2011)
  • 4.
    Archives & isotopes -12 A -14 Acidifiedscale δ13C (‰) -16 -18 -20 -22 -24 -26 y = 0.99x + 0.64; r2 = 0.92; P<0.0001 -28 -30 -30 -28 -26 -24 -22 -20 -18 -16 -14 -12 Defatted muscle δ13C (‰) eg Grey et al 2009
  • 5.
    Hypotheses • Increase in roachcaused: a change in pike diet through provision of extra / alternative prey; and a shift in niche space for native equivalents • Shift in routing of carbon through food web to top predator (pike) from predominantly pelagic to littoral • Increased efficiency of food web via reduced trophic linkage
  • 6.
    Recap from IJW • Dietchanges alongside roach increase: • • Arctic charr decreases in macroinvertebrates and Daphnia, increase in zooplanktivores • • Perch decreases in macroinvertebrates and Daphnia, increase in zooplanktivores Roach remarkably stable and dominated by macroinvertebrates and predatory zooplankton Roach impact upon perch and Arctic charr, forcing greater food niche overlap between these native species
  • 7.
    SI mixing models 11 10 9 δ15N(‰) 8 7 6 5 4 3 -32 -30 -28 -26 13 δ C (‰) -24 -22 1.0 Predatory zooplankton Macroinverts Daphnia Chironomids 0.8 0.6 0.4 0.2 0.0 1982 1987 Predatory zooplankton 1.0 0.8 1992 1997 Macroinverts 2002 Daphnia 2007 2012 Chironomids
  • 8.
  • 9.
  • 10.
    Diet shifts inisotope space Pre-Roach Expansion (1986 – 87) Post-Roach Expansion (2007 & 2009) Pike Charr Perch Zoopl. Macroinv. Roach Pike Charr Perch Zoopl. Macroinv. δ 15N (‰) δ 13C (‰) δ 13C (‰)
  • 11.
    Diet shifts inisotope space Early Roach Period (1993 – 95) Recent Roach Period (2007 & 2009) Pike Charr Perch Zoopl. Macroinv. Roach Pike Charr Perch Zoopl. Macroinv. Roach δ 15N (‰) δ 13C (‰) δ 13C (‰)
  • 12.
  • 13.
  • 14.
  • 15.
  • 16.
    Carbon routing topike 1.0 Pelagic carbon (%) 0.8 N Basin S Basin y = -0.011x + 22.569 0.6 0.4 0.2 0.0 1980 1990 2000 Year 2010
  • 17.
    Food chain length 9.5 Foodchain length (‰) 9.0 Zooplankton baseline Macroinvertebrate baseline 8.5 8.0 7.5 7.0 6.5 6.0 5.5 1980 1990 2000 Year 2010
  • 18.
    Summary • Distinct shifts inniche space of native fish following roach expansion • Changes to pike diet: reduction in charr; increase in perch + addition of roach • Significant shift (SB) in routing of carbon from pelagic to littoral • Increase in overall food chain length post roach expansion; slight but significant increase in efficiency if routed via littoral http://www.windermere-science.org.uk/home @WinSci

Editor's Notes

  • #4 The second reason is historical. The Freshwater Biological Association (or then The Freshwater Biological Association of the British Empire) was founded in 1929, located at Wray Castle from 1931 and, from 1950 onwards, at The Ferry House- both labs on the shores of Windermere.
  • #6 The second reason is historical. The Freshwater Biological Association (or then The Freshwater Biological Association of the British Empire) was founded in 1929, located at Wray Castle from 1931 and, from 1950 onwards, at The Ferry House- both labs on the shores of Windermere.
  • #7 The second reason is historical. The Freshwater Biological Association (or then The Freshwater Biological Association of the British Empire) was founded in 1929, located at Wray Castle from 1931 and, from 1950 onwards, at The Ferry House- both labs on the shores of Windermere.
  • #8 The second reason is historical. The Freshwater Biological Association (or then The Freshwater Biological Association of the British Empire) was founded in 1929, located at Wray Castle from 1931 and, from 1950 onwards, at The Ferry House- both labs on the shores of Windermere.
  • #11 The second reason is historical. The Freshwater Biological Association (or then The Freshwater Biological Association of the British Empire) was founded in 1929, located at Wray Castle from 1931 and, from 1950 onwards, at The Ferry House- both labs on the shores of Windermere.
  • #12 The second reason is historical. The Freshwater Biological Association (or then The Freshwater Biological Association of the British Empire) was founded in 1929, located at Wray Castle from 1931 and, from 1950 onwards, at The Ferry House- both labs on the shores of Windermere.
  • #13 The second reason is historical. The Freshwater Biological Association (or then The Freshwater Biological Association of the British Empire) was founded in 1929, located at Wray Castle from 1931 and, from 1950 onwards, at The Ferry House- both labs on the shores of Windermere.
  • #14 The second reason is historical. The Freshwater Biological Association (or then The Freshwater Biological Association of the British Empire) was founded in 1929, located at Wray Castle from 1931 and, from 1950 onwards, at The Ferry House- both labs on the shores of Windermere.
  • #15 The second reason is historical. The Freshwater Biological Association (or then The Freshwater Biological Association of the British Empire) was founded in 1929, located at Wray Castle from 1931 and, from 1950 onwards, at The Ferry House- both labs on the shores of Windermere.
  • #16 The second reason is historical. The Freshwater Biological Association (or then The Freshwater Biological Association of the British Empire) was founded in 1929, located at Wray Castle from 1931 and, from 1950 onwards, at The Ferry House- both labs on the shores of Windermere.
  • #17 The second reason is historical. The Freshwater Biological Association (or then The Freshwater Biological Association of the British Empire) was founded in 1929, located at Wray Castle from 1931 and, from 1950 onwards, at The Ferry House- both labs on the shores of Windermere.
  • #18 The second reason is historical. The Freshwater Biological Association (or then The Freshwater Biological Association of the British Empire) was founded in 1929, located at Wray Castle from 1931 and, from 1950 onwards, at The Ferry House- both labs on the shores of Windermere.
  • #19 The second reason is historical. The Freshwater Biological Association (or then The Freshwater Biological Association of the British Empire) was founded in 1929, located at Wray Castle from 1931 and, from 1950 onwards, at The Ferry House- both labs on the shores of Windermere.