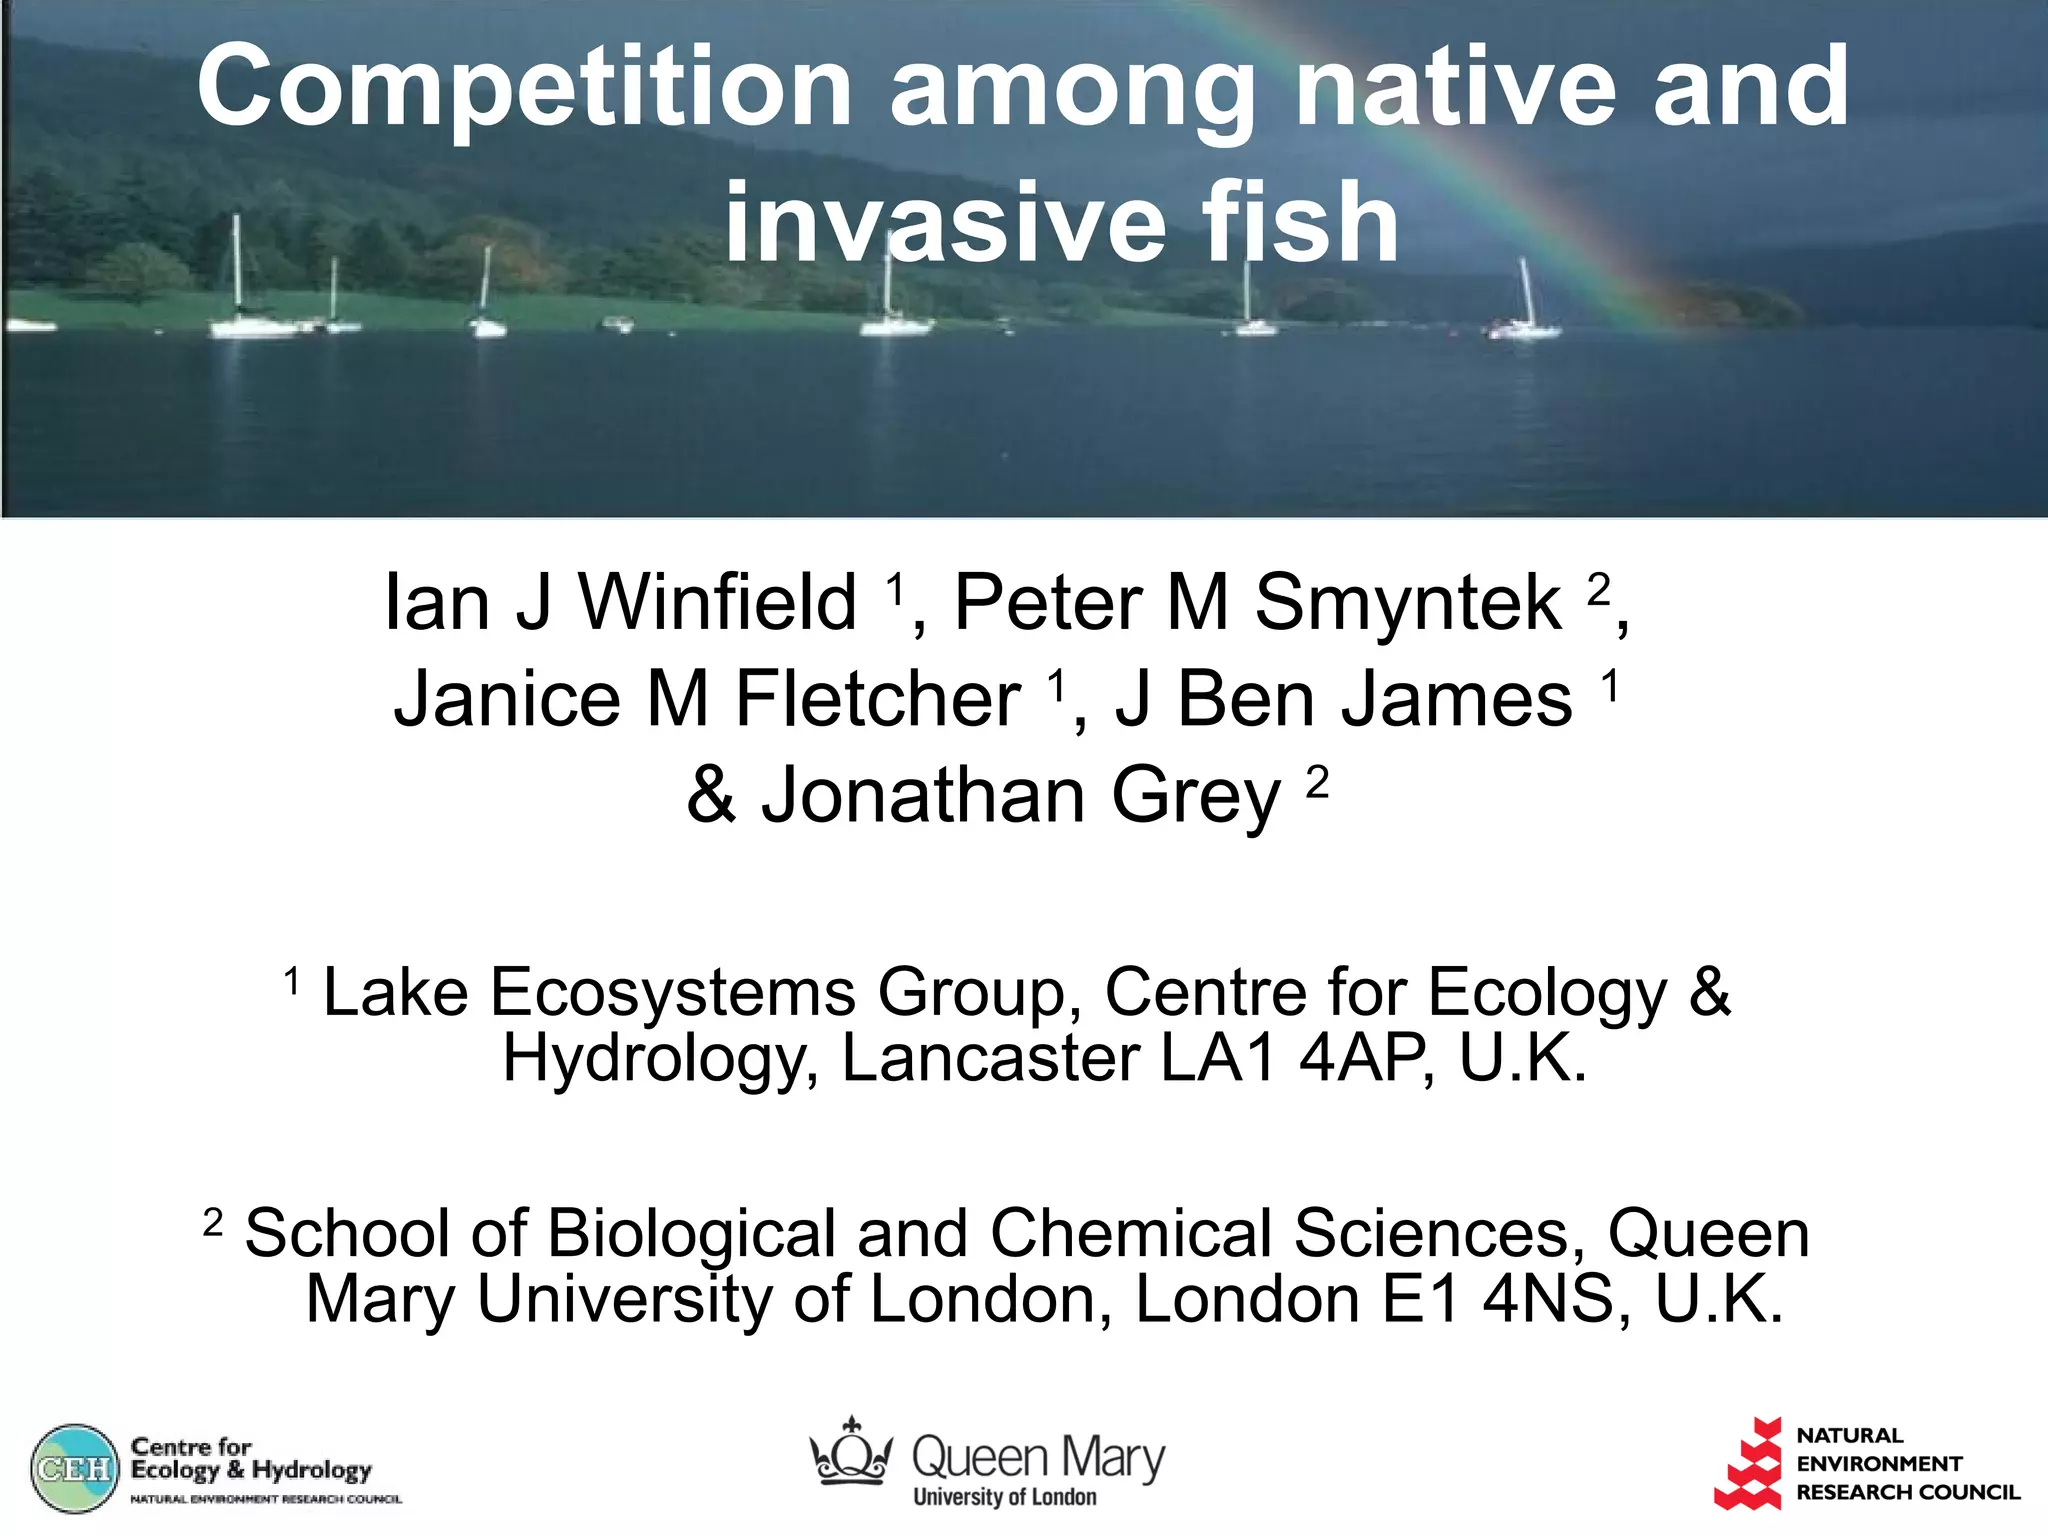
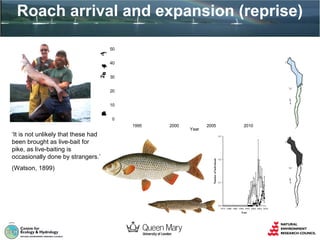
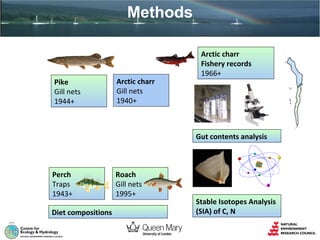
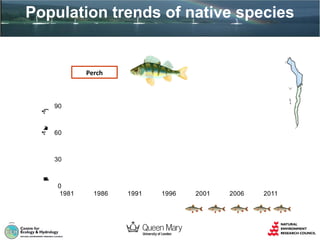
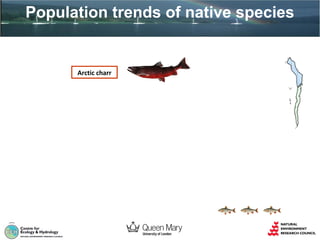
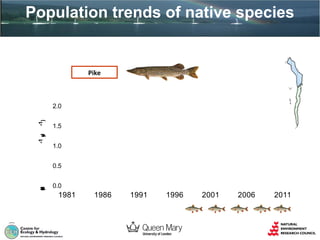
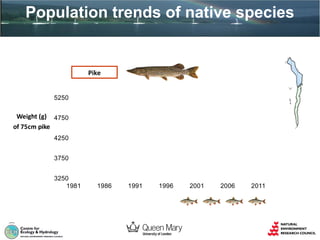
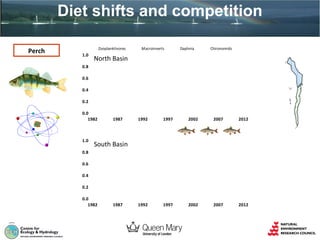
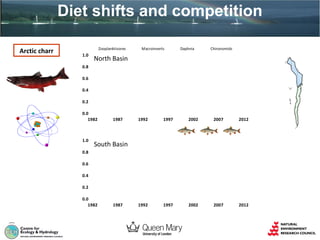
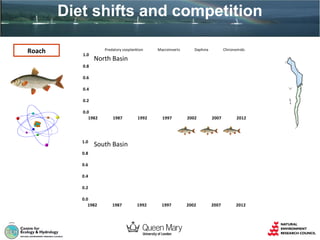
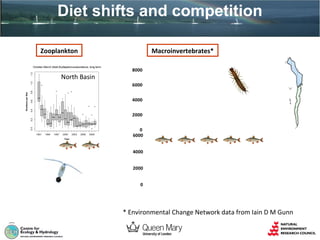
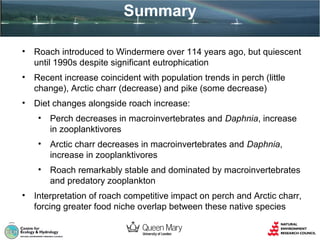
Competition among native and
invasive fish
Ian J Winfield 1, Peter M Smyntek 2,
Janice M Fletcher 1, J Ben James 1
& Jonathan Grey 2
1

2

Lake Ecosystems Group, Centre for Ecology &
Hydrology, Lancaster LA1 4AP, U.K.

School of Biological and Chemical Sciences, Queen
Mary University of London, London E1 4NS, U.K.
Introduction
Carnivores

Planktivores

Perch
Changes in
Pike diet
Increase in
roach
Reduction in
zooplankton

Zooplankton

Increase in

Phytoplankton

phytoplankton
Increased
internal Pload

Chemistry
Climate
change

Reduction in
Arctic charr

Warmer
water

Prolonged
stratification

Reduction
in oxygen
at depth

Physics
Structure of presentation
•

Introduction

•

Roach arrival and expansion (reprise)

•

Methods

•

Population trends of native species

•

Diet shifts and competition

•

Summary
Introduction
(1986)

(1991)

(2013)

(1899)

(2009)
Introduction
Arctic charr (Salvelinus alpinus)
Atlantic salmon (Salmo salar)
Common bream (Abramis brama)
Brown trout (Salmo trutta)
Bullhead (Cottus gobio)
European eel (Anguilla anguilla)
European perch (Perca fluviatilis)
Minnow (Phoxinus phoxinus)
Pike (Esox lucius)
River lamprey (Lampetra fluviatilis)
Roach (Rutilus rutilus)
Rudd (Scardinius erythrophthalmus)
Sea lamprey (Petromyzon marinus)
Stone loach (Barbatula barbatula)
Tench (Tinca tinca)
Three-spined stickleback (Gasterosteus aculeatus)
Roach arrival and expansion (reprise)

2n -1
t a
e d
y

-1
)

50
40
30
20

m
0
1
h
s
i
F
(
E
U
P
C

10
0
1995

‘It is not unlikely that these had
been brought as live-bait for
pike, as live-baiting is
occasionally done by strangers.’
(Watson, 1899)

2000

Year

2005

2010
Roach arrival and expansion (reprise)
6000

-1)

5000
4000
3000

h
s
i
f
(
e
c
a
d
n
u
b
A

2000
1000
0
1990

1995

2000
Year

2005

2010
Methods

Pike
Gill nets
1944+

Arctic charr
Gill nets
1940+

Perch
Traps
1943+

Roach
Gill nets
1995+

Population trends by CPUE (etc.)

Arctic charr
Fishery records
1966+

Hydroacoustics
1990+
Methods

Pike
Gill nets
1944+

Arctic charr
Gill nets
1940+

Arctic charr
Fishery records
1966+

Gut contents analysis

Perch
Traps
1943+
Diet compositions

Roach
Gill nets
1995+

Stable Isotopes Analysis
(SIA) of C, N
Population trends of native species

-1 w
k
e

-1)

Perch

90

60

p
a
r
t
h
s
i
f
(
E
U
P
C

30

0
1981

1986

1991

1996

2001

2006

2011
Population trends of native species

Arctic charr
Population trends of native species

Pike

-1 d
y
a

-1)

2.0
1.5
1.0

t
e
n
h
s
i
f
(
E
U
P
C

0.5
0.0

1981

1986

1991

1996

2001

2006

2011
Population trends of native species

Pike
5250

Weight (g) 4750
of 75cm pike
4250
3750
3250
1981

1986

1991

1996

2001

2006

2011
Diet shifts and competition
Perch

Zooplanktivores

1.0

Macroinverts

Daphnia

Chironomids

North Basin

0.8
0.6
0.4
0.2
0.0
1982

1987
Zooplanktivores

1.0

1992

1997

Macroinverts

2002
Daphnia

2007

2012

Chironomids

South Basin

0.8
0.6
0.4
0.2
0.0
1982

1987

1992

1997

2002

2007

2012
Diet shifts and competition
Arctic charr

Zooplanktivores

1.0

Macroinverts

Daphnia

Chironomids

North Basin

0.8
0.6
0.4
0.2
0.0
1982

1987
Zooplanktivores

1.0

1992

1997

Macroinverts

2002
Daphnia

2007

2012

Chironomids

South Basin

0.8
0.6
0.4
0.2
0.0
1982

1987

1992

1997

2002

2007

2012
Diet shifts and competition
Roach

1.0

Predatory zooplankton

Macroinverts

Daphnia

Chironomids

North Basin

0.8
0.6
0.4
0.2
0.0
1982

1987

1992

Predatory zooplankton

1.0

1997

Macroinverts

2002

Daphnia

2007

2012

Chironomids

South Basin

0.8
0.6
0.4
0.2
0.0
1982

1987

1992

1997

2002

2007

2012
Diet shifts and competition
Zooplankton

Macroinvertebrates*

October-March Adult Eudiaptomus abundance, long-term

8000

0.8

6000

0.2

0.4

0.6

4000

0.0

Numbers per litre

1.0

1.2

North Basin

1991

1994

1997

2000
Year

2003

2006

Total
macroinverts.
caught (3 min.
kick sampling)

2009

2000
0
6000
4000
2000
0

* Environmental Change Network data from Iain D M Gunn
Summary
•

Roach introduced to Windermere over 114 years ago, but quiescent
until 1990s despite significant eutrophication

•

Recent increase coincident with population trends in perch (little
change), Arctic charr (decrease) and pike (some decrease)

•

Diet changes alongside roach increase:
•
•

Arctic charr decreases in macroinvertebrates and Daphnia,
increase in zooplanktivores

•
•

Perch decreases in macroinvertebrates and Daphnia, increase
in zooplanktivores

Roach remarkably stable and dominated by macroinvertebrates
and predatory zooplankton

Interpretation of roach competitive impact on perch and Arctic charr,
forcing greater food niche overlap between these native species
Acknowledgements
•

They say they want to help me but with the stuff they keep on sayin’,
I think those guys just wanna keep on playin’

Competition among native and invasive fish

  • 1.
    Competition among nativeand invasive fish Ian J Winfield 1, Peter M Smyntek 2, Janice M Fletcher 1, J Ben James 1 & Jonathan Grey 2 1 2 Lake Ecosystems Group, Centre for Ecology & Hydrology, Lancaster LA1 4AP, U.K. School of Biological and Chemical Sciences, Queen Mary University of London, London E1 4NS, U.K.
  • 2.
    Introduction Carnivores Planktivores Perch Changes in Pike diet Increasein roach Reduction in zooplankton Zooplankton Increase in Phytoplankton phytoplankton Increased internal Pload Chemistry Climate change Reduction in Arctic charr Warmer water Prolonged stratification Reduction in oxygen at depth Physics
  • 3.
    Structure of presentation • Introduction • Roacharrival and expansion (reprise) • Methods • Population trends of native species • Diet shifts and competition • Summary
  • 4.
  • 5.
    Introduction Arctic charr (Salvelinusalpinus) Atlantic salmon (Salmo salar) Common bream (Abramis brama) Brown trout (Salmo trutta) Bullhead (Cottus gobio) European eel (Anguilla anguilla) European perch (Perca fluviatilis) Minnow (Phoxinus phoxinus) Pike (Esox lucius) River lamprey (Lampetra fluviatilis) Roach (Rutilus rutilus) Rudd (Scardinius erythrophthalmus) Sea lamprey (Petromyzon marinus) Stone loach (Barbatula barbatula) Tench (Tinca tinca) Three-spined stickleback (Gasterosteus aculeatus)
  • 6.
    Roach arrival andexpansion (reprise) 2n -1 t a e d y -1 ) 50 40 30 20 m 0 1 h s i F ( E U P C 10 0 1995 ‘It is not unlikely that these had been brought as live-bait for pike, as live-baiting is occasionally done by strangers.’ (Watson, 1899) 2000 Year 2005 2010
  • 7.
    Roach arrival andexpansion (reprise) 6000 -1) 5000 4000 3000 h s i f ( e c a d n u b A 2000 1000 0 1990 1995 2000 Year 2005 2010
  • 8.
    Methods Pike Gill nets 1944+ Arctic charr Gillnets 1940+ Perch Traps 1943+ Roach Gill nets 1995+ Population trends by CPUE (etc.) Arctic charr Fishery records 1966+ Hydroacoustics 1990+
  • 9.
    Methods Pike Gill nets 1944+ Arctic charr Gillnets 1940+ Arctic charr Fishery records 1966+ Gut contents analysis Perch Traps 1943+ Diet compositions Roach Gill nets 1995+ Stable Isotopes Analysis (SIA) of C, N
  • 10.
    Population trends ofnative species -1 w k e -1) Perch 90 60 p a r t h s i f ( E U P C 30 0 1981 1986 1991 1996 2001 2006 2011
  • 11.
    Population trends ofnative species Arctic charr
  • 12.
    Population trends ofnative species Pike -1 d y a -1) 2.0 1.5 1.0 t e n h s i f ( E U P C 0.5 0.0 1981 1986 1991 1996 2001 2006 2011
  • 13.
    Population trends ofnative species Pike 5250 Weight (g) 4750 of 75cm pike 4250 3750 3250 1981 1986 1991 1996 2001 2006 2011
  • 14.
    Diet shifts andcompetition Perch Zooplanktivores 1.0 Macroinverts Daphnia Chironomids North Basin 0.8 0.6 0.4 0.2 0.0 1982 1987 Zooplanktivores 1.0 1992 1997 Macroinverts 2002 Daphnia 2007 2012 Chironomids South Basin 0.8 0.6 0.4 0.2 0.0 1982 1987 1992 1997 2002 2007 2012
  • 15.
    Diet shifts andcompetition Arctic charr Zooplanktivores 1.0 Macroinverts Daphnia Chironomids North Basin 0.8 0.6 0.4 0.2 0.0 1982 1987 Zooplanktivores 1.0 1992 1997 Macroinverts 2002 Daphnia 2007 2012 Chironomids South Basin 0.8 0.6 0.4 0.2 0.0 1982 1987 1992 1997 2002 2007 2012
  • 16.
    Diet shifts andcompetition Roach 1.0 Predatory zooplankton Macroinverts Daphnia Chironomids North Basin 0.8 0.6 0.4 0.2 0.0 1982 1987 1992 Predatory zooplankton 1.0 1997 Macroinverts 2002 Daphnia 2007 2012 Chironomids South Basin 0.8 0.6 0.4 0.2 0.0 1982 1987 1992 1997 2002 2007 2012
  • 17.
    Diet shifts andcompetition Zooplankton Macroinvertebrates* October-March Adult Eudiaptomus abundance, long-term 8000 0.8 6000 0.2 0.4 0.6 4000 0.0 Numbers per litre 1.0 1.2 North Basin 1991 1994 1997 2000 Year 2003 2006 Total macroinverts. caught (3 min. kick sampling) 2009 2000 0 6000 4000 2000 0 * Environmental Change Network data from Iain D M Gunn
  • 18.
    Summary • Roach introduced toWindermere over 114 years ago, but quiescent until 1990s despite significant eutrophication • Recent increase coincident with population trends in perch (little change), Arctic charr (decrease) and pike (some decrease) • Diet changes alongside roach increase: • • Arctic charr decreases in macroinvertebrates and Daphnia, increase in zooplanktivores • • Perch decreases in macroinvertebrates and Daphnia, increase in zooplanktivores Roach remarkably stable and dominated by macroinvertebrates and predatory zooplankton Interpretation of roach competitive impact on perch and Arctic charr, forcing greater food niche overlap between these native species
  • 19.
    Acknowledgements • They say theywant to help me but with the stuff they keep on sayin’, I think those guys just wanna keep on playin’